Weighted Kaplan-Meier plot
MAIC-weighted survival curves
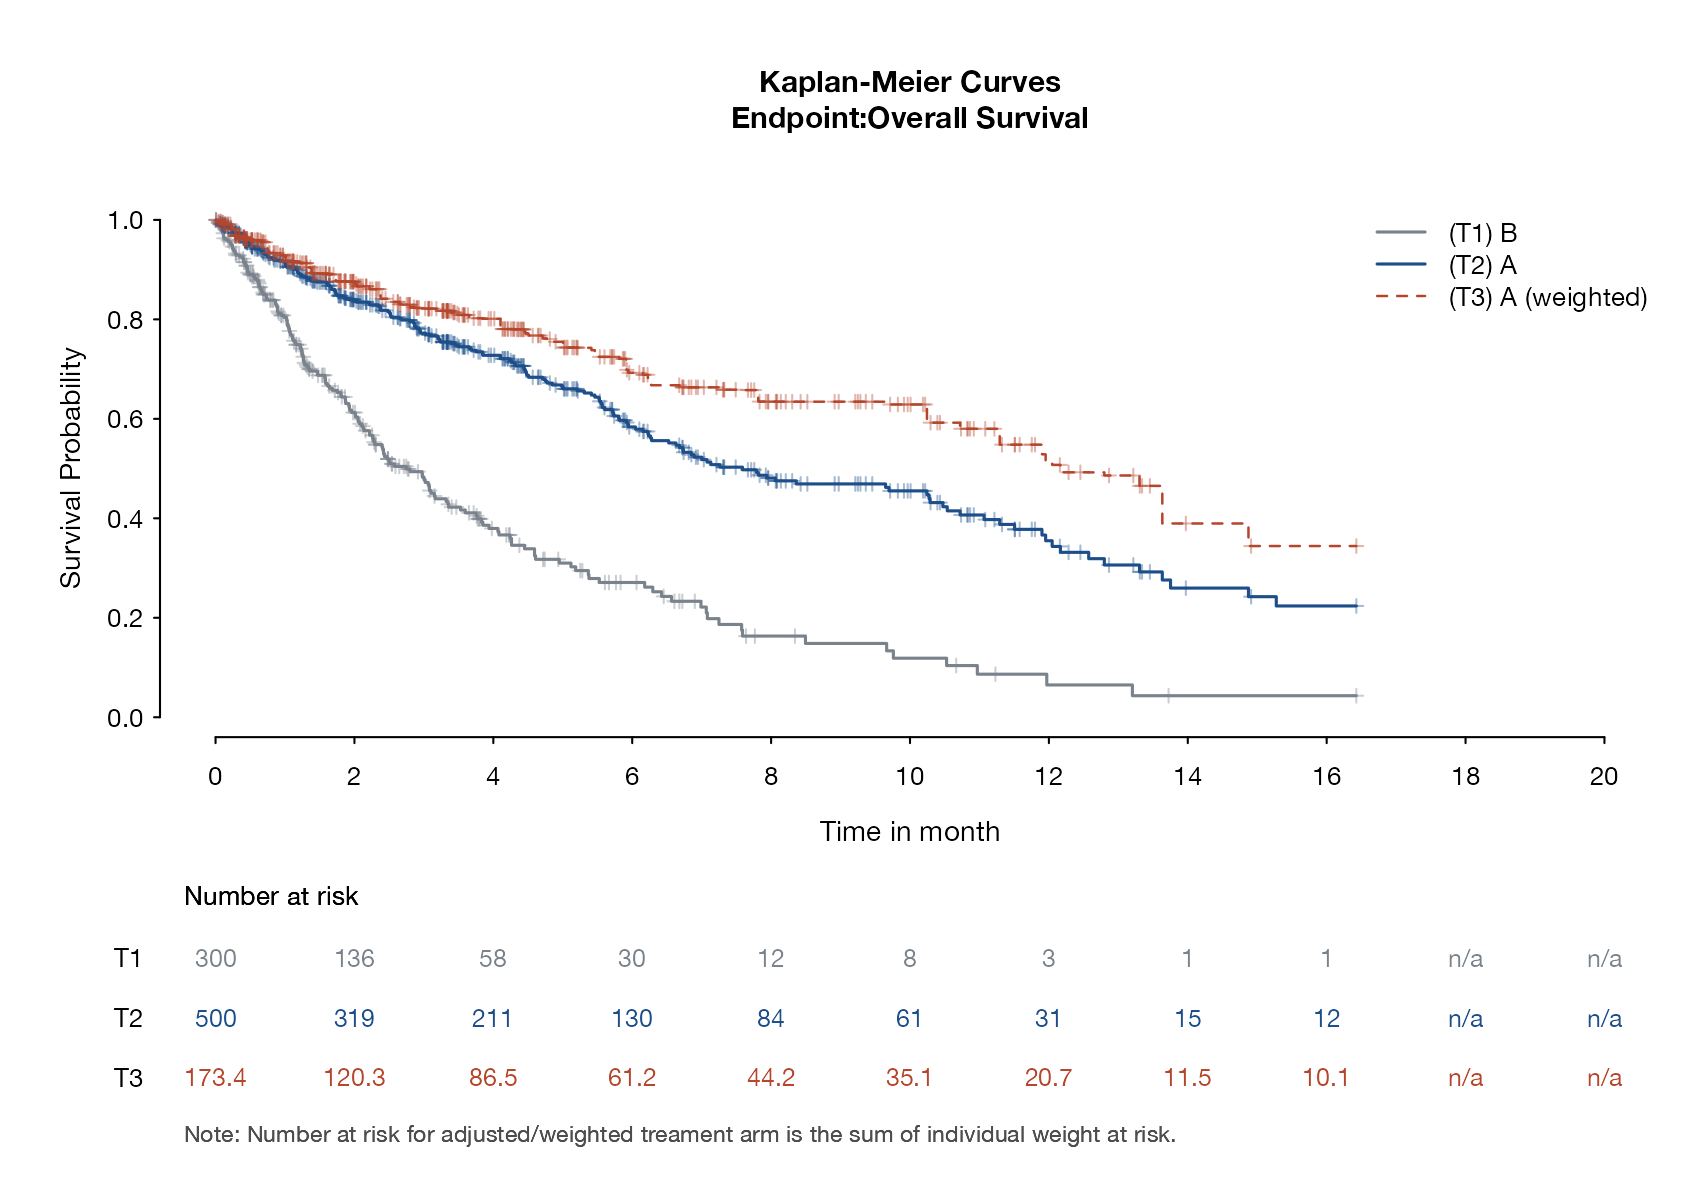
maicplus::adtte_sat, pseudo_ipd_sat, weighted_sat.
maicplus::kmplot(); survival::survfit(weights = )
What it shows
For time-to-event outcomes, a single hazard ratio hides how survival evolves. The weighted Kaplan-Meier plot shows the IPD treatment’s survival curve before and after weighting to the comparator population, next to the comparator’s curve reconstructed from the publication. The gap between the unweighted and weighted curves shows how much population adjustment matters; the gap between the weighted curve and the comparator is the adjusted comparison on the absolute scale.
How to read it
- Horizontal axis: time; vertical axis: survival probability.
- Curves: comparator (reconstructed), IPD treatment unweighted, IPD treatment weighted.
- Risk table: numbers at risk; for the weighted arm, the sum of weights at risk.
Interpretation
Weighting moves treatment A’s curve upward: the comparator population is younger and fitter, and the weighted A curve reaches a median of roughly a year against about 8 months unweighted. Treatment B’s reconstructed curve falls much faster, with a median of about 3.5 months. The weighted risk table falls steeply, a reminder that the effective sample size behind the weighted curve is far smaller than 500.
Pitfalls
- Weighting does not fix differences in follow-up, censoring patterns, or outcome definitions between trials.
- Unanchored comparisons like this one assume all prognostic factors and effect modifiers are balanced, which is rarely defensible.
- Weighted numbers at risk are not counts of patients.
- Check proportional hazards before summarizing the gap as a single hazard ratio.
Code
library(maicplus)

# Single-arm IPD (treatment A) and pseudo-IPD reconstructed from the
# published Kaplan-Meier curve of the comparator (treatment B)
data(weighted_sat)
data(adtte_sat)
data(pseudo_ipd_sat)

# Kaplan-Meier curves for A before and after MAIC weighting, and for B
kmplot(
  weights_object = weighted_sat,
  tte_ipd = adtte_sat, tte_pseudo_ipd = pseudo_ipd_sat,
  trt_var_ipd = "ARM", trt_var_agd = "ARM",
  trt_ipd = "A", trt_agd = "B",
  endpoint_name = "Overall Survival",
  km_conf_type = "log-log", time_scale = "month",
  time_grid = seq(0, 20, by = 2),
  use_colors = c("#7a828c", "#1d4e89", "#b5452b"),
  use_pch_cex = 0.65, use_pch_alpha = 100
)
References
- Phillippo DM, Ades AE, Dias S, Palmer S, Abrams KR, Welton NJ. NICE DSU Technical Support Document 18: Methods for population-adjusted indirect comparisons in submissions to NICE. 2016. sheffield.ac.uk/nice-dsu
- Signorovitch JE, Sikirica V, Erder MH, et al. Matching-adjusted indirect comparisons: a new tool for timely comparative effectiveness research. Value Health. 2012;15:940-947. doi:10.1016/j.jval.2012.05.004