Component heat plot
Pairwise component combination heat map
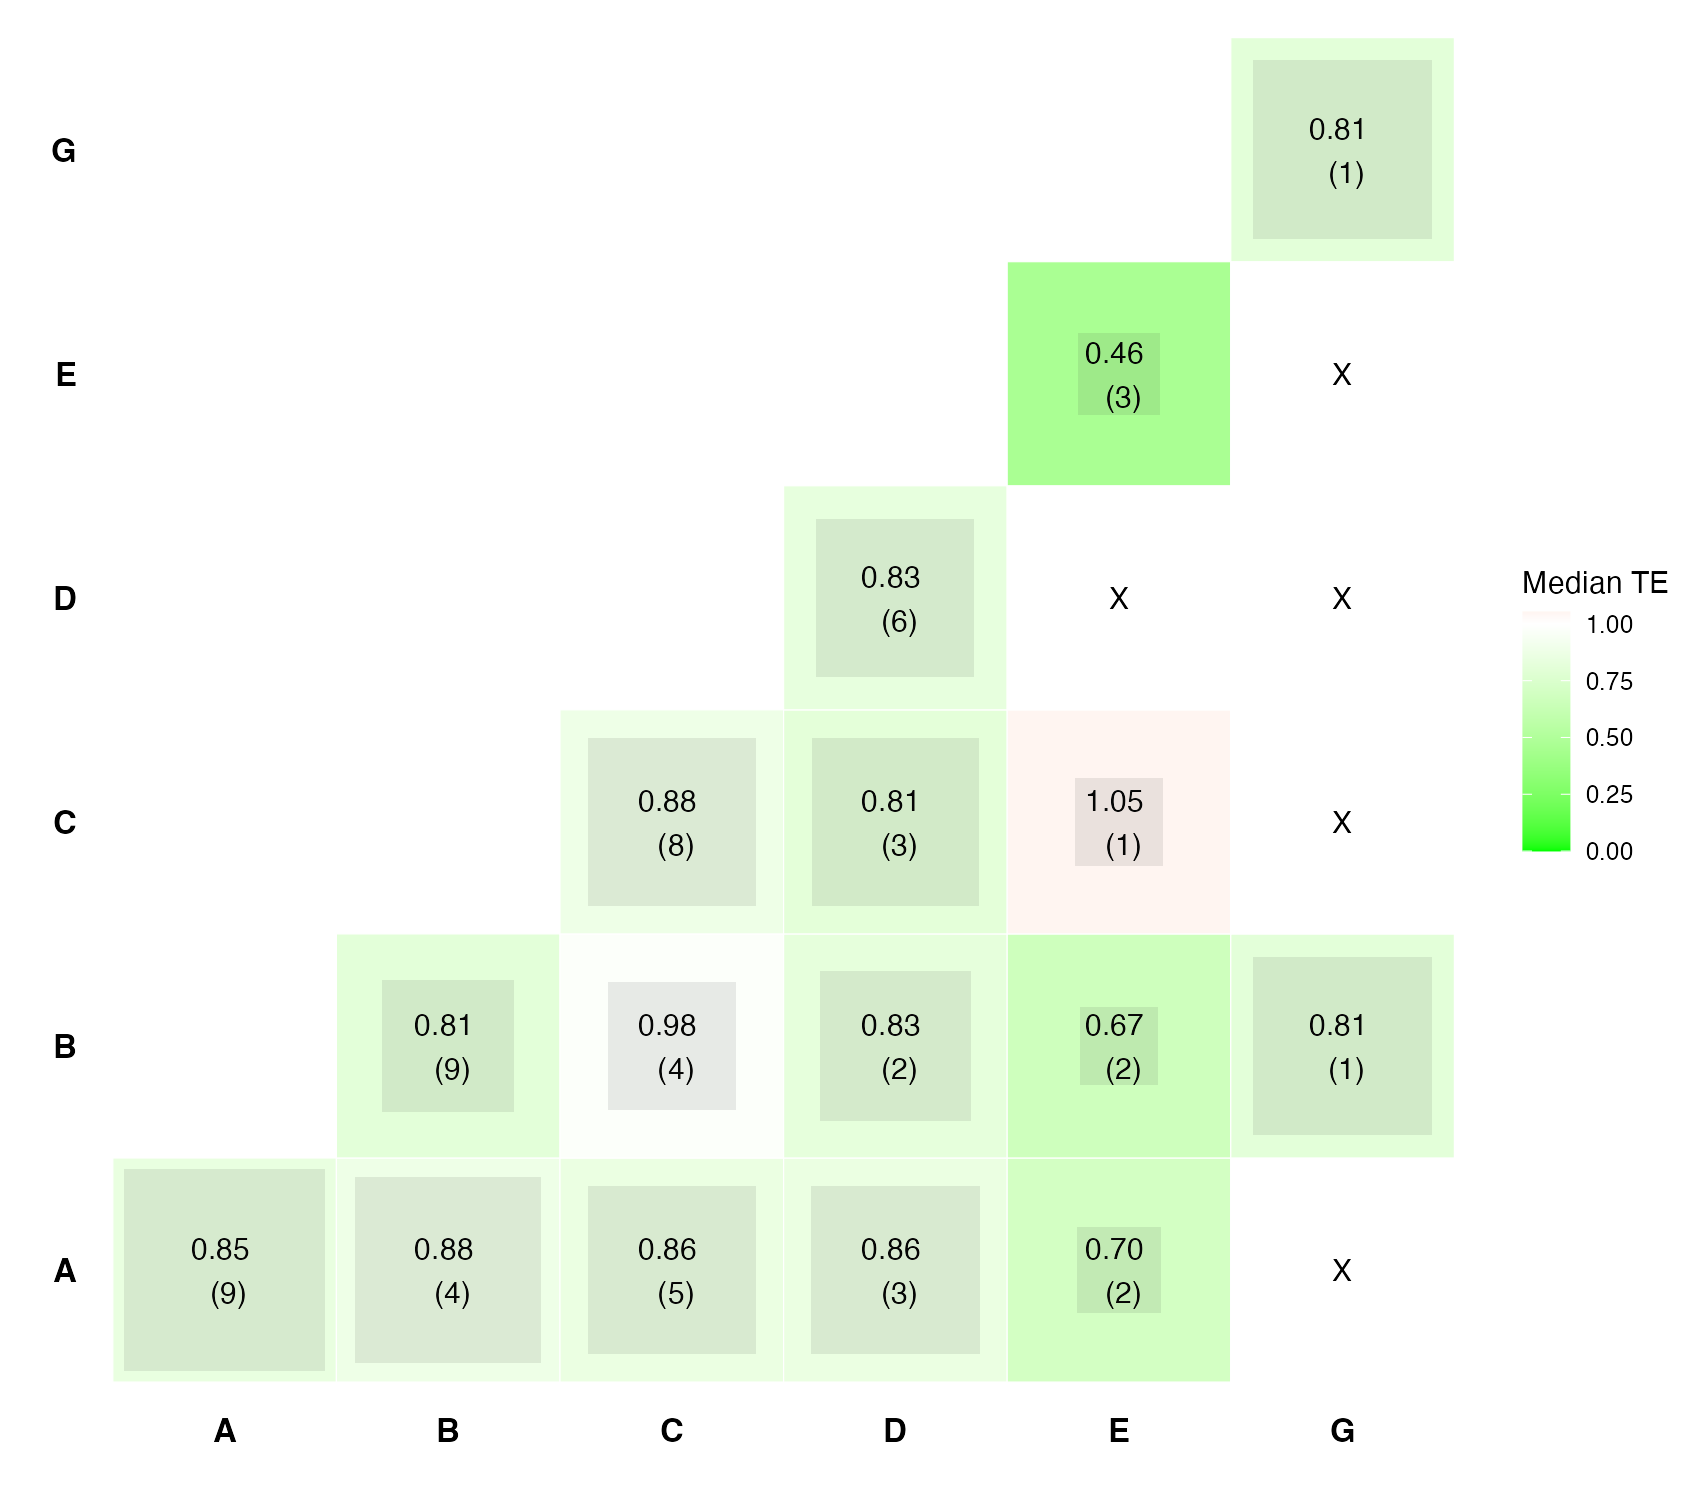
viscomp::nmaMACE (artificial).
viscomp::heatcomp()
What it shows
Seitidis and colleagues developed a set of graphics for exploring networks of multicomponent interventions. The component heat plot arranges components in rows and columns. Each cell summarizes (by median or mean) the NMA relative effects of all interventions that contain both components; diagonal cells summarize single components. Color intensity highlights promising pairs, and crossed cells show pairs never studied together.
How to read it
- Rows and columns: components.
- Cells: summary of the relative effects of interventions containing both components; parentheses give how many interventions contribute.
- Color: magnitude of the summary effect; here odds ratios below 1 (green) mean fewer events.
- X: combination not present in the network.
Interpretation
Component E stands out: interventions containing it have the lowest median odds ratios for major adverse cardiovascular events (0.46 alone, 0.67 with B, 0.70 with A), whereas its combination with C sits near 1. Many pairs were never studied together (X), and most cells rest on one to three interventions. The plot points to combinations worth modeling formally in a component NMA, not to estimates to report.
Pitfalls
- Summaries of intervention effects are descriptive and confounded by the other components present.
- Cells based on one intervention are fragile.
- The display is exploratory; it does not replace a CNMA model.
Code
library(netmeta)
library(viscomp)

# Example network of multicomponent interventions (components A to G plus
# usual care) for major adverse cardiovascular events, shipped with viscomp
data(nmaMACE)

# Heat map of pairs of components: each cell summarizes the relative effects
# of interventions that include both components (diagonal: single components);
# numbers in parentheses count the interventions involved
heatcomp(nmaMACE, median = TRUE, random = TRUE)
References
- Seitidis G, Tsokani S, Christogiannis C, et al. Graphical tools for visualizing the results of network meta-analysis of multicomponent interventions. Res Synth Methods. 2023;14:382-395. doi:10.1002/jrsm.1617