NMI interpolation plot
Effect modifier versus relative effect interpolation plot
ggplot2 (shown); NMI code from the method’s authors
What it shows
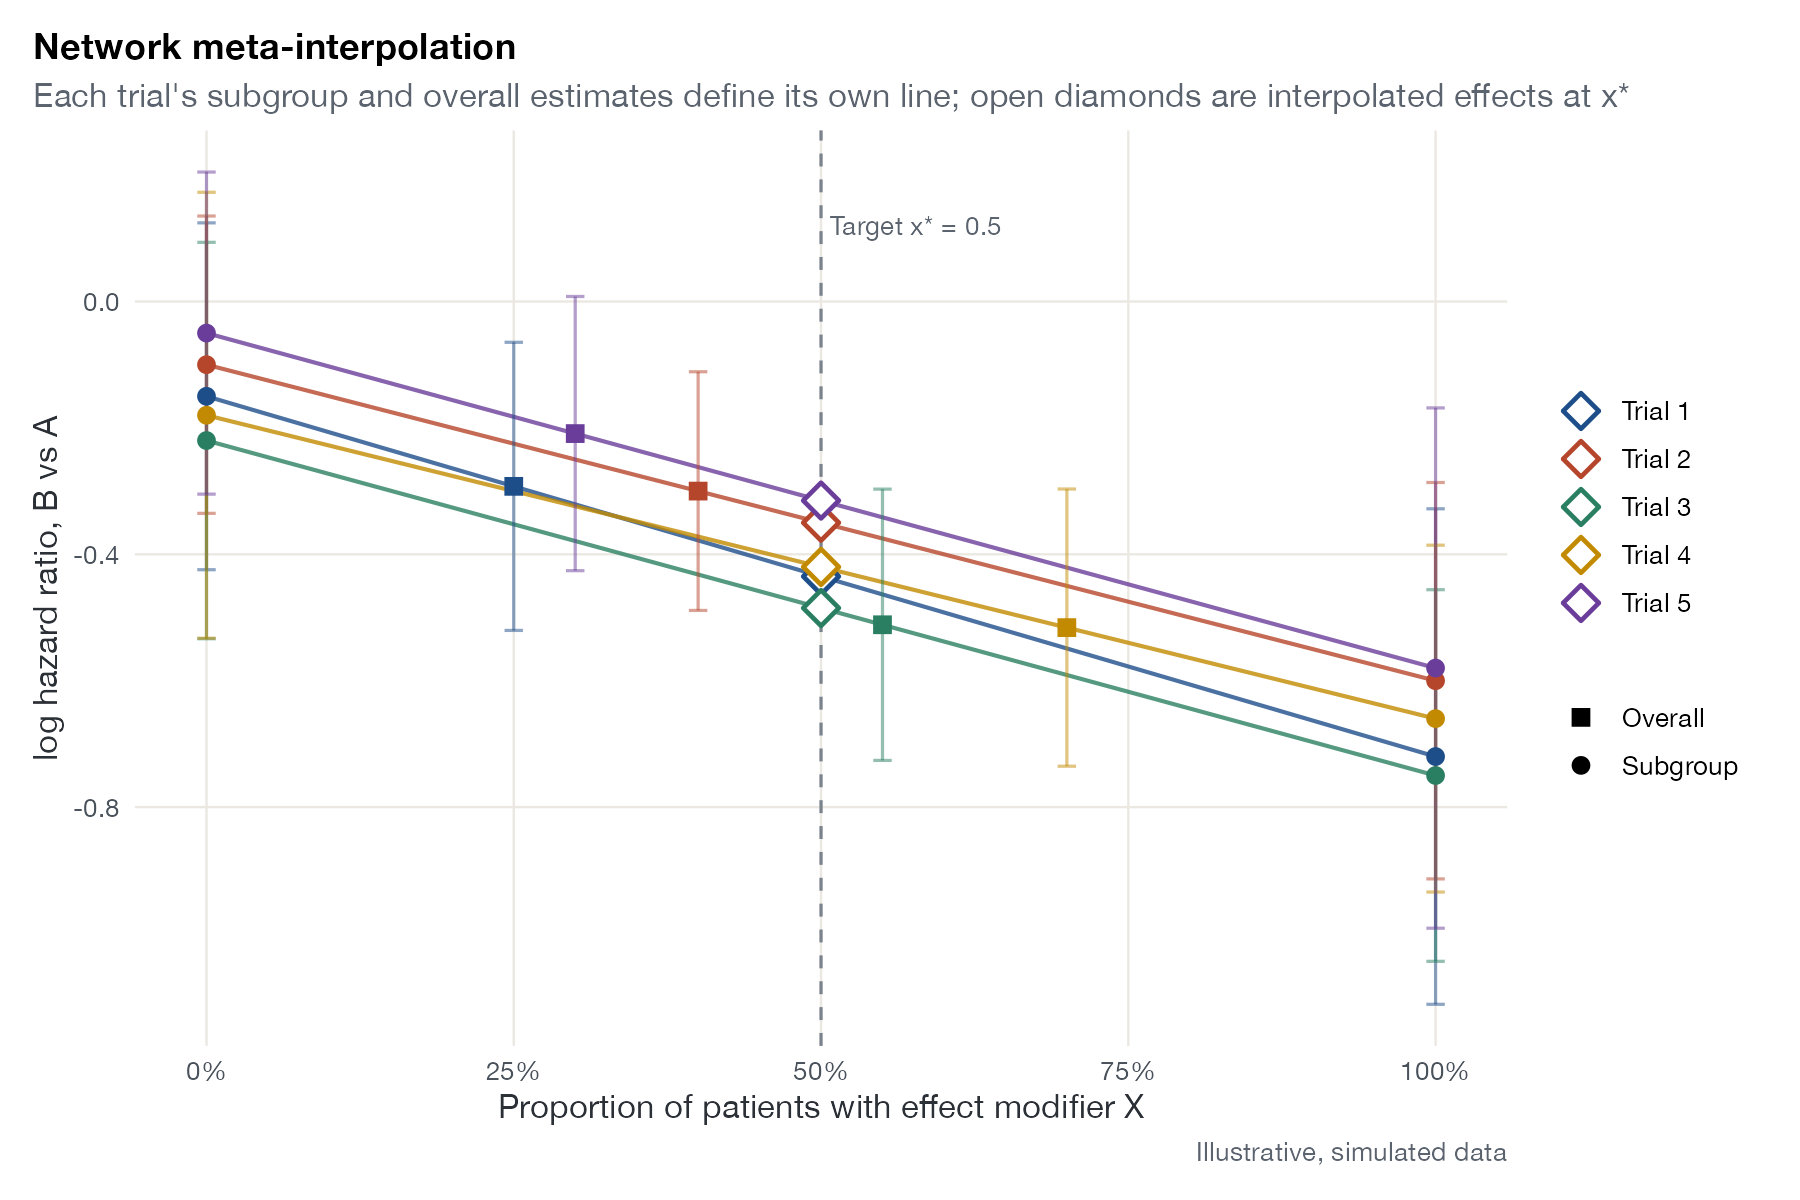
Network meta-interpolation (Harari and colleagues) exploits a simple fact: a trial that reports its overall effect and its effects in subgroups of an effect modifier provides several points on its own effect-modifier relationship. Plotting those points against the proportion of patients with the modifier, and drawing each trial’s line, shows how NMI interpolates every trial to the same target value before running a standard NMA. The display makes explicit what the method borrows from subgroup analyses, instead of hiding it in a regression coefficient.
How to read it
- Horizontal axis: proportion of patients with the effect modifier.
- Vertical axis: relative treatment effect (here log HR).
- Circles at 0 and 1: subgroup estimates; squares: overall estimate at the trial’s own prevalence.
- Lines: each trial’s interpolation; dashed vertical line: target prevalence.
- Open diamonds: interpolated effects entering the NMA.
Interpretation
Every trial shows a stronger benefit when X is present: log HRs fall from about −0.1 to about −0.65 across the range. Trials that enrolled few X-positive patients (Trial 1, Trial 5) have overall estimates near their X = 0 values and are moved down the most when interpolated to 50%. Differences between the interpolated effects now reflect differences between trials other than the prevalence of X.
Pitfalls
- NMI needs overall and subgroup effects with standard errors from every trial; missing subgroups limit it (see the subgroup availability matrix).
- With several effect modifiers, the correlation between them must come from IPD or be assumed.
- A straight line between subgroups assumes the effect is linear in prevalence on the chosen scale.
- Interpolation is supported within the observed range; extrapolation beyond it is not.
Code
library(ggplot2)

# Five trials of B vs A report an overall log HR and log HRs within the two
# subgroups of a binary effect modifier X (for example, biomarker positive).
# Illustrative, simulated summaries.
trials <- data.frame(
  trial = paste("Trial", 1:5),
  p_x = c(0.25, 0.40, 0.55, 0.70, 0.30),     # proportion with X = 1
  d0 = c(-0.15, -0.10, -0.22, -0.18, -0.05),  # log HR when X = 0
  d1 = c(-0.72, -0.60, -0.75, -0.66, -0.58),  # log HR when X = 1
  se0 = c(0.14, 0.12, 0.16, 0.18, 0.13), se1 = c(0.20, 0.16, 0.15, 0.14, 0.21)
)
trials$d_all <- with(trials, (1 - p_x) * d0 + p_x * d1)
trials$se_all <- with(trials, sqrt((1 - p_x)^2 * se0^2 + p_x^2 * se1^2))

# NMI: within each trial, the three estimates define a line in X; interpolate
# (not extrapolate) every trial to the target prevalence x* = 0.5
x_star <- 0.5
pts <- rbind(
  data.frame(trial = trials$trial, x = 0, d = trials$d0, se = trials$se0, type = "Subgroup"),
  data.frame(trial = trials$trial, x = 1, d = trials$d1, se = trials$se1, type = "Subgroup"),
  data.frame(trial = trials$trial, x = trials$p_x, d = trials$d_all, se = trials$se_all, type = "Overall")
)
interp <- data.frame(trial = trials$trial, x = x_star,
                     d = with(trials, d0 + x_star * (d1 - d0)))

ggplot(pts, aes(x, d, colour = trial)) +
  geom_vline(xintercept = x_star, linetype = "dashed", colour = "#7a828c") +
  annotate("text", x = x_star, y = 0.12, label = "Target x* = 0.5", hjust = -0.05,
           size = 3.4, colour = "#5b636e") +
  geom_segment(data = trials, aes(x = 0, xend = 1, y = d0, yend = d1, colour = trial),
               linewidth = 0.7, alpha = 0.8) +
  geom_errorbar(aes(ymin = d - 1.96 * se, ymax = d + 1.96 * se), width = 0.015, alpha = 0.5) +
  geom_point(aes(shape = type), size = 2.8) +
  geom_point(data = interp, shape = 23, size = 4, fill = "white", stroke = 1.2) +
  scale_shape_manual(values = c(Subgroup = 16, Overall = 15), name = NULL) +
  scale_x_continuous(labels = scales::percent) +
  labs(x = "Proportion of patients with effect modifier X", y = "log hazard ratio, B vs A",
       colour = NULL, title = "Network meta-interpolation",
       subtitle = "Each trial's subgroup and overall estimates define its own line; open diamonds are interpolated effects at x*",
       caption = "Illustrative, simulated data") +
  theme(legend.position = "right")
References
- Harari O, Soltanifar M, Cappelleri JC, et al. Network meta-interpolation: effect modification adjustment in network meta-analysis using subgroup analyses. Res Synth Methods. 2023;14:211-233. doi:10.1002/jrsm.1608
- Harari O, et al. Network meta-interpolation (NMI): effect modification adjustment in NMA using subgroup analyses. ISPOR Europe 2022 presentation. PDF