Trial-membership score overlap plot
Propensity score overlap plot, positivity plot
MAIC
STC
ML-NMR
Distributions of the estimated probability of belonging to one trial, drawn separately for each trial, to assess common support.
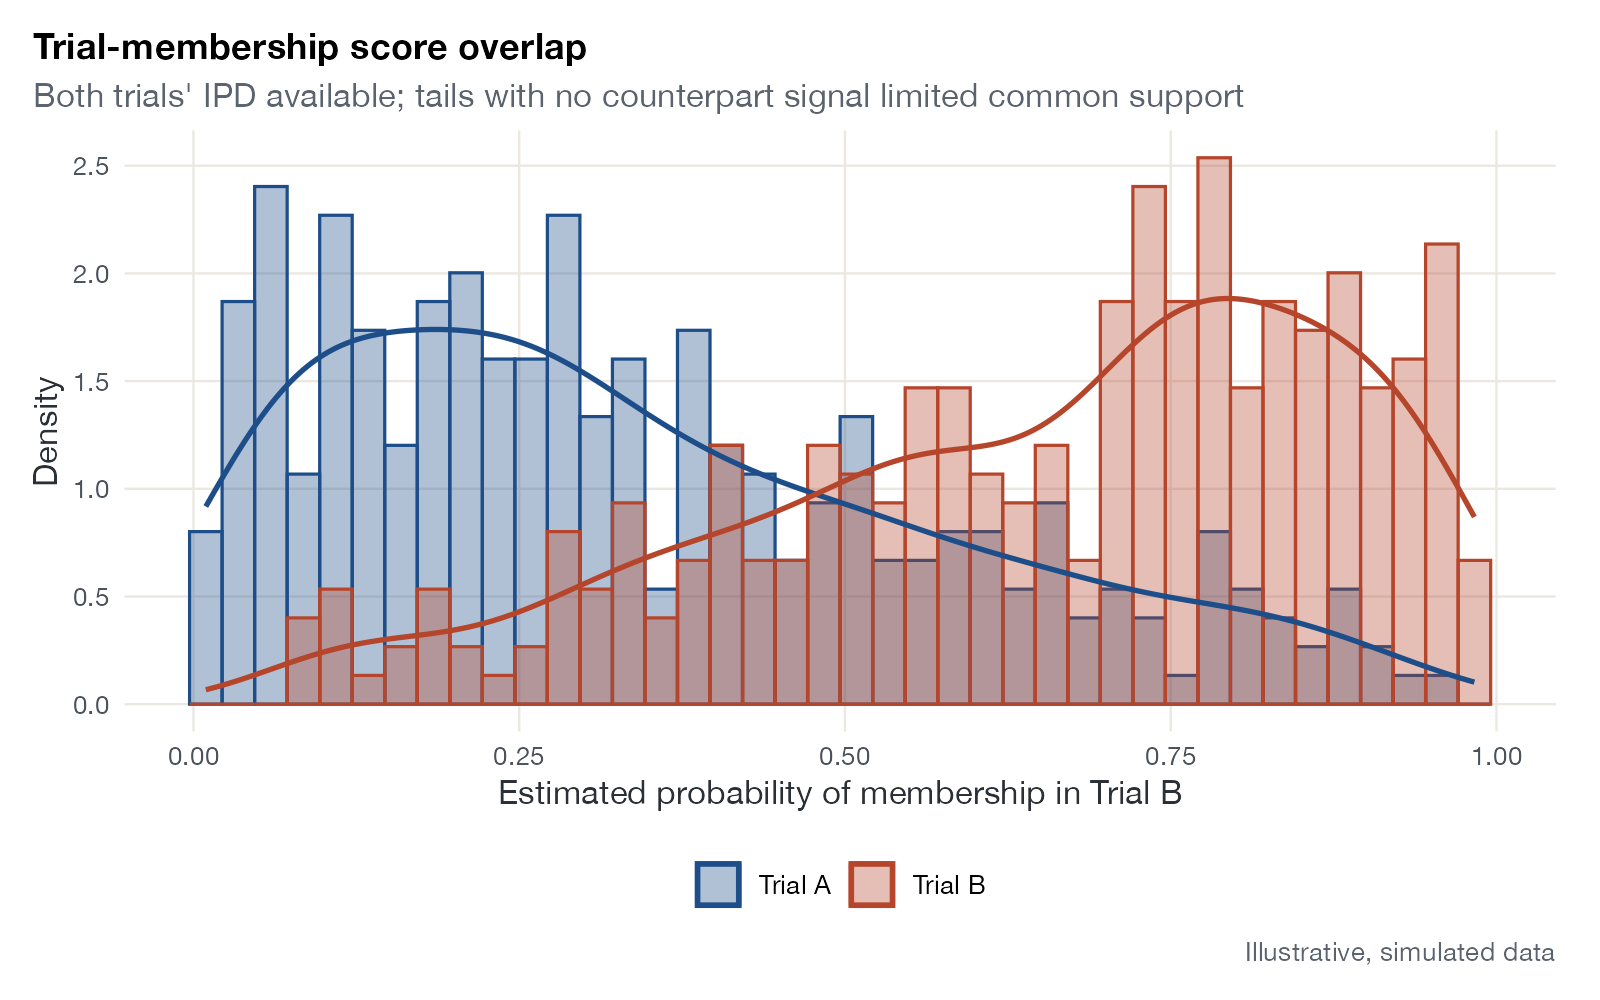
Estimated probability of membership in Trial B, from a logistic model on age, ECOG status, and number of prior therapies, for simulated IPD from two trials. Illustrative, simulated data.
Family
Weighting, balance, and overlap
Purpose
Check positivity (common support) between two populations when IPD from both are available.
Inputs
IPD from both populations (or a credible reconstruction).
Software
Custom
glm() and ggplot2 (shown); cobalt::bal.plot()
What it shows
When individual data are available from both populations, a model of trial membership, analogous to a propensity score, can be fitted and its fitted probabilities compared between trials. Overlapping distributions indicate common support. Regions where one trial has patients and the other has none are regions where any comparison must extrapolate.
How to read it
- Horizontal axis: estimated probability of being in the second trial given covariates.
- Histograms and densities: one per trial.
- Overlap: the range where both trials have patients.
- Tails near 0 or 1 with no counterpart: lack of common support.
Interpretation
The two trials overlap in the middle of the score range, but Trial A has many patients with probabilities below 0.1 and Trial B many above 0.9, where the other trial has few counterparts. A weighting method would give those patients extreme weights, and a regression method would extrapolate for them.
Pitfalls
- In the usual MAIC setting only aggregate data are available for the comparator, so this plot cannot be drawn from published moments alone. Calling the MAIC weighting score a propensity score blurs that distinction.
- A good overlap on modeled covariates says nothing about unmodeled ones.
- The membership model’s specification (interactions, nonlinearity) affects the scores.
Code
library(ggplot2)

# Simulated IPD from two trials whose populations only partly overlap
set.seed(11)
n <- 600
trial <- rep(c("Trial A", "Trial B"), each = n / 2)
age <- ifelse(trial == "Trial A", rnorm(n, 58, 9), rnorm(n, 50, 8))
ecog0 <- rbinom(n, 1, ifelse(trial == "Trial A", 0.40, 0.65))
prior <- rpois(n, ifelse(trial == "Trial A", 2.6, 1.6))

# Trial-membership model: probability of being in Trial B given covariates
fit <- glm(I(trial == "Trial B") ~ age + ecog0 + prior, family = binomial)
d <- data.frame(trial, ps = fitted(fit))

ggplot(d, aes(ps, fill = trial, colour = trial)) +
  geom_histogram(aes(y = after_stat(density)), bins = 40, position = "identity", alpha = 0.35) +
  geom_density(fill = NA, linewidth = 0.9) +
  scale_fill_manual(values = c("#1d4e89", "#b5452b"), name = NULL) +
  scale_colour_manual(values = c("#1d4e89", "#b5452b"), name = NULL) +
  labs(x = "Estimated probability of membership in Trial B", y = "Density",
       title = "Trial-membership score overlap",
       subtitle = "Both trials' IPD available; tails with no counterpart signal limited common support",
       caption = "Illustrative, simulated data")
References
- Signorovitch JE, Sikirica V, Erder MH, et al. Matching-adjusted indirect comparisons: a new tool for timely comparative effectiveness research. Value Health. 2012;15:940-947. doi:10.1016/j.jval.2012.05.004
- Stuart EA, Cole SR, Bradshaw CP, Leaf PJ. The use of propensity scores to assess the generalizability of results from randomized trials. J R Stat Soc Ser A. 2011;174:369-386. doi:10.1111/j.1467-985X.2010.00673.x