Path-based inconsistency heat plot
netpath heat plot
netmeta::Senn2013.
netmeta::netpath() and heatplot() (netmeta 3.7 and later)
What it shows
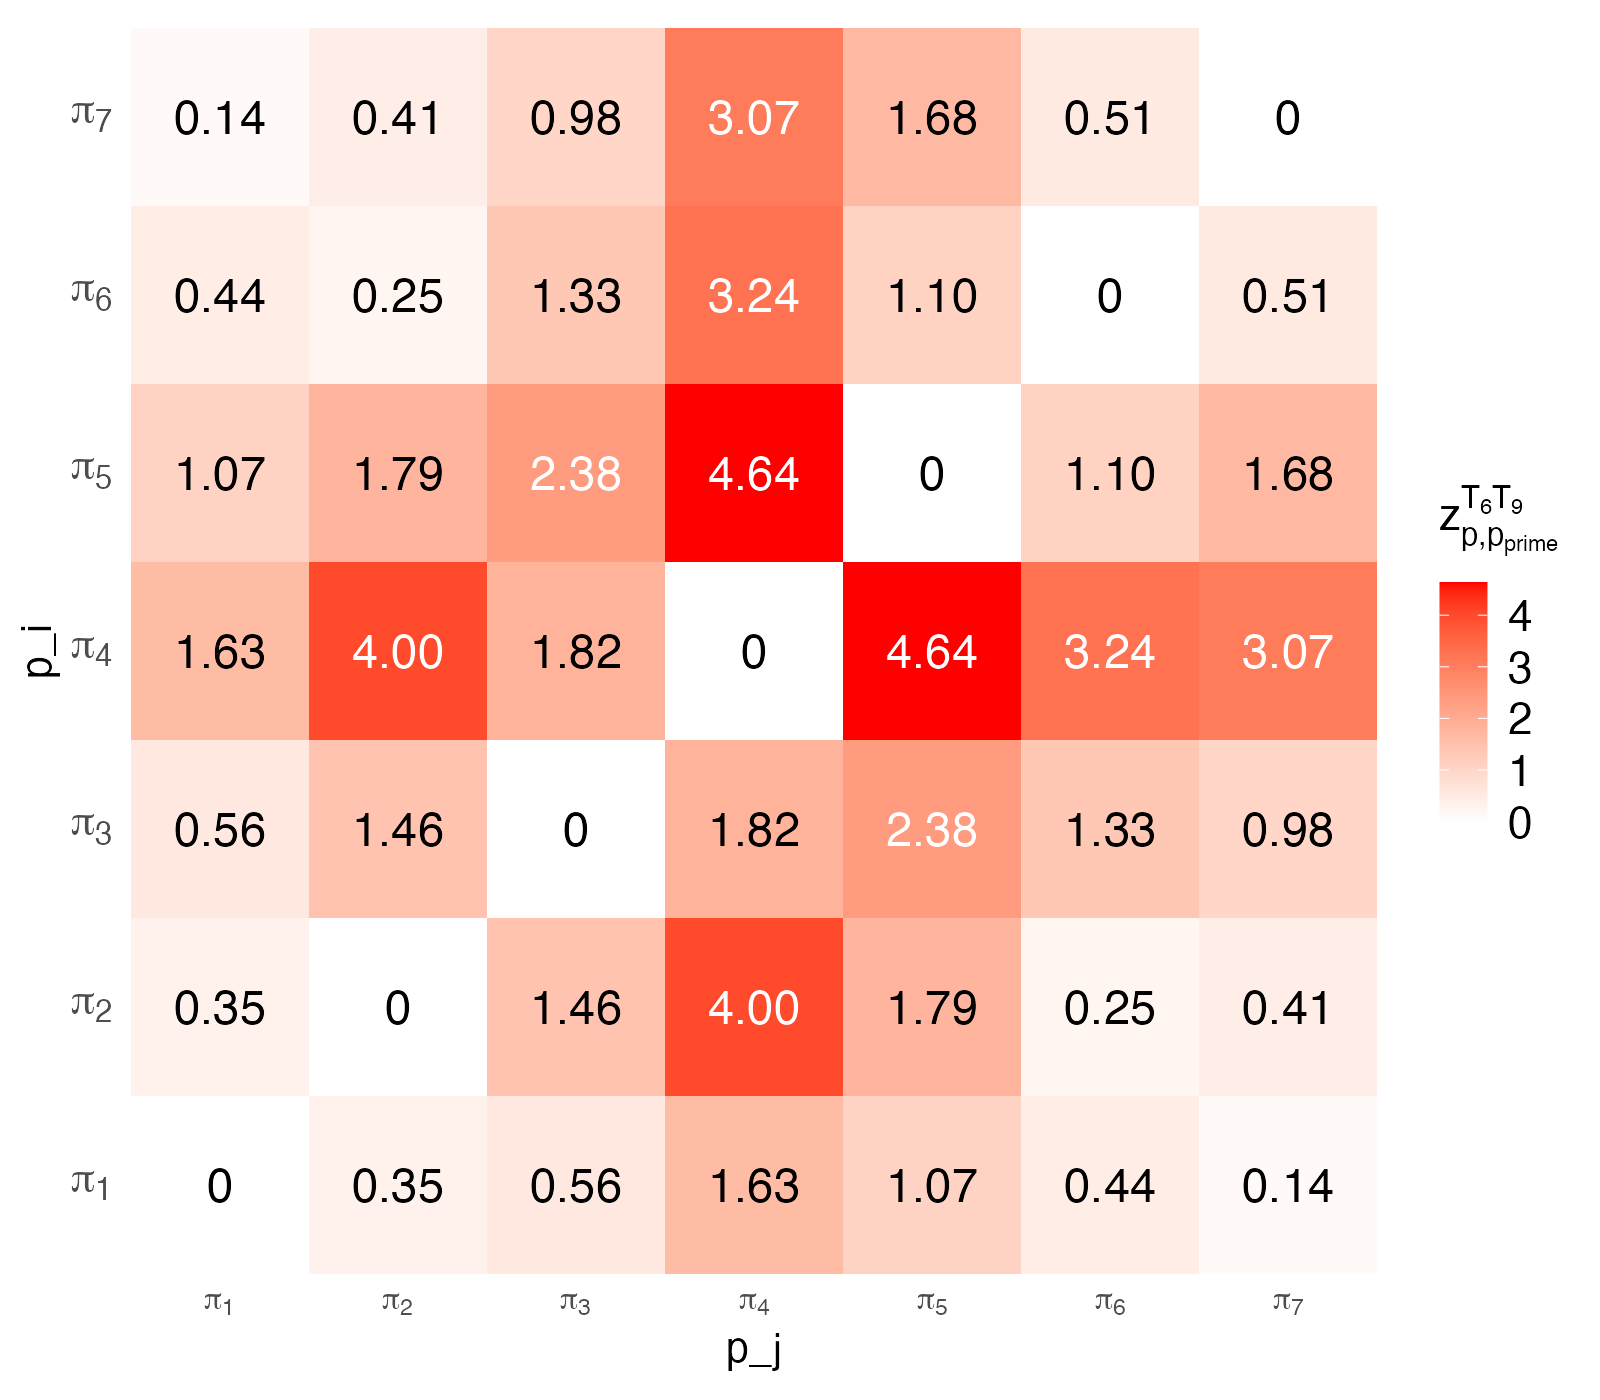
Between any two treatments a network offers several paths: the direct edge and chains of other comparisons. Tahmasebi and colleagues proposed estimating the comparison separately through each path and testing whether the path-specific estimates agree. The heat plot shows every pair of paths with the absolute standardized difference between their estimates, so that the disagreeing path stands out as a bright row and column.
How to read it
- Rows and columns: paths \(\pi_1, \ldots, \pi_k\) between the two treatments.
- Cells: absolute \(z\)-statistic for the difference between two path estimates.
- Color: darker red for larger differences.
- Global test: a \(Q\) statistic across all paths (printed by
netpath()).
Interpretation
For metformin versus placebo, seven paths are available and the global path-based test is significant (\(Q = 22.5\), df = 6, \(p = 0.001\)). Path \(\pi_4\) stands out, differing from \(\pi_2\) and \(\pi_5\) by more than four standard errors. Tracing it back through the printed path list identifies which chain of comparisons carries the discrepant evidence.
Pitfalls
- Paths share edges, so their estimates are correlated; the method accounts for this, but singular covariance matrices require pseudo-inverses, as here.
- The number of paths grows quickly with network size and computation can be slow.
- The method is new; experience with its operating characteristics is limited.
Code
library(netmeta)

data(Senn2013)

net <- netmeta(
  TE, seTE, treat1.long, treat2.long, studlab,
  data = Senn2013, sm = "MD",
  common = FALSE, reference.group = "Placebo"
)

# Path-based evidence for one comparison: estimates from every path between
# the two treatments, and a heat map of the differences between paths
np <- netpath(net, node1 = "Metformin", node2 = "Placebo")
heatplot(np)
References
- Tahmasebi N, et al. A path-based approach for detecting and assessing inconsistency in network meta-analysis. 2025. As implemented in netmeta 3.7-0. cran.r-project.org/package=netmeta