Predicted absolute outcomes by population
ML-NMR population-average predictions
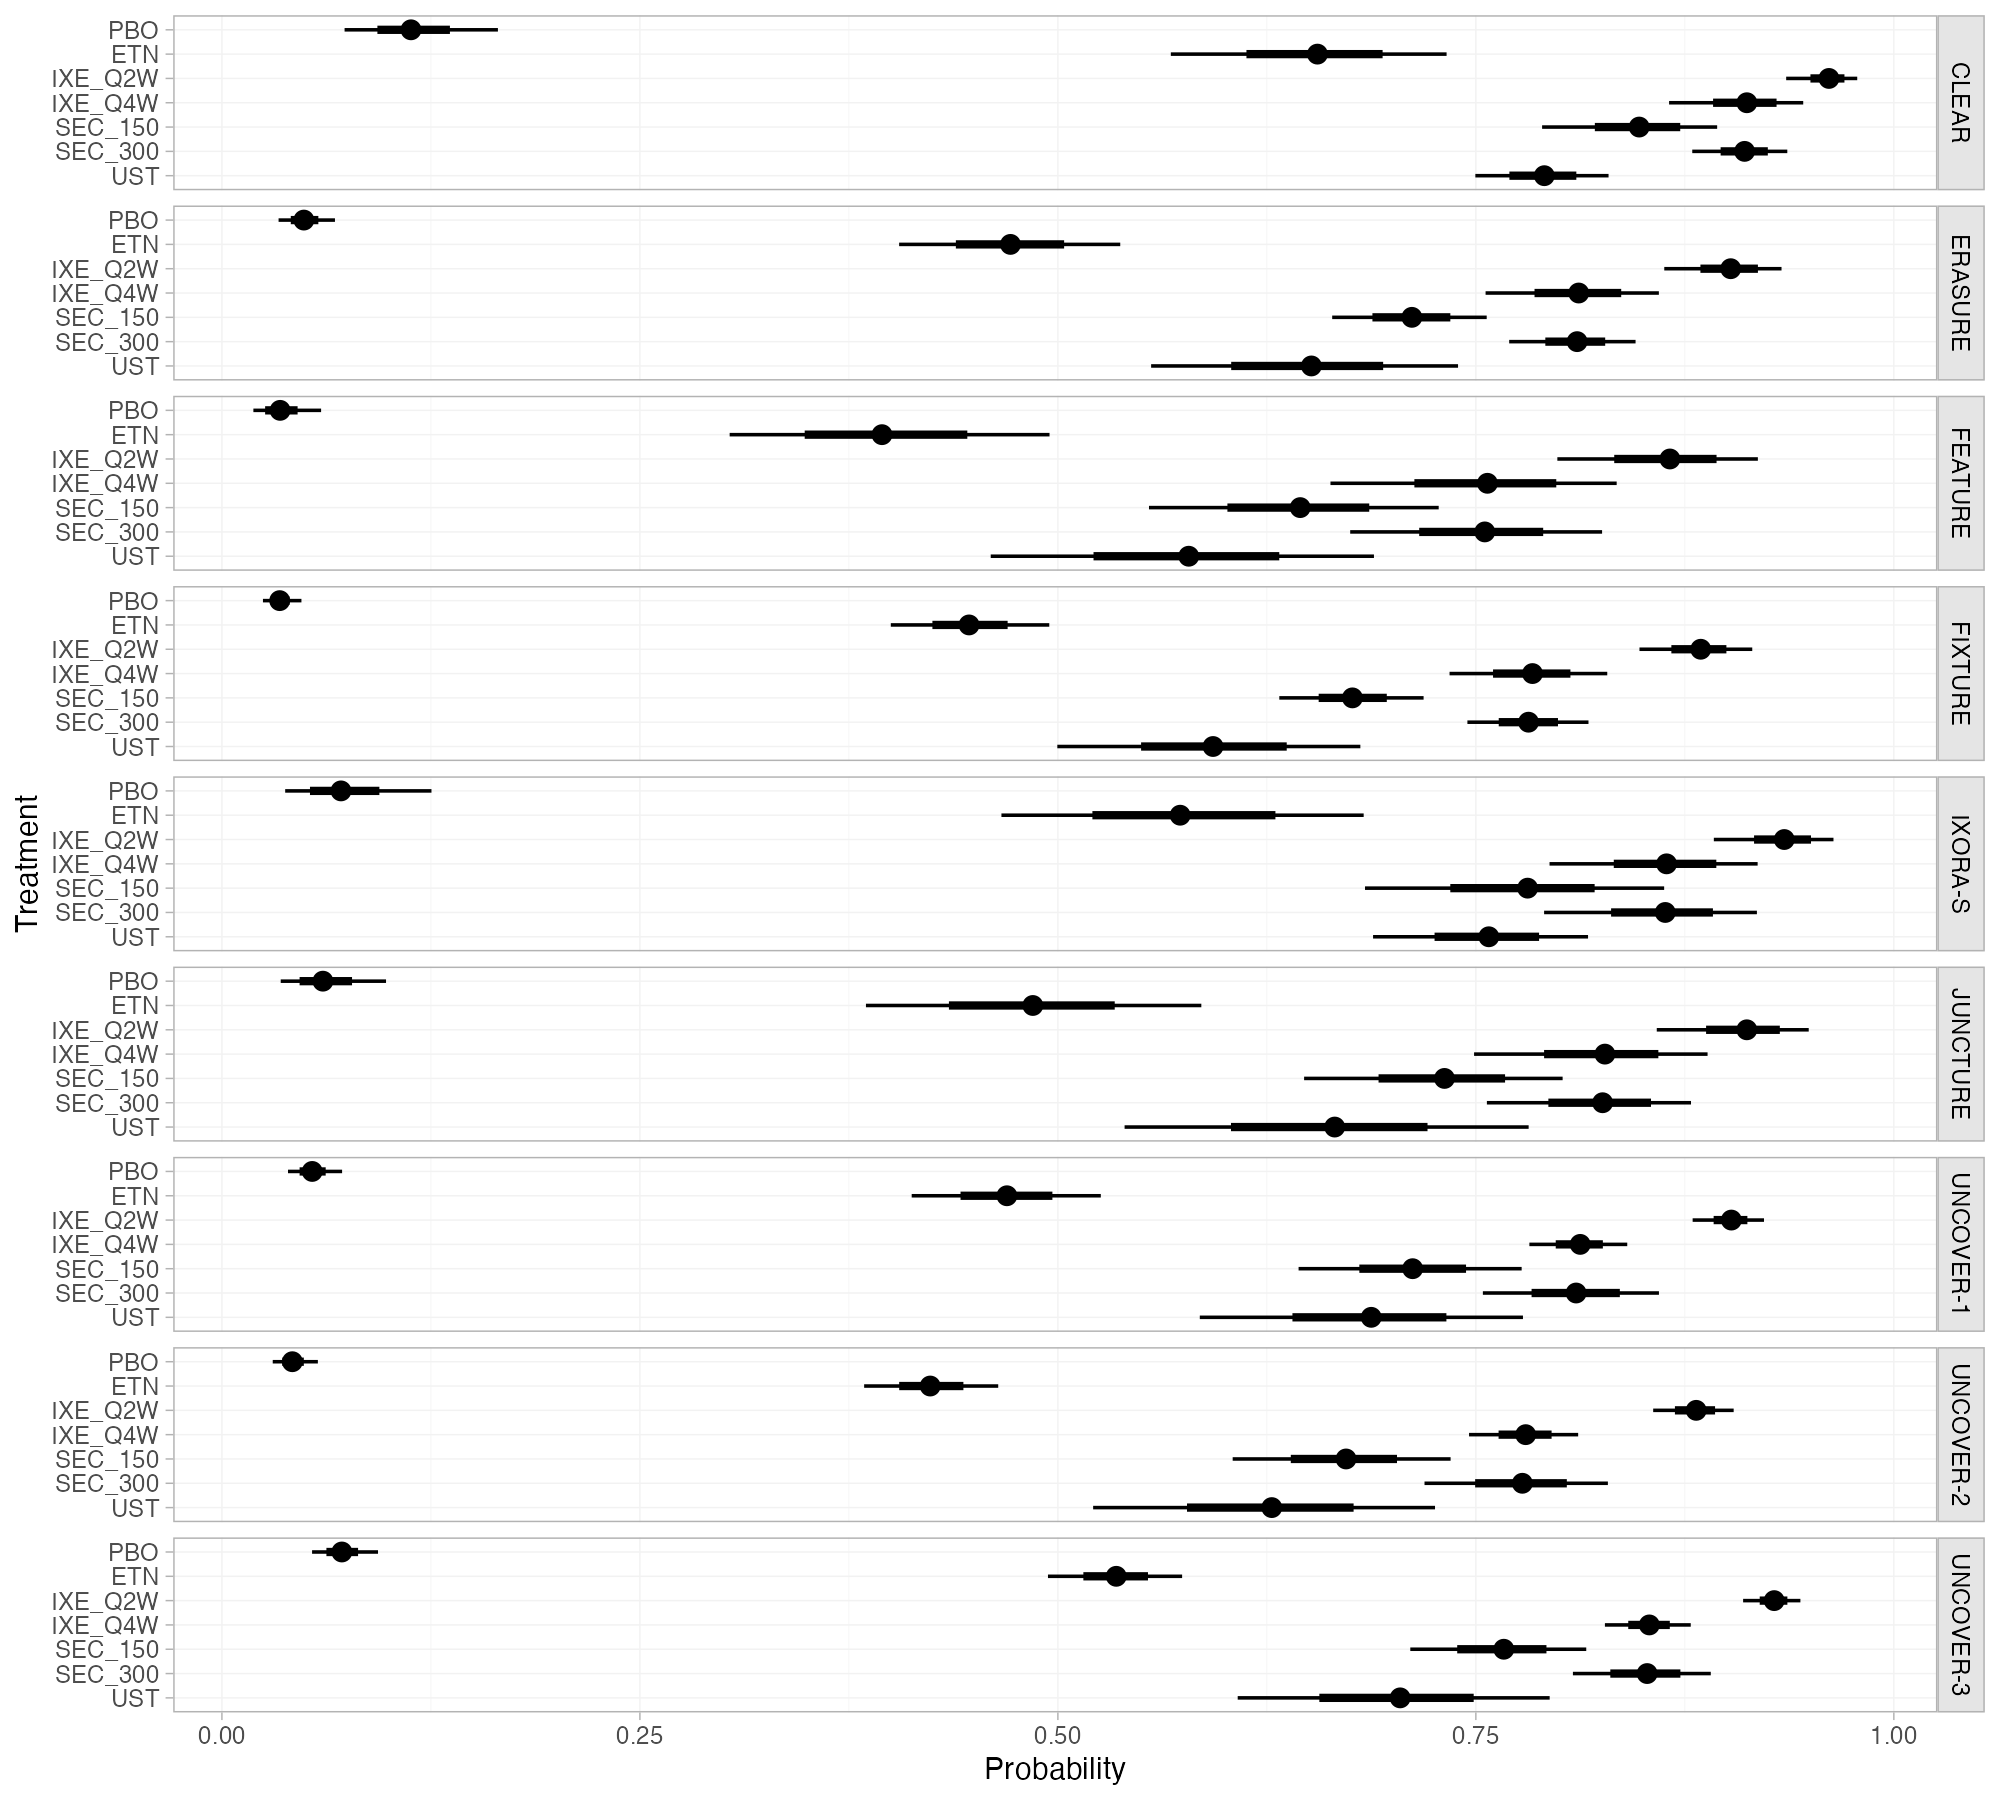
multinma plaque psoriasis example.
multinma::predict(type = "response") + plot()
What it shows
Cost-effectiveness models need absolute outcomes, not just relative effects. ML-NMR predicts the probability of the outcome on every treatment in each study population by combining the population’s baseline (the study’s own estimated intercept, or a supplied baseline distribution for an external target) with the population-adjusted relative effects. Including the reference treatment makes baseline differences between populations visible.
How to read it
- Panels: study populations.
- Rows: treatments, including the reference (placebo).
- Points and bars: posterior median with 66% and 95% credible intervals of the response probability.
Interpretation
Placebo response ranges from about 3% (FIXTURE) to 12% (CLEAR). On active treatment, ixekizumab Q2W reaches about 88% to 96% and etanercept 38% to 65%. Much of the between-population variation in absolute outcomes comes from baseline differences, which is why decision models should state the population whose baseline they use.
Pitfalls
- Absolute predictions depend on the baseline model; for an external target population, the baseline must come from appropriate data.
- Study-level intercepts reflect each trial’s design and setting, not only patient covariates.
Code
Shared model (R/models/plaque-psoriasis-mlnmr.R)
# ML-NMR of PASI 75 response in plaque psoriasis (Phillippo et al. 2020):
# IPD from 4 ixekizumab trials, aggregate data from 5 secukinumab trials.
library(multinma)
library(dplyr)

trt_class <- function(trtc) case_when(
  trtc == "PBO" ~ "Placebo",
  trtc %in% c("IXE_Q2W", "IXE_Q4W", "SEC_150", "SEC_300") ~ "IL-17 blocker",
  trtc == "ETN" ~ "TNFa blocker",
  trtc == "UST" ~ "IL-12/23 blocker"
)

# Rescale covariates: BSA as a proportion, weight in 10 kg, duration in decades
pso_ipd <- plaque_psoriasis_ipd |>
  mutate(bsa = bsa / 100, weight = weight / 10, durnpso = durnpso / 10,
         prevsys = as.numeric(prevsys), psa = as.numeric(psa),
         trtclass = trt_class(trtc)) |>
  filter(complete.cases(durnpso, prevsys, bsa, weight, psa, pasi75))
pso_agd <- plaque_psoriasis_agd |>
  mutate(bsa_mean = bsa_mean / 100, bsa_sd = bsa_sd / 100,
         weight_mean = weight_mean / 10, weight_sd = weight_sd / 10,
         durnpso_mean = durnpso_mean / 10, durnpso_sd = durnpso_sd / 10,
         prevsys = prevsys / 100, psa = psa / 100,
         trtclass = trt_class(trtc))

pso_net <- combine_network(
  set_ipd(pso_ipd, study = studyc, trt = trtc, r = pasi75, trt_class = trtclass),
  set_agd_arm(pso_agd, study = studyc, trt = trtc, r = pasi75_r, n = pasi75_n,
              trt_class = trtclass),
  trt_ref = "PBO"
)

# Quasi-Monte Carlo integration points over each aggregate study's covariates
pso_net <- add_integration(pso_net,
  durnpso = distr(qgamma, mean = durnpso_mean, sd = durnpso_sd),
  prevsys = distr(qbern, prob = prevsys),
  bsa = distr(qlogitnorm, mean = bsa_mean, sd = bsa_sd),
  weight = distr(qgamma, mean = weight_mean, sd = weight_sd),
  psa = distr(qbern, prob = psa),
  n_int = 64
)

# Fixed-effect ML-NMR, probit link, effect modifiers shared within treatment class
pso_fit <- nma(pso_net, trt_effects = "fixed", link = "probit", likelihood = "bernoulli2",
               regression = ~ (durnpso + prevsys + bsa + weight + psa) * .trt,
               class_interactions = "common",
               prior_intercept = normal(scale = 10), prior_trt = normal(scale = 10),
               prior_reg = normal(scale = 10), init_r = 0.1, QR = TRUE, seed = 2026,
               int_thin = 8, int_check = FALSE)  # save partial integrals for the error plot
Figure
library(multinma)
source("R/models/plaque-psoriasis-mlnmr.R")  # builds pso_net and fits pso_fit

# Population-average probability of PASI 75 response on each treatment,
# in each study population
plot(predict(pso_fit, type = "response"))
References
- Phillippo DM, Dias S, Ades AE, et al. Multilevel network meta-regression for population-adjusted treatment comparisons. J R Stat Soc Ser A. 2020;183:1189-1210. doi:10.1111/rssa.12579
- Dias S, Welton NJ, Sutton AJ, Ades AE. NICE DSU Technical Support Document 5: Evidence synthesis in the baseline natural history model. 2011. sheffield.ac.uk/nice-dsu