Contribution matrix
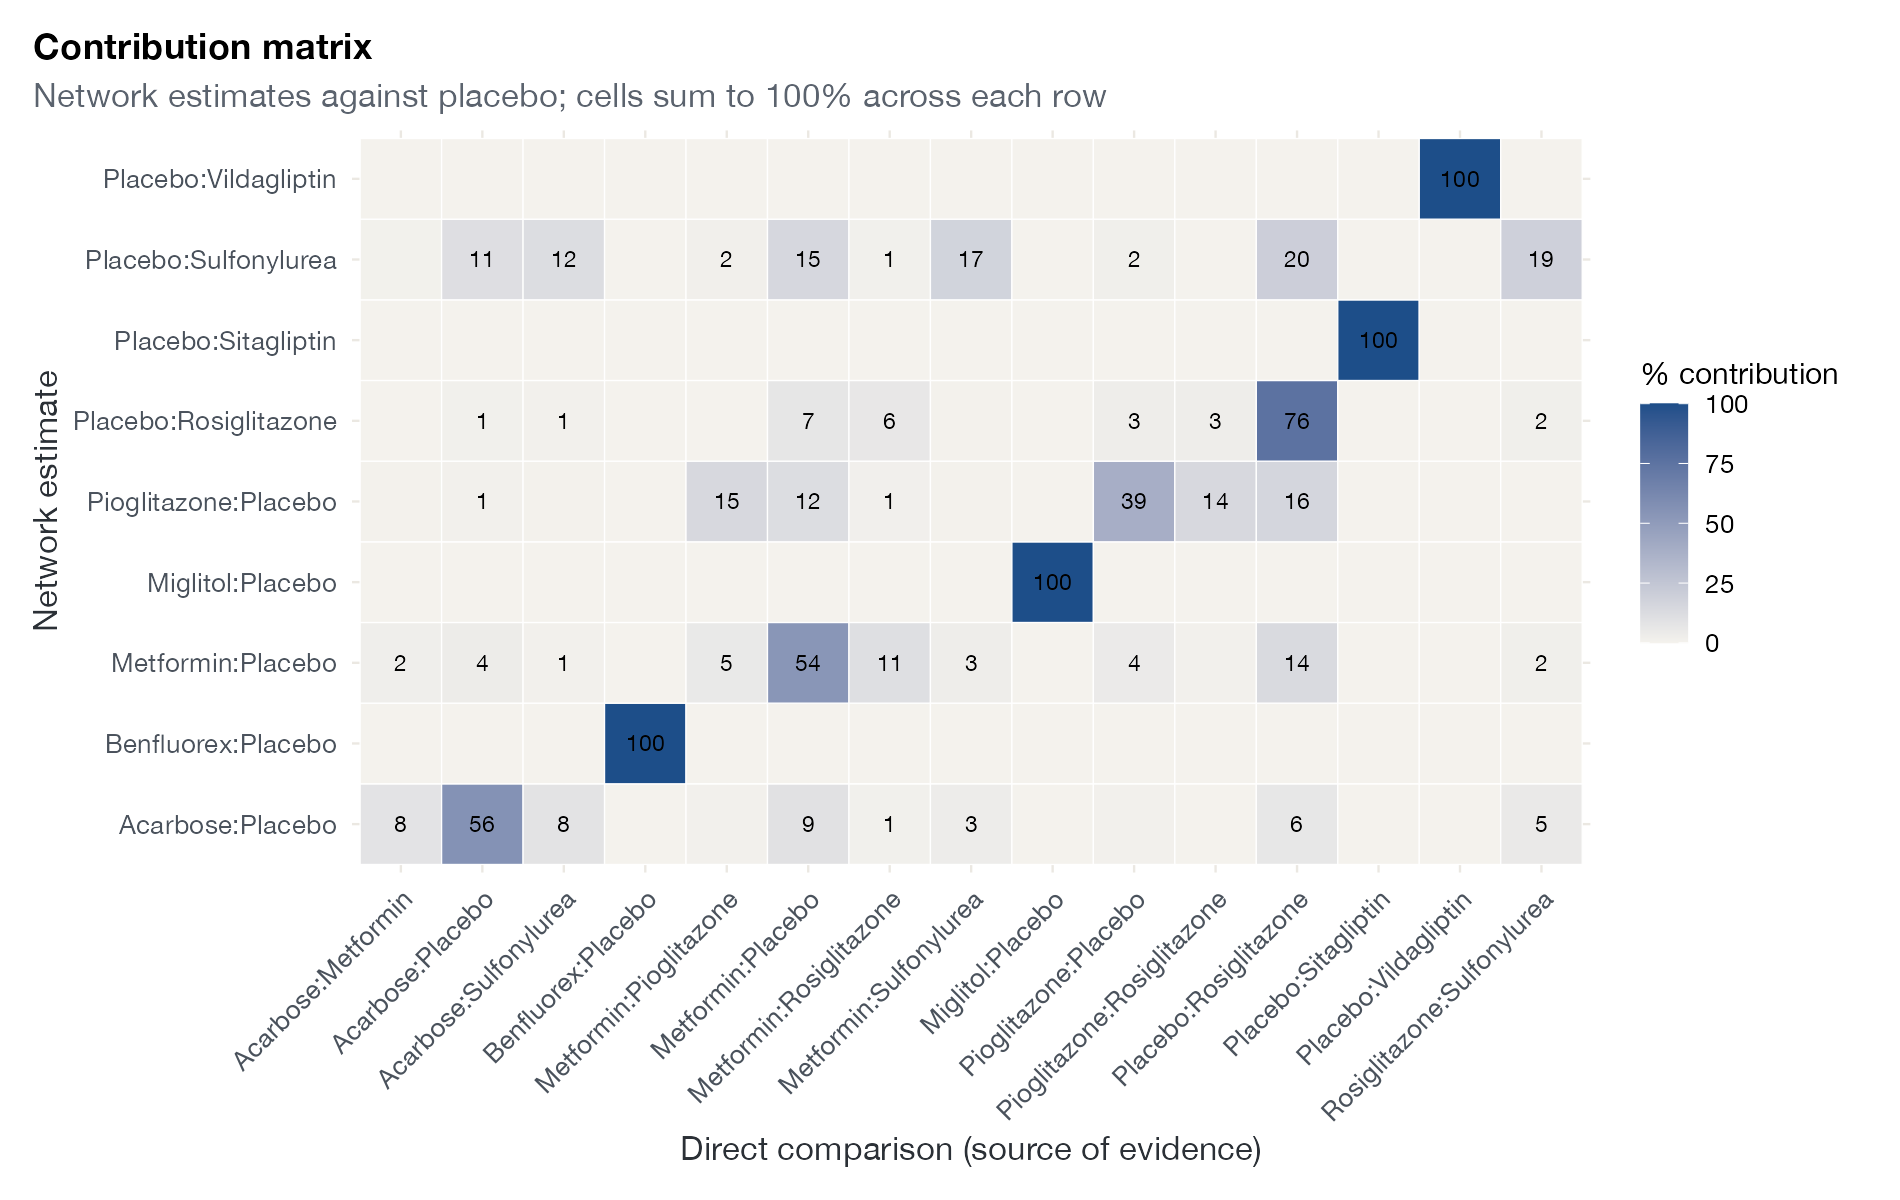
Percentage contribution heat map, study contribution matrix
netmeta::Senn2013.
netmeta::netcontrib(); CINeMA web application; Stata netweight
What it shows
Papakonstantinou and colleagues turned the evidence flow of every network estimate into percentage contributions. The contribution matrix has one row per network estimate and one column per direct comparison (or per study), with each row summing to 100%. It underpins CINeMA, which uses these percentages to carry risk of bias, indirectness, and other study-level judgments forward to the network estimates.
How to read it
- Rows: network estimates.
- Columns: direct comparisons, the sources of evidence.
- Cells: percentage contribution; darker is larger.
- A single dark cell in a row: that estimate rests almost entirely on its own direct evidence.
Interpretation
Benfluorex, miglitol, sitagliptin, and vildagliptin versus placebo each come entirely from their own trials, because nothing else in the network informs them. The estimates for acarbose, metformin, and pioglitazone draw on several direct comparisons. The sulfonylurea estimate has no direct placebo-controlled evidence at all and is spread over many comparisons, which in CINeMA would make its confidence depend on the quality of many trials.
Pitfalls
- Contributions are a decomposition of information, not probabilities that a study is correct.
- Different flow decompositions (shortest path, random walk, iterative) give different matrices.
- Study-level matrices can be large; aggregate by comparison for display.
Code
library(netmeta)
library(ggplot2)

data(Senn2013)

net <- netmeta(
  TE, seTE, treat1.long, treat2.long, studlab,
  data = Senn2013, sm = "MD",
  common = FALSE, reference.group = "Placebo"
)

# Percentage contribution of each direct comparison (columns) to each
# network estimate (rows), by the shortest-path flow decomposition
cm <- netcontrib(net)$random
d <- data.frame(
  estimate = rep(rownames(cm), times = ncol(cm)),
  direct = rep(colnames(cm), each = nrow(cm)),
  pct = 100 * as.vector(cm)
)
vs_placebo <- grepl("Placebo", d$estimate)
d <- d[vs_placebo, ]

ggplot(d, aes(direct, estimate, fill = pct)) +
  geom_tile(colour = "white") +
  geom_text(aes(label = ifelse(pct >= 1, round(pct), "")), size = 3) +
  scale_fill_gradient(low = "#f4f2ed", high = "#1d4e89", name = "% contribution") +
  labs(x = "Direct comparison (source of evidence)", y = "Network estimate",
       title = "Contribution matrix",
       subtitle = "Network estimates against placebo; cells sum to 100% across each row") +
  theme(axis.text.x = element_text(angle = 45, hjust = 1), panel.grid = element_blank(),
        legend.position = "right")
network meta consistency
netweight _y _stderr t1 t2References
- Papakonstantinou T, Nikolakopoulou A, Rücker G, et al. Estimating the contribution of studies in network meta-analysis: paths, flows and streams. F1000Research. 2018;7:610. doi:10.12688/f1000research.14770.3
- Nikolakopoulou A, Higgins JPT, Papakonstantinou T, et al. CINeMA: an approach for assessing confidence in the results of a network meta-analysis. PLoS Med. 2020;17:e1003082. doi:10.1371/journal.pmed.1003082