Subgroup forest plot
Stratified forest plot
metadat::dat.bcg.
meta::forest() with subgroup, metafor::rma(mods = ~ factor); Stata meta forestplot, subgroup()
What it shows
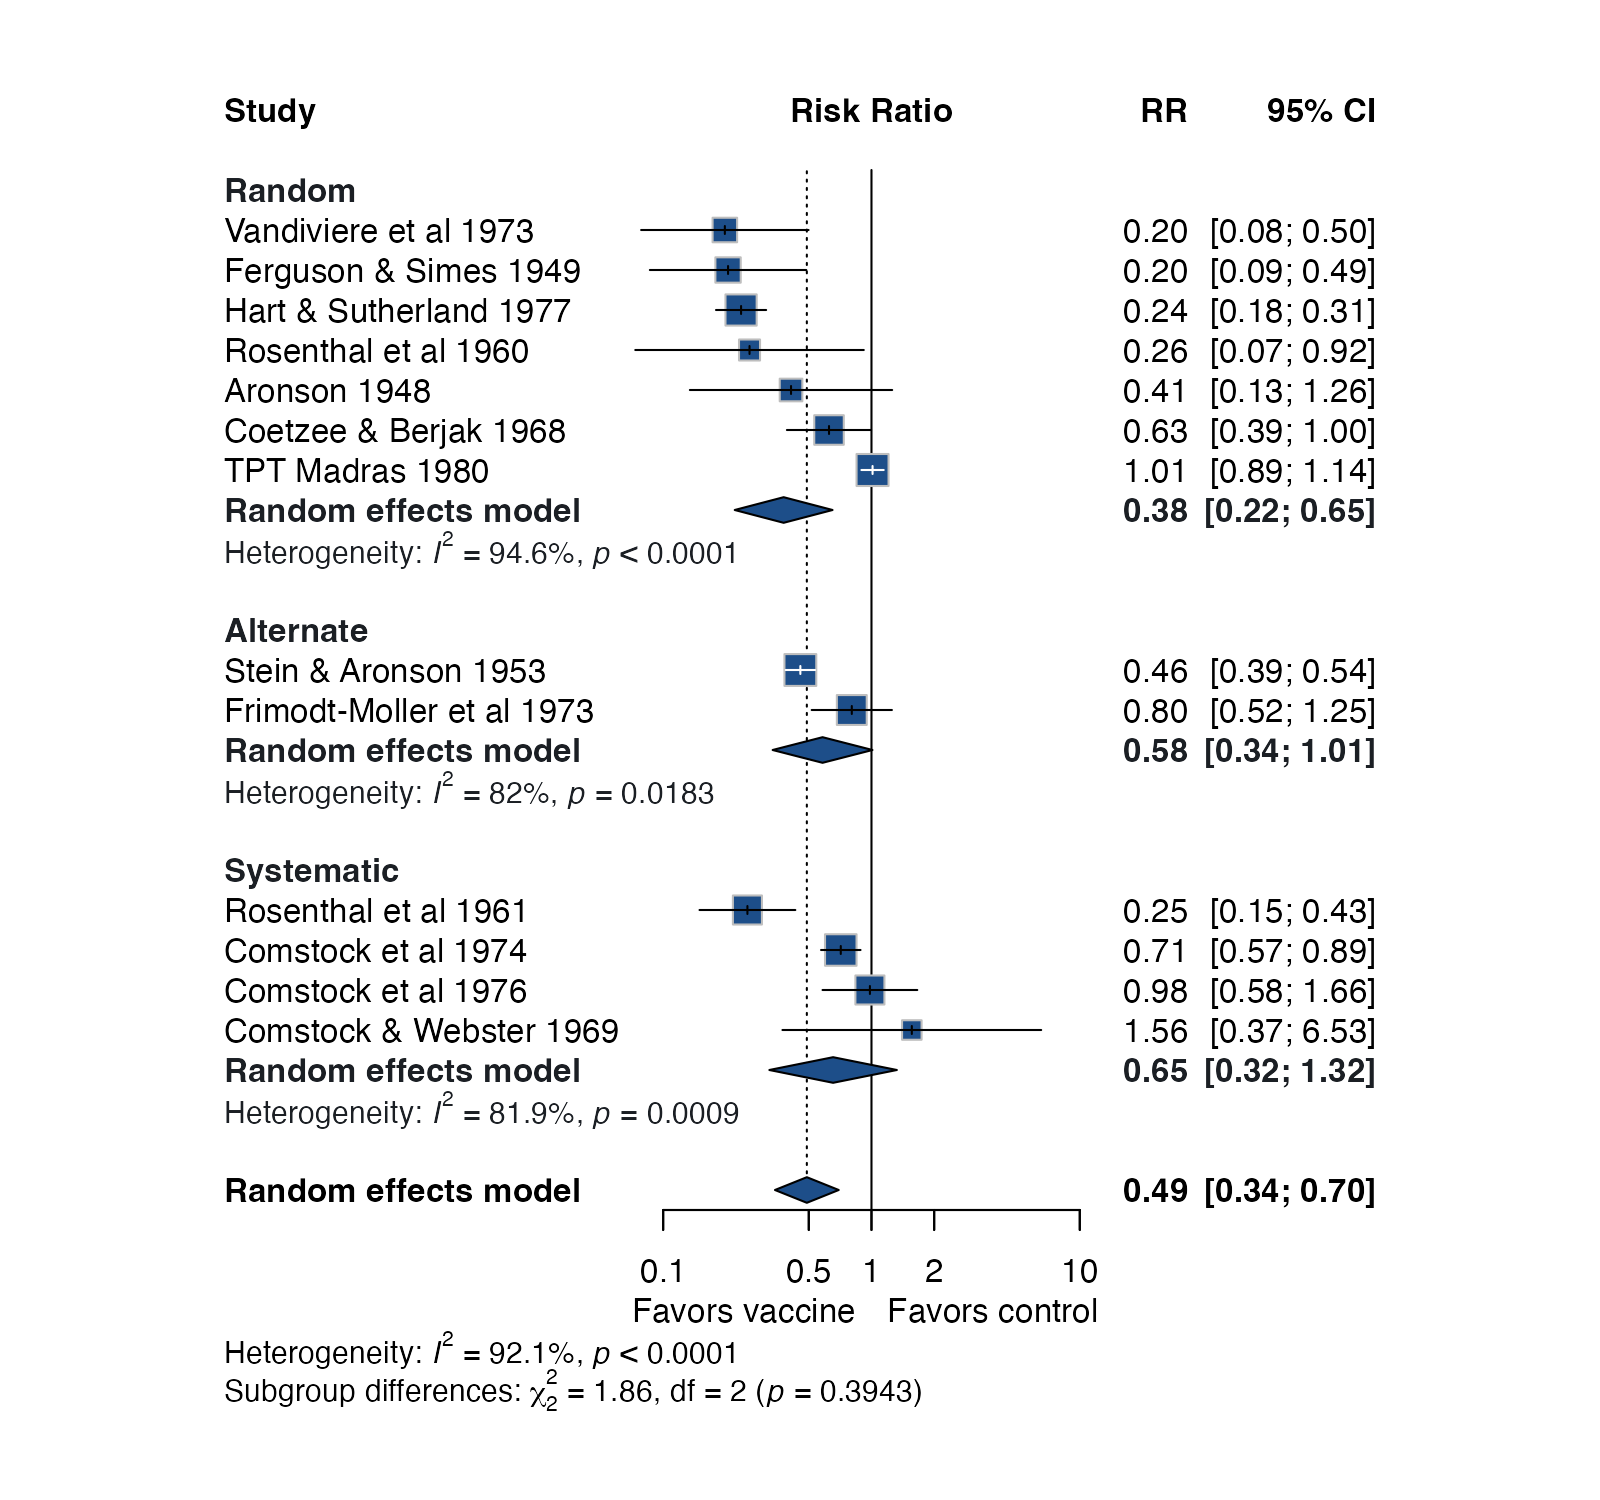
The subgroup forest plot has the same geometry as the forest plot, but studies are grouped by a categorical moderator, such as design feature, region, dose, or population. Each group gets its own pooled diamond and heterogeneity statistics, and a test for subgroup differences compares the group estimates. It is the standard first look at effect modification and appears in NMA, NMI, and ML-NMR work whenever results are reported for several populations.
How to read it
- Group headers: the level of the moderator.
- Squares and whiskers: study estimates and 95% confidence intervals, as in a standard forest plot.
- Diamond per group: the pooled estimate within that subgroup.
- Final diamond: the overall pooled estimate, ignoring grouping.
- Test for subgroup differences: a \(\chi^2\) test (Q between) of whether the subgroup means differ more than expected by chance.
Interpretation
Randomized trials give a pooled risk ratio of 0.38, alternately allocated trials 0.58, and systematically allocated trials 0.65. The test for subgroup differences is not significant (\(p = 0.39\)), and heterogeneity remains high within every subgroup, so allocation method does not explain the variation in BCG efficacy. The inference that matters is the comparison between groups, not whether each group’s diamond crosses 1.
Pitfalls
- Comparing subgroup p-values (“significant in A, not in B”) is not a test of interaction.
- Subgroups defined by study-level characteristics give observational, between-study comparisons, even when every trial is randomized. They are prone to confounding and ecological bias.
- Many subgroup analyses guarantee some spurious findings. Pre-specify moderators and report all that were examined.
- Small subgroups have unstable \(\tau^2\) estimates; consider a common \(\tau^2\) across subgroups.
Code
library(meta)

data(dat.bcg, package = "metadat")
dat.bcg$alloc <- tools::toTitleCase(dat.bcg$alloc)

m <- metabin(
  event.e = tpos, n.e = tpos + tneg,
  event.c = cpos, n.c = cpos + cneg,
  studlab = paste(author, year),
  data = dat.bcg, sm = "RR",
  common = FALSE, random = TRUE, method.tau = "REML",
  subgroup = alloc, subgroup.name = "Allocation",
  print.subgroup.name = FALSE
)

forest(
  m,
  sortvar = TE,
  leftcols = c("studlab"), leftlabs = c("Study"),
  rightcols = c("effect", "ci"),
  label.left = "Favors vaccine", label.right = "Favors control",
  col.square = "#1d4e89", col.diamond = "#1d4e89",
  col.by = "#1b1f24",
  test.subgroup = TRUE, print.tau2 = FALSE,
  label.test.subgroup.random = "Subgroup differences: ",
  addrows.below.overall = 3,
  prediction = FALSE
)
meta esize tpos tneg cpos cneg, esize(lnrratio) random(reml)
meta forestplot, eform subgroup(alloc)References
- Borenstein M, Higgins JPT. Meta-analysis and subgroups. Prev Sci. 2013;14:134-143. doi:10.1007/s11121-013-0377-7
- Sun X, Briel M, Walter SD, Guyatt GH. Is a subgroup effect believable? Updating criteria to evaluate the credibility of subgroup analyses. BMJ. 2010;340:c117. doi:10.1136/bmj.c117
- Dias S, Sutton AJ, Welton NJ, Ades AE. NICE DSU Technical Support Document 3: Heterogeneity: subgroups, meta-regression, bias and bias-adjustment. 2011. PDF