Comparison-adjusted funnel plot
Network funnel plot
netmeta::Senn2013.
netmeta::funnel(); Stata netfunnel
What it shows
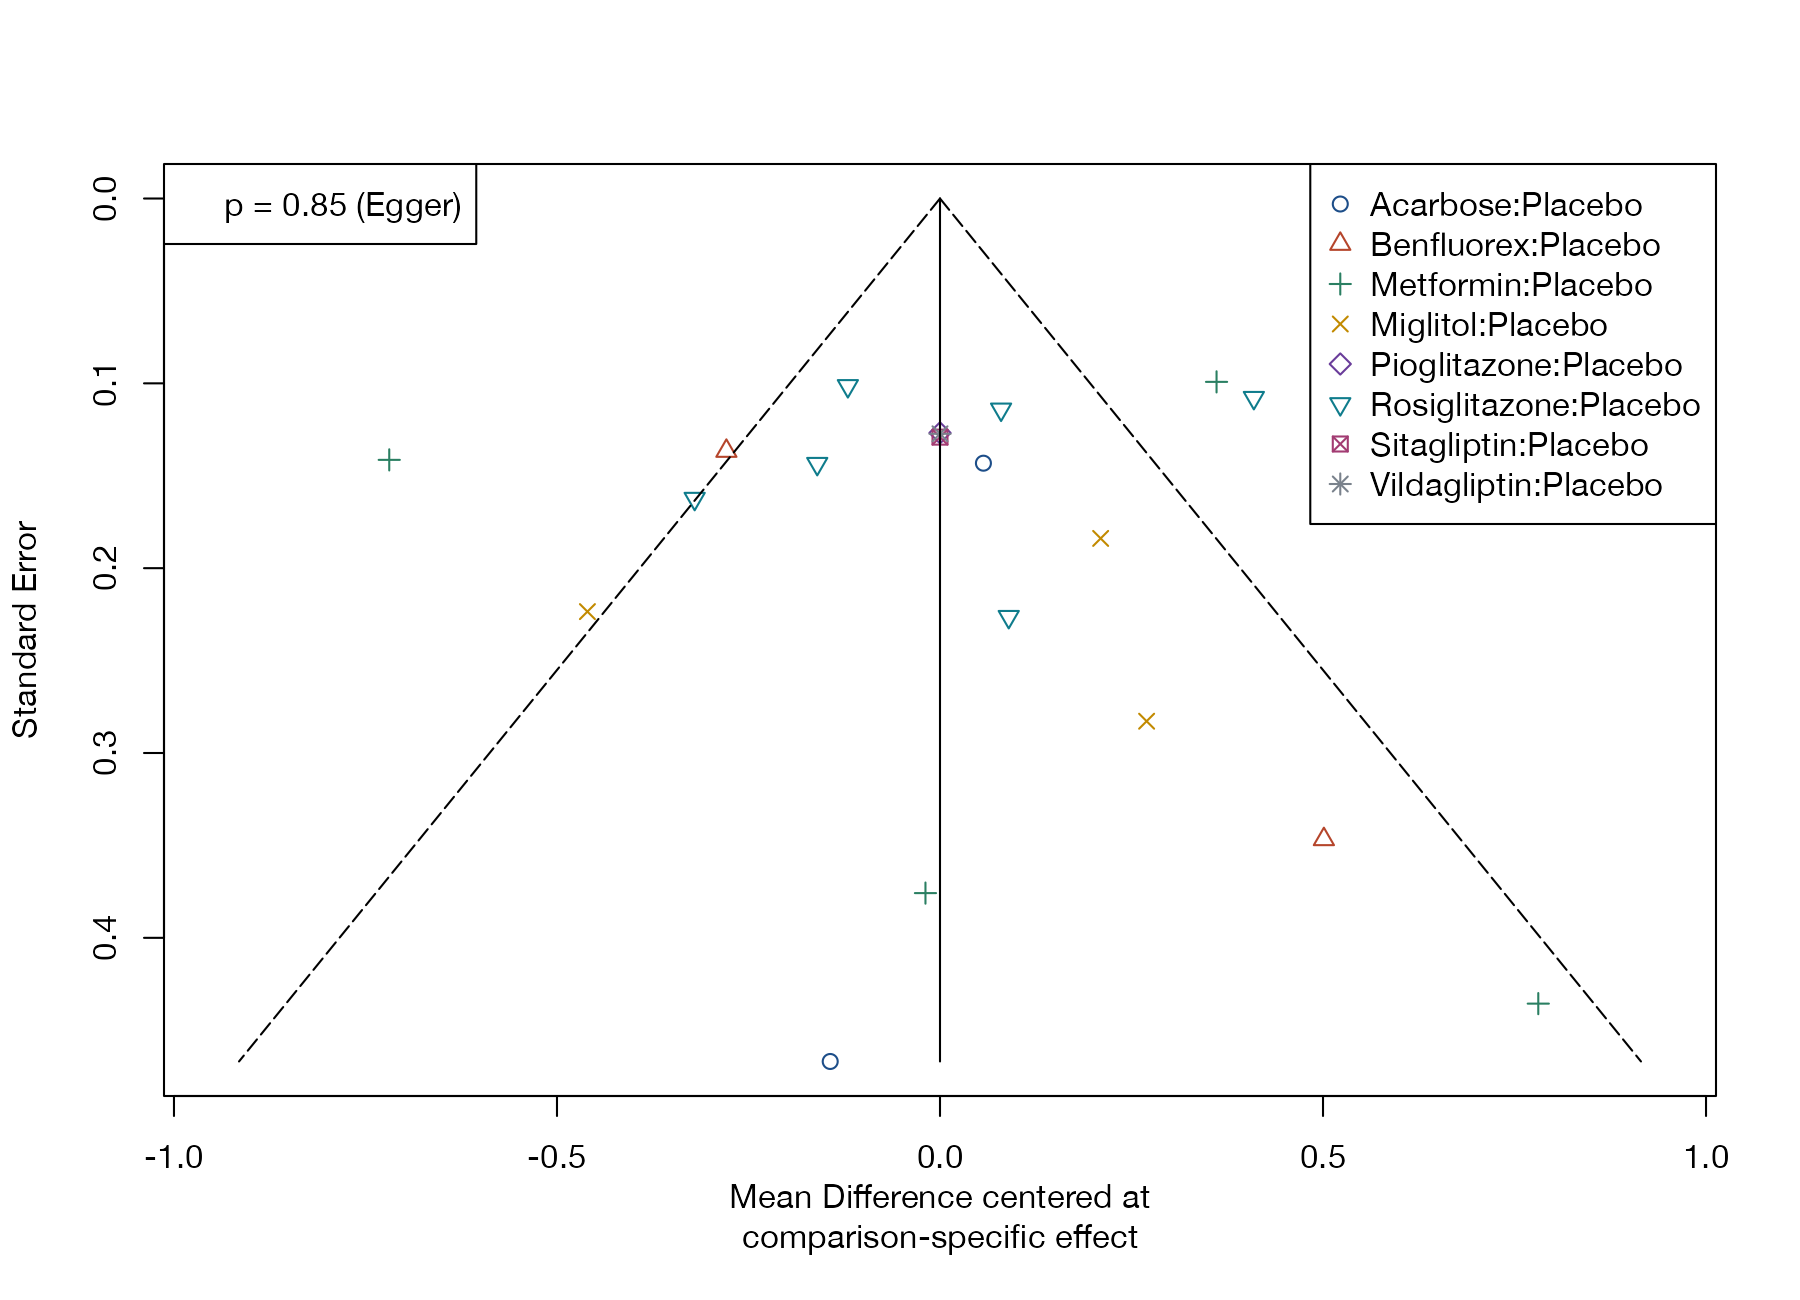
In a network, studies compare different pairs of treatments, so their raw effects cannot share one funnel. Chaimani and Salanti’s comparison-adjusted funnel plot subtracts from each study estimate the summary effect of its own comparison, so that the horizontal axis becomes the deviation from the comparison-specific mean. Under no small-study effects the points scatter symmetrically around zero. For the plot to be meaningful, all comparisons must be oriented consistently, for example “newer versus older” or “active versus placebo”, because asymmetry is only interpretable relative to a direction in which bias is expected.
How to read it
- Horizontal axis: study estimate minus the network estimate for that comparison.
- Vertical axis: standard error, reversed.
- Symbols and colors: direct comparisons.
- Triangle: pseudo-confidence limits around zero.
- Test label: a regression test for asymmetry applied to the adjusted values.
Interpretation
Placebo-controlled trials scatter roughly symmetrically around zero, and Egger’s test gives \(p = 0.85\). There is no visual or statistical sign that small placebo-controlled trials in this network report larger HbA1c reductions.
Pitfalls
- The result depends on the ordering of treatments. Choose it before looking and justify it clinically.
- Comparisons with few studies contribute little; the plot is dominated by the most studied comparisons.
- Asymmetry has the same alternative explanations as in a pairwise funnel plot.
Code
library(netmeta)

data(Senn2013)

net <- netmeta(
  TE, seTE, treat1.long, treat2.long, studlab,
  data = Senn2013, sm = "MD",
  common = FALSE, reference.group = "Placebo"
)

# Comparison-adjusted funnel: each study centered on the network estimate of
# its own comparison, with all comparisons oriented active versus placebo
funnel(net, order = "Placebo", pooled = "random",
       col = c("#1d4e89", "#b5452b", "#2a7f62", "#c28a00", "#6a3d9a",
               "#0f7c8c", "#a23b72", "#7a828c"),
       legend = TRUE, pos.legend = "topright",
       method.bias = "Egger", digits.pval = 2)
network meta consistency
netfunnel _y _stderr t1 t2, bycomparisonReferences
- Chaimani A, Salanti G. Using network meta-analysis to evaluate the existence of small-study effects in a network of interventions. Res Synth Methods. 2012;3:161-176. doi:10.1002/jrsm.57
- Chaimani A, Higgins JPT, Mavridis D, Spyridonos P, Salanti G. Graphical tools for network meta-analysis in STATA. PLoS One. 2013;8:e76654. doi:10.1371/journal.pone.0076654