Pairwise meta-analysis
Plots for aggregate-data and IPD pairwise meta-analysis
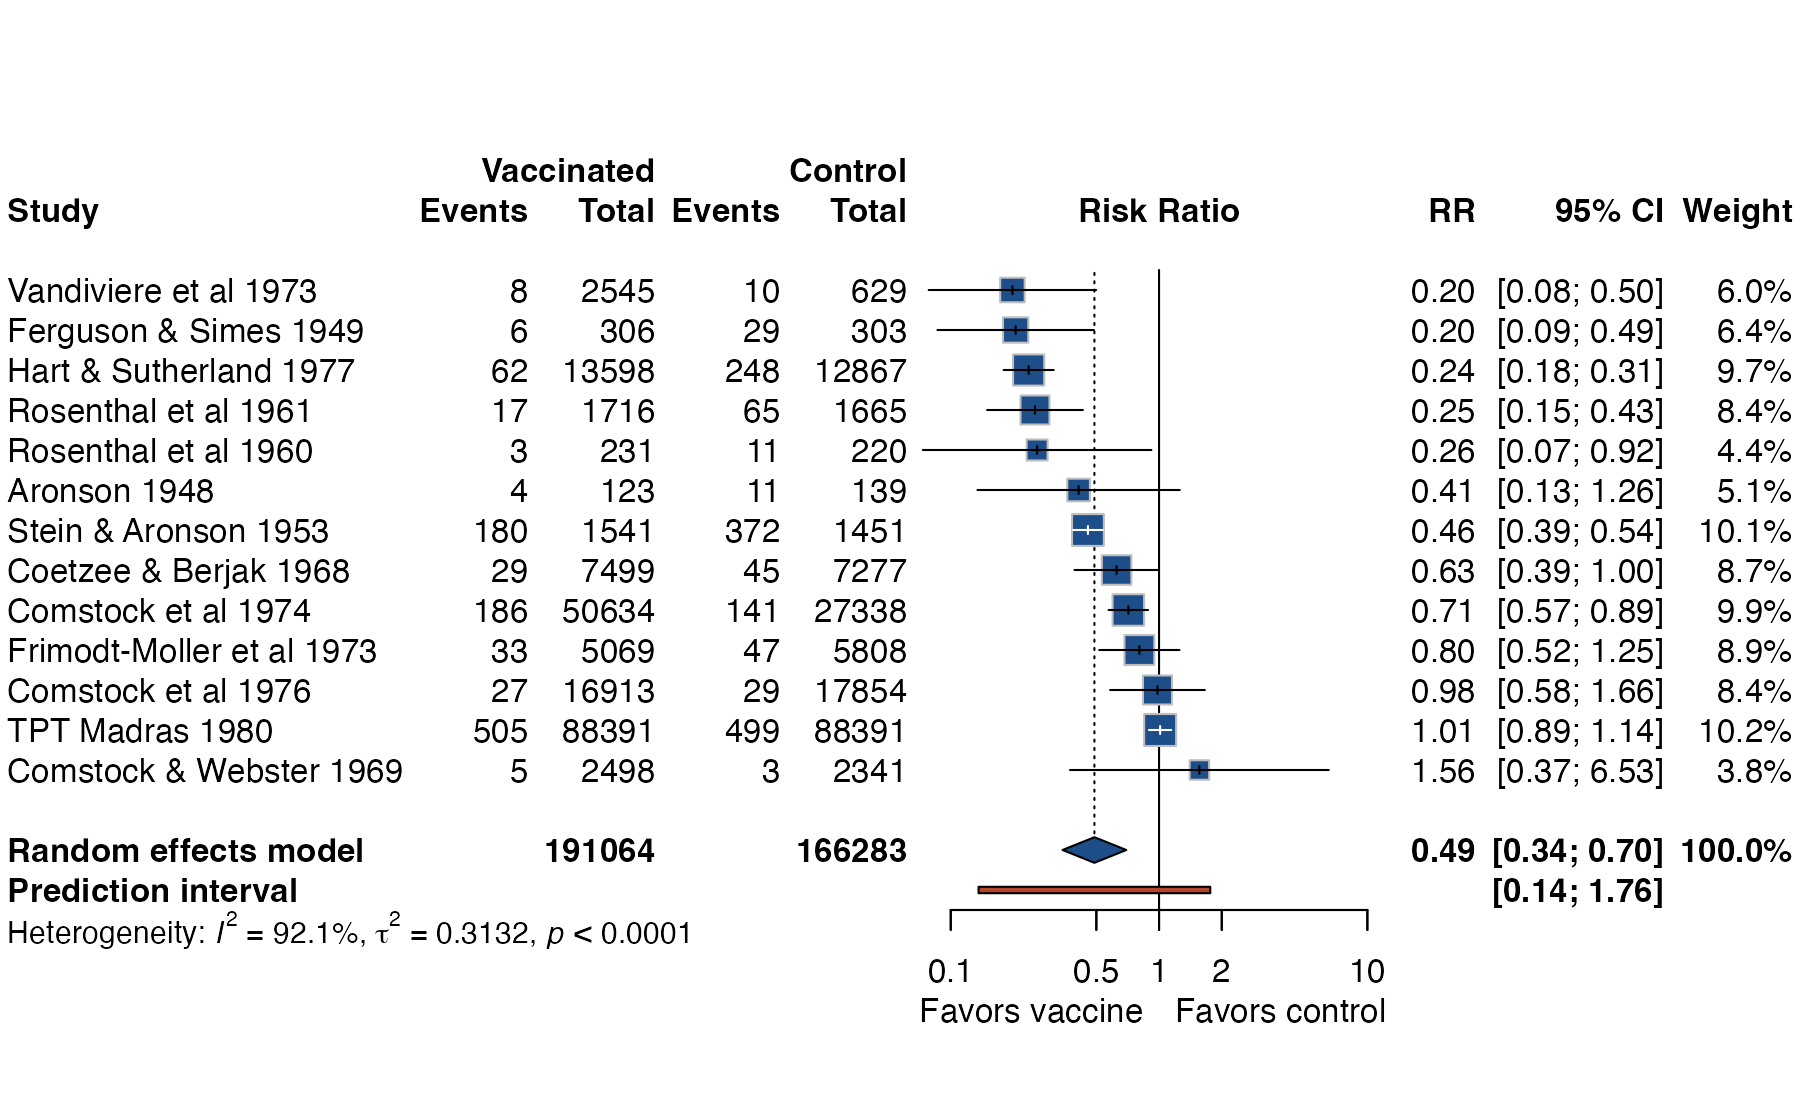
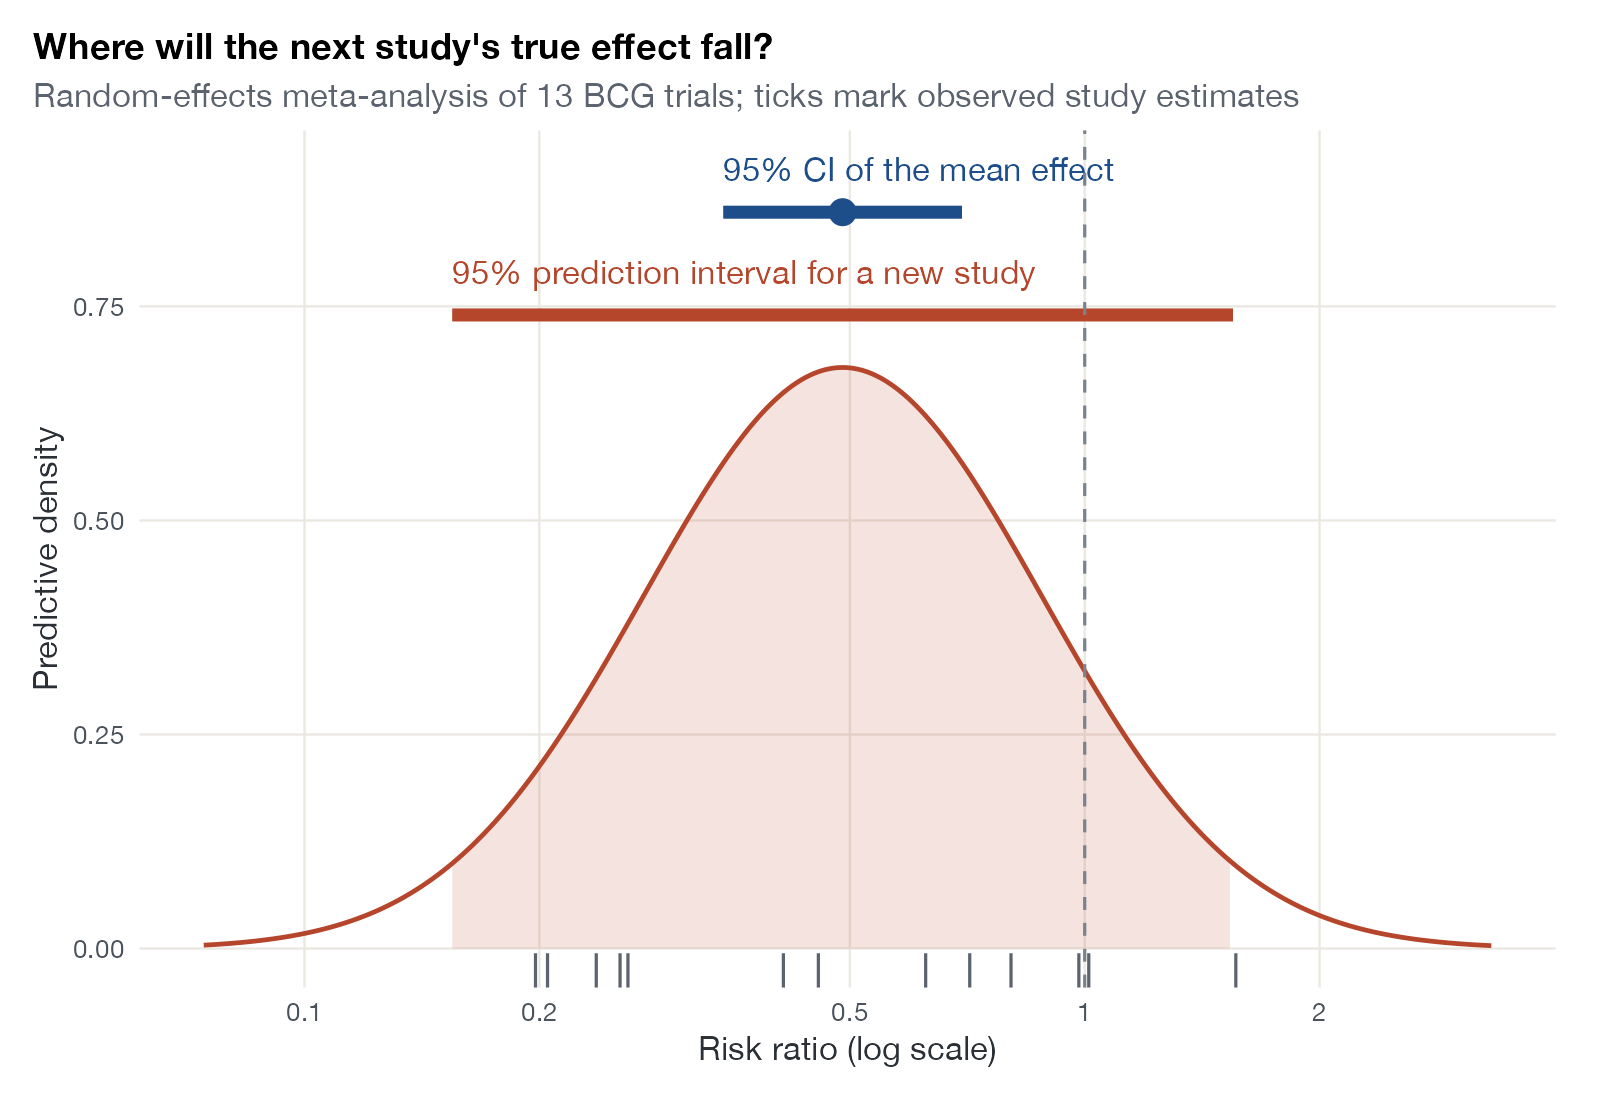
Pairwise meta-analysis combines randomized comparisons of the same two treatments. Its graphics answer four questions: what the effects are, how much they vary, which studies drive the result, and whether small studies behave differently from large ones. A result plot should always be paired with a plot of the assumption or data structure that makes it credible.
Minimum graphical set
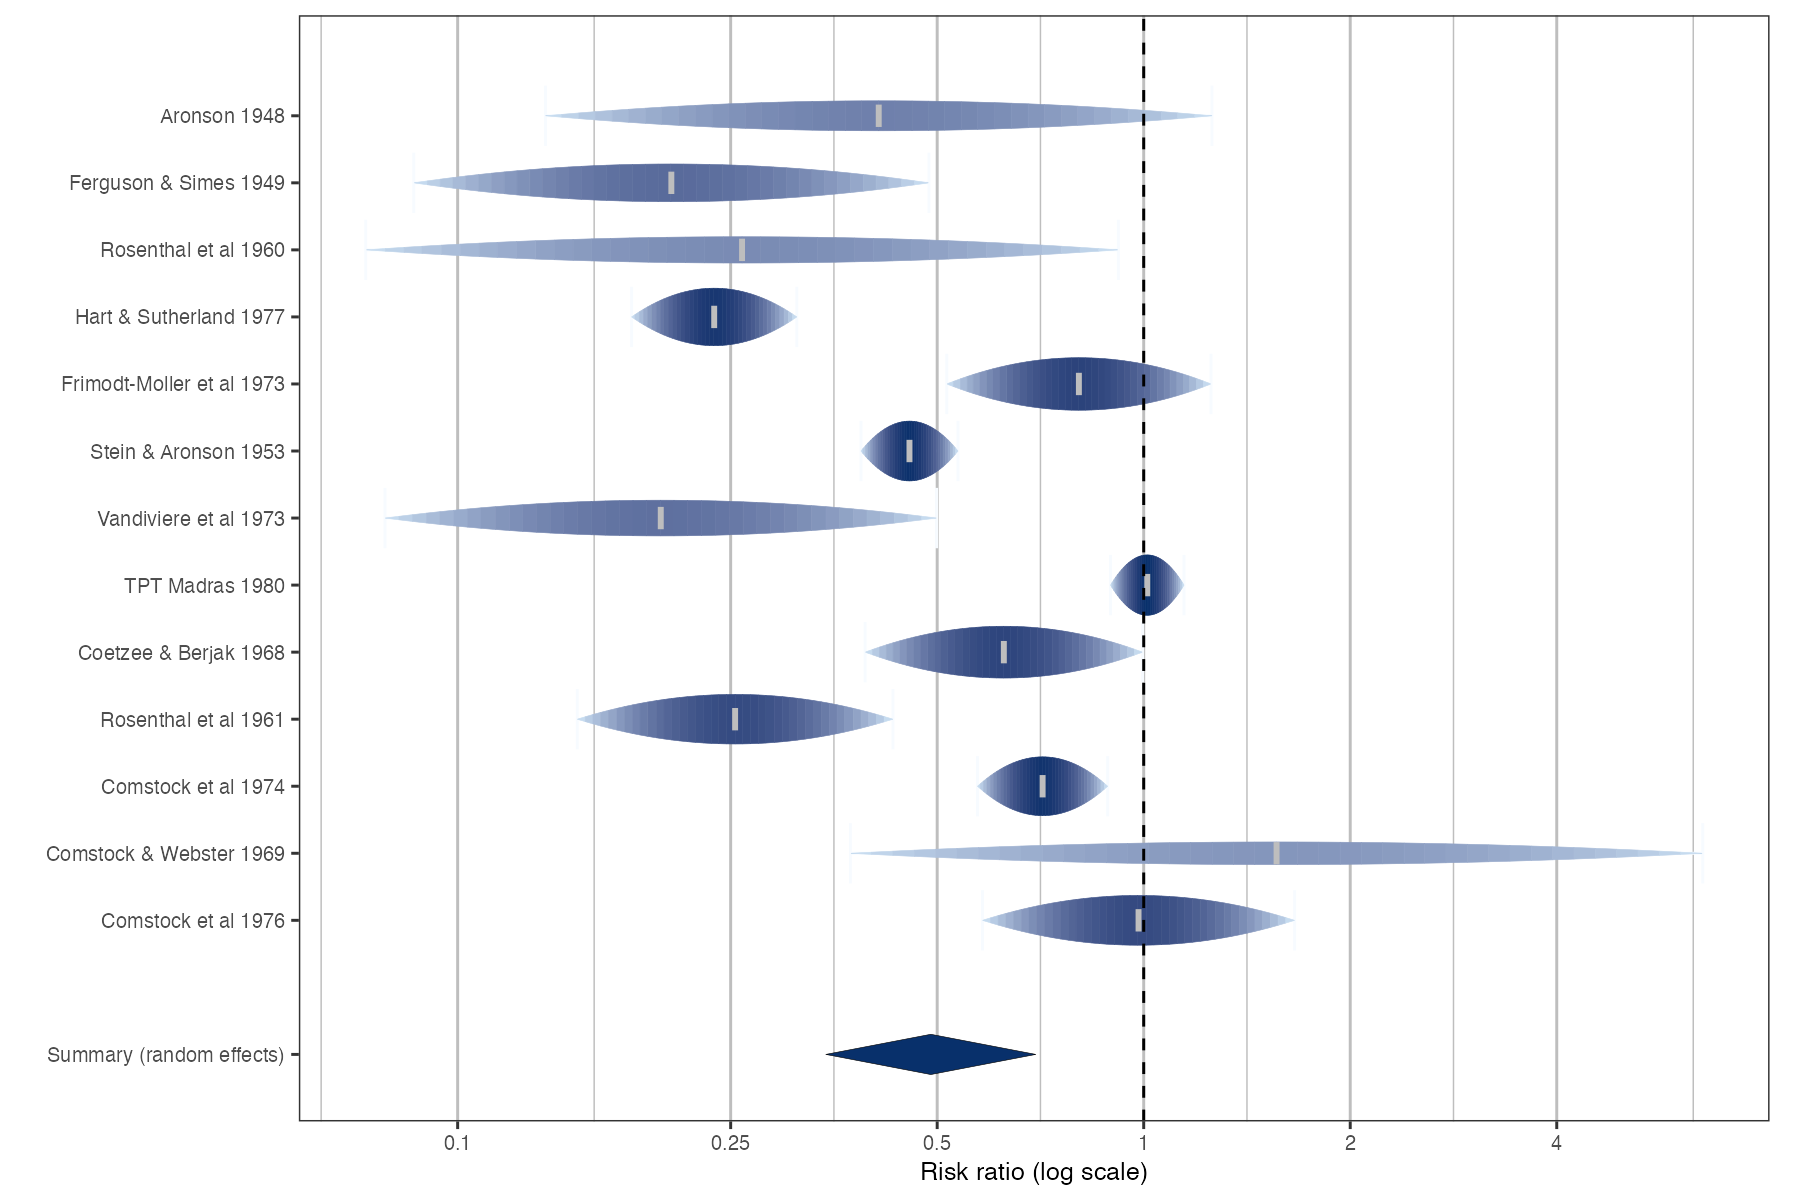
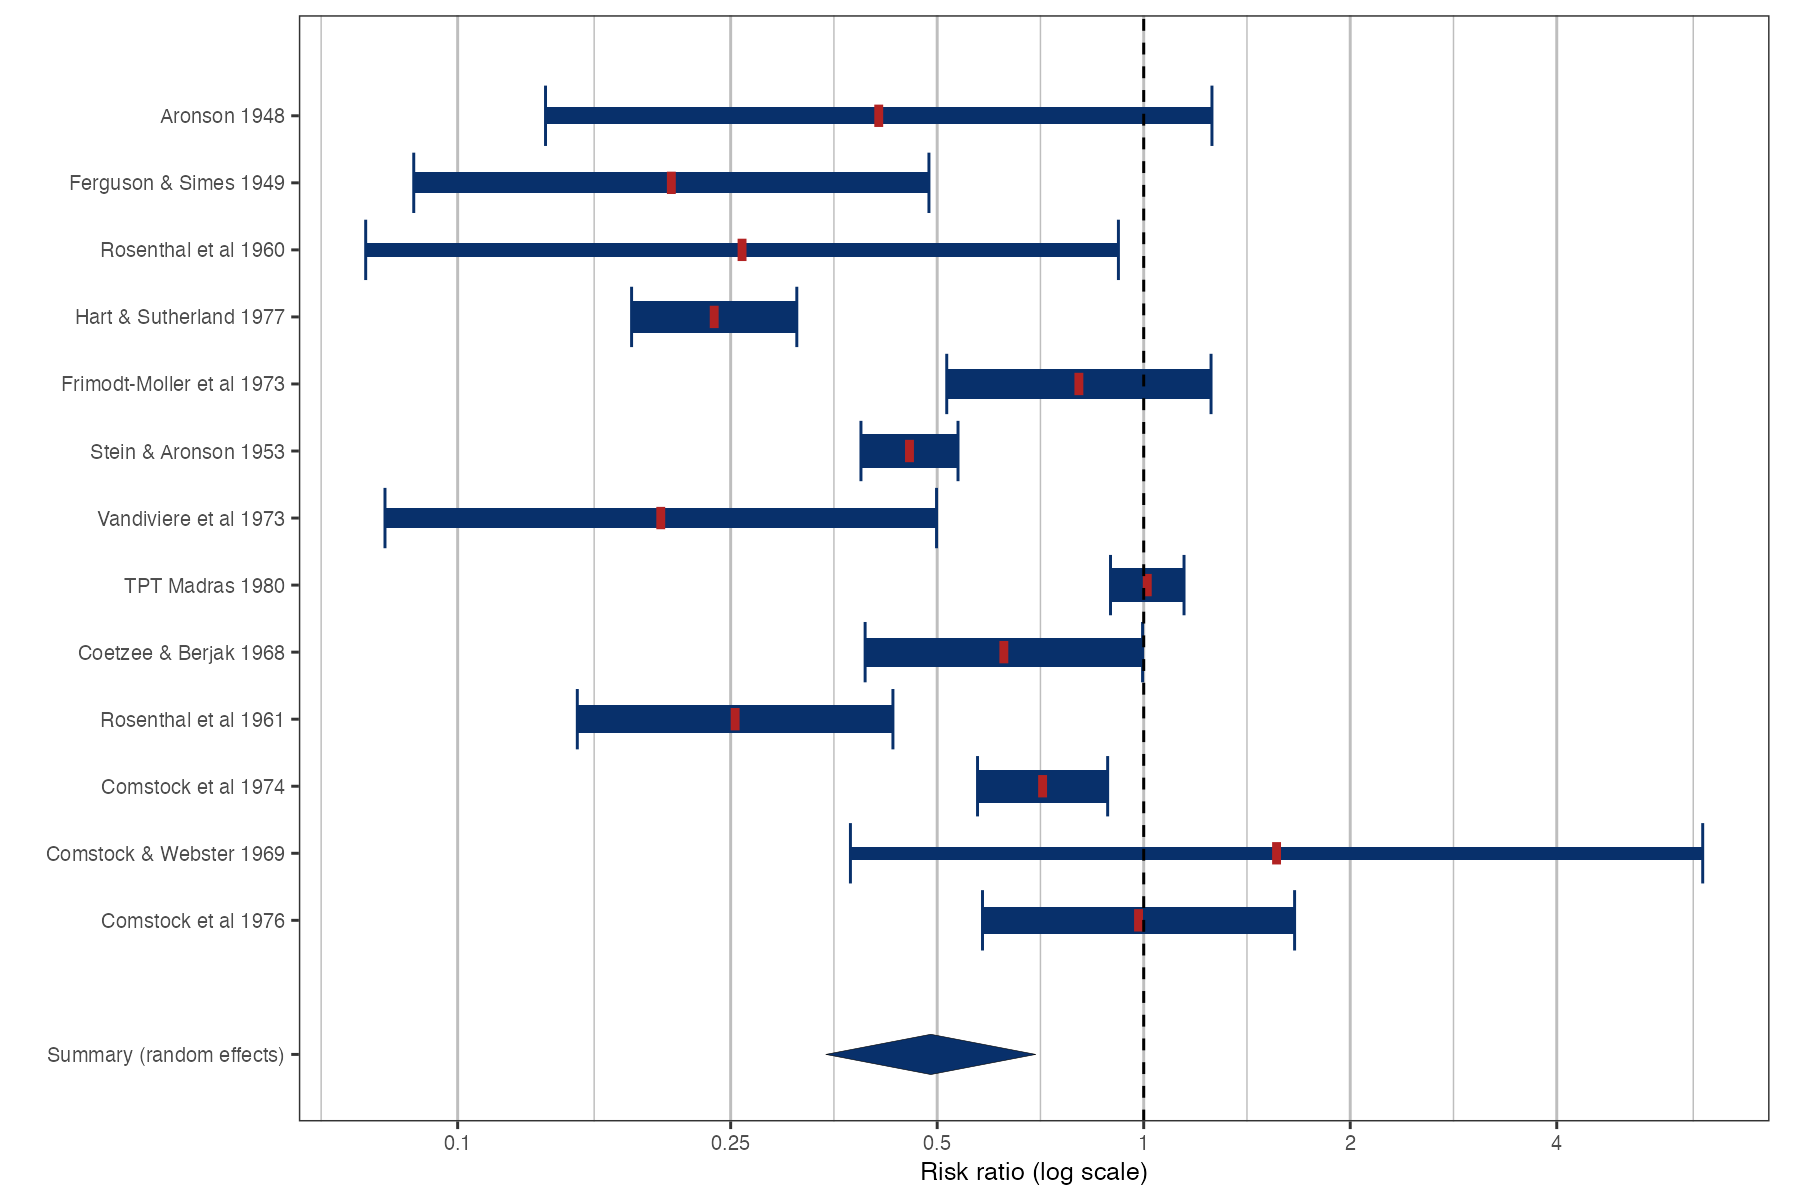
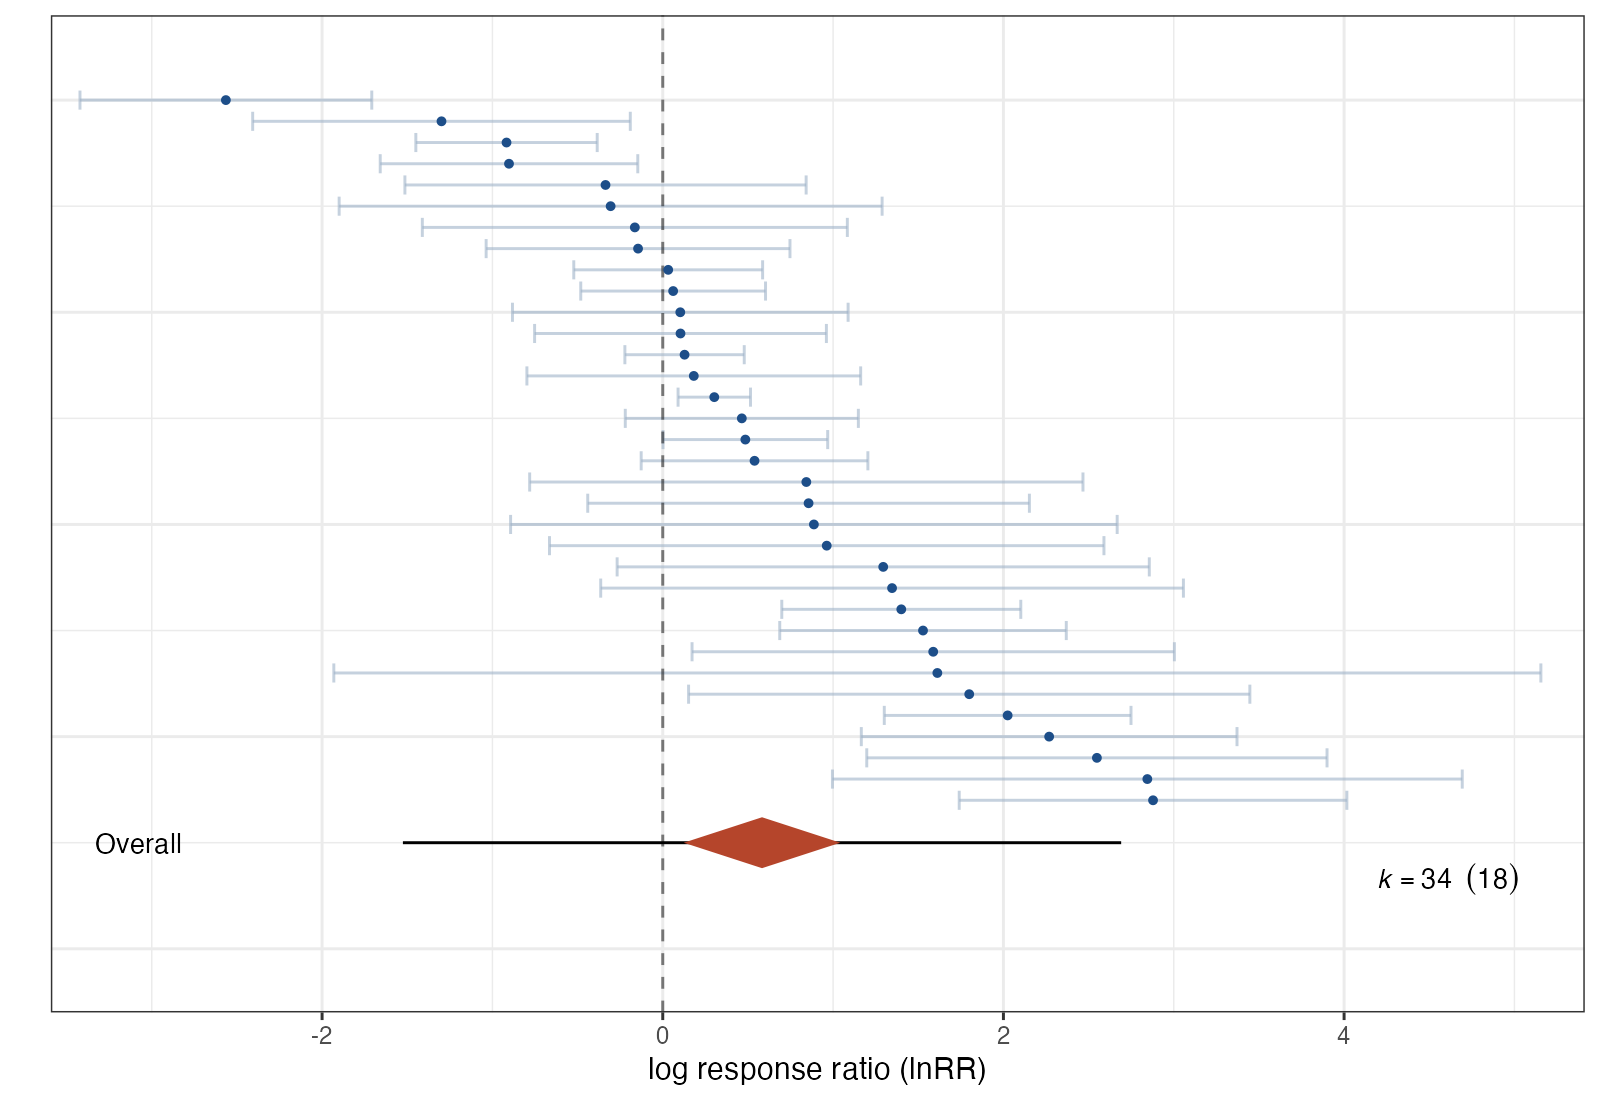
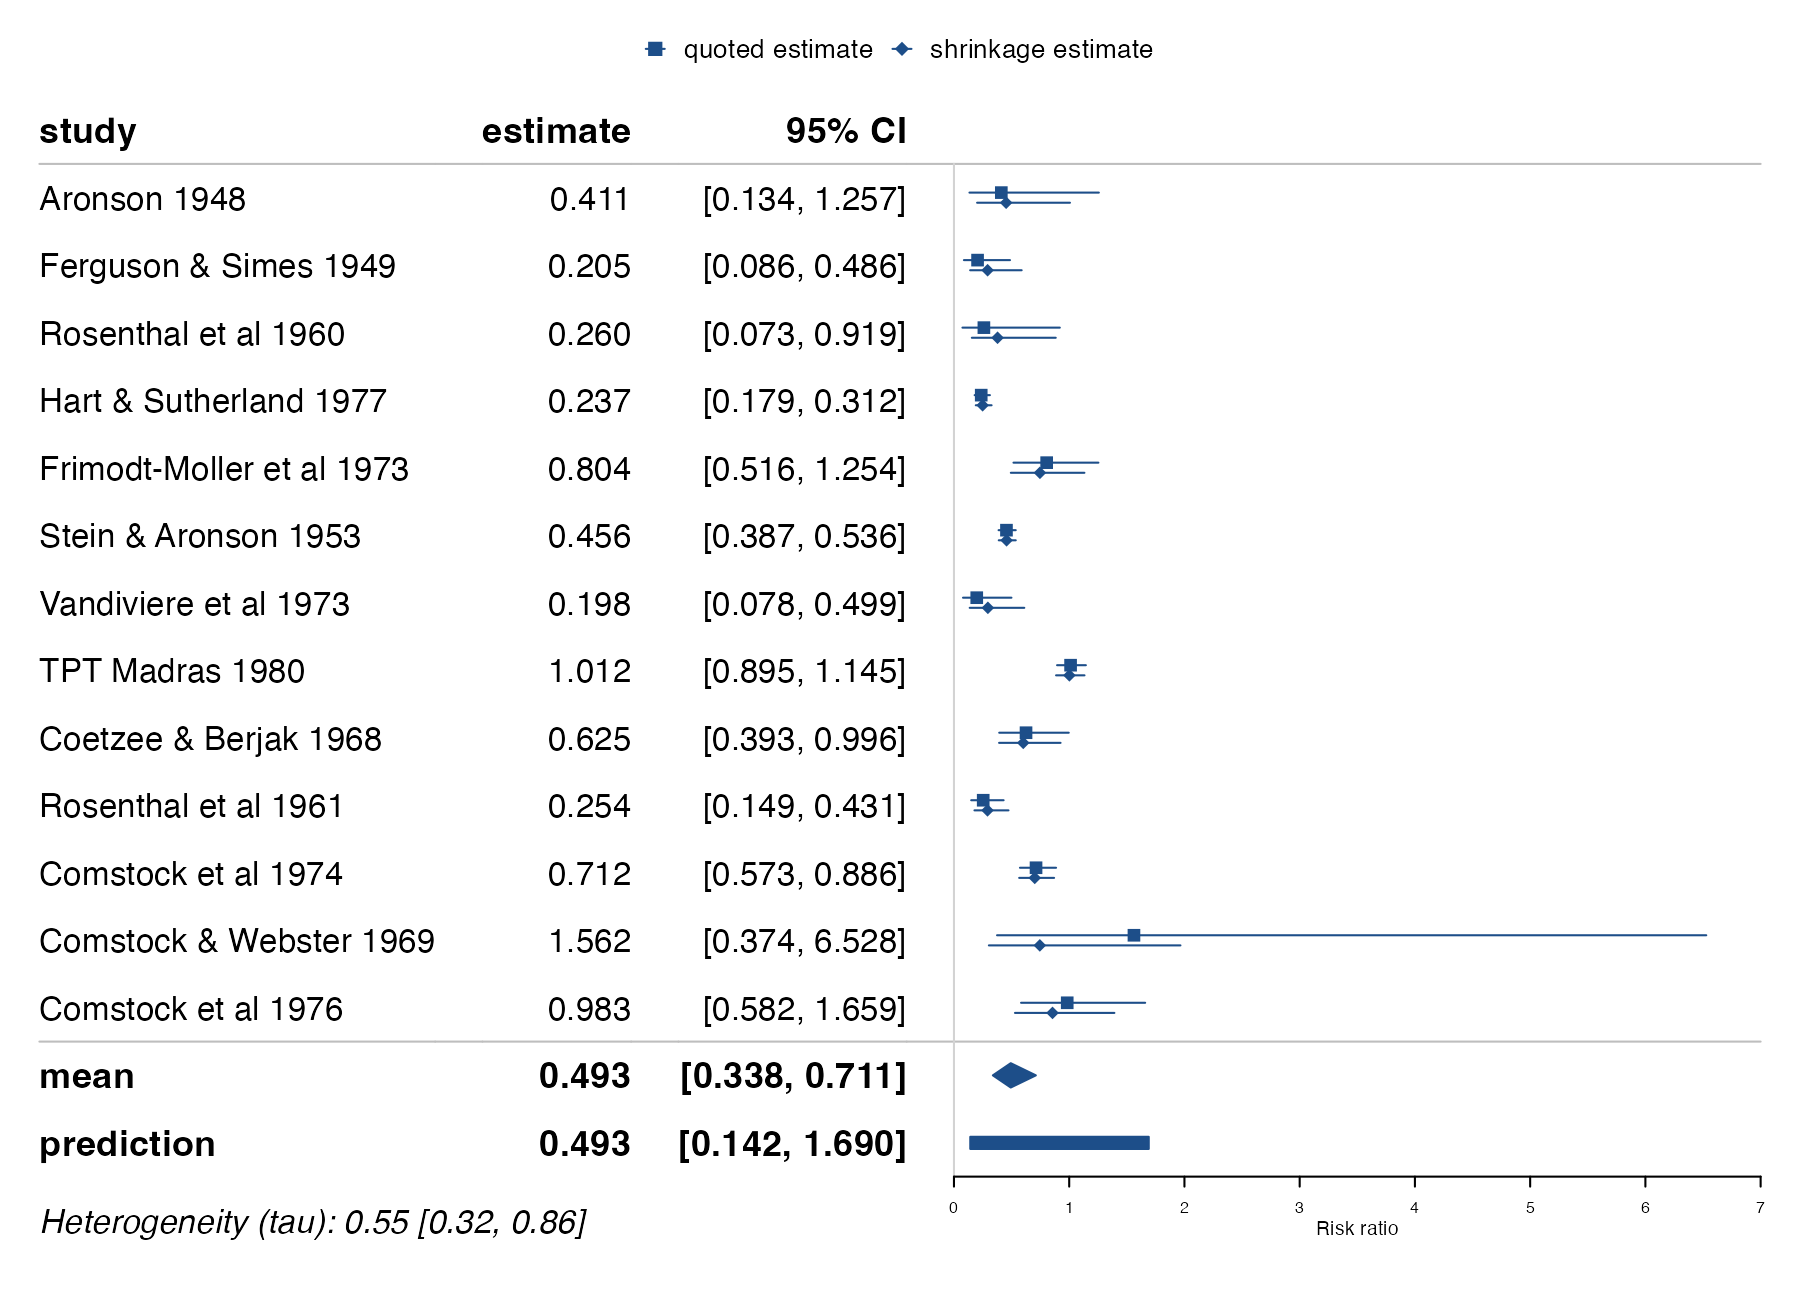
- A forest plot with a prediction interval when a random-effects model is used.
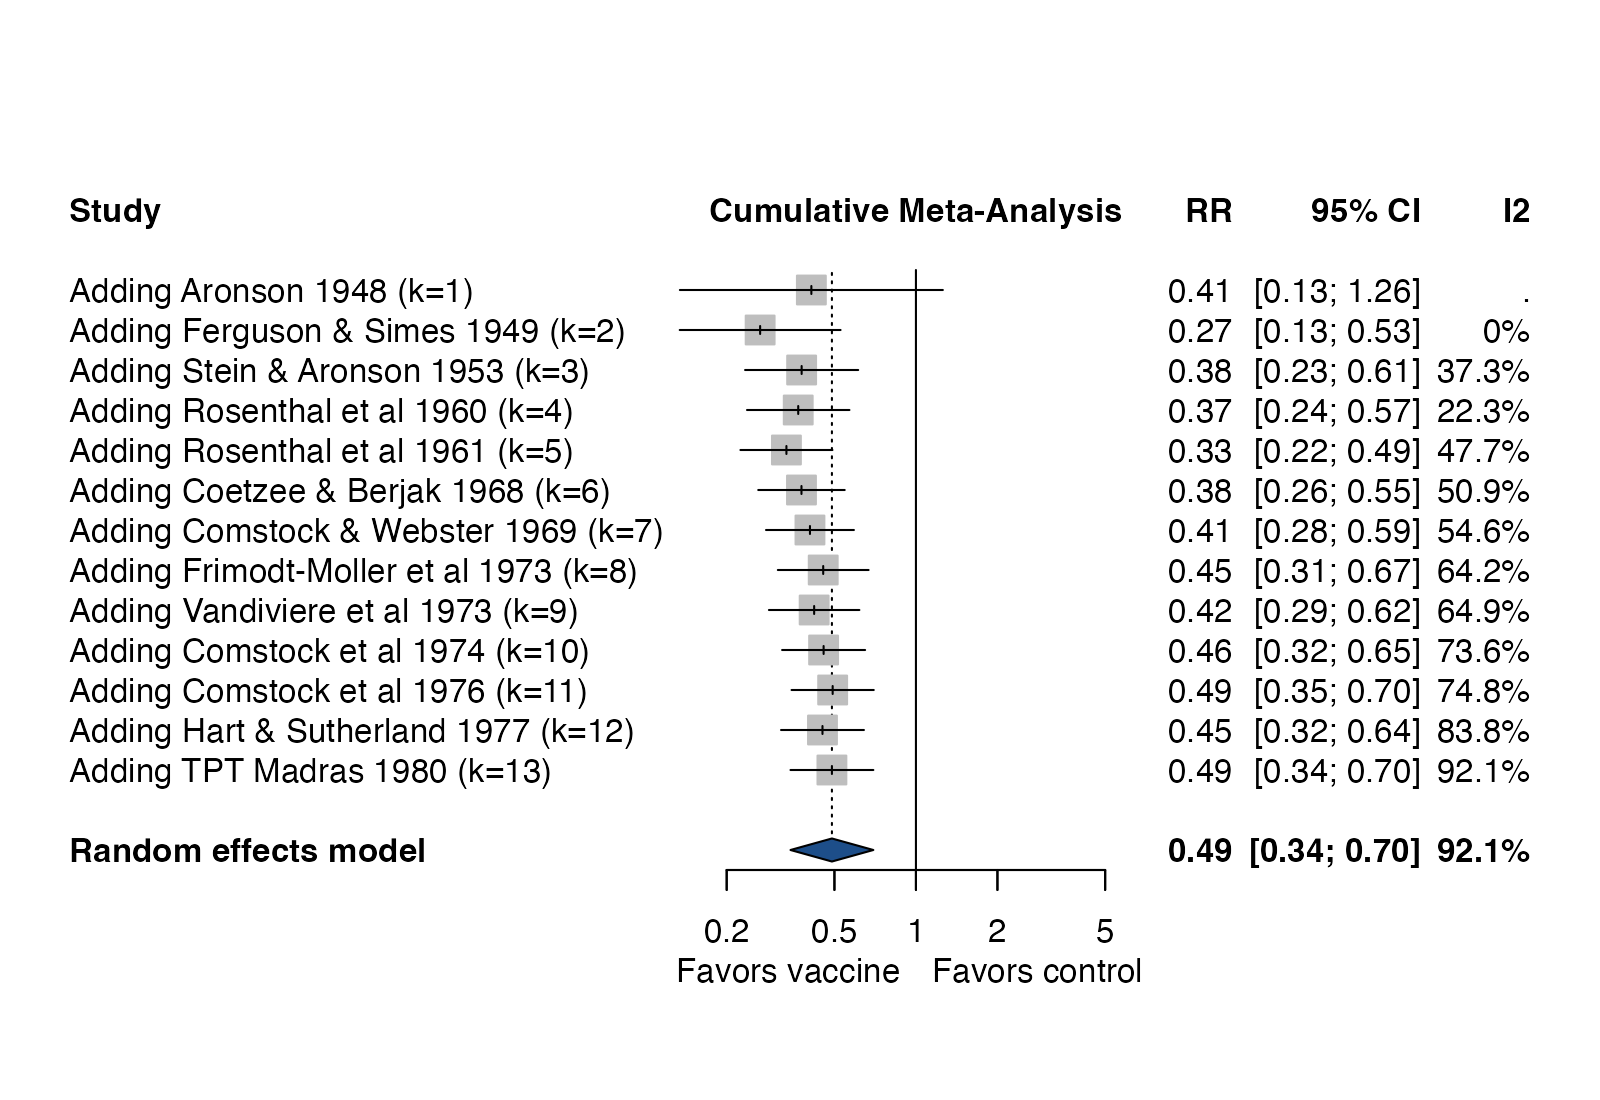
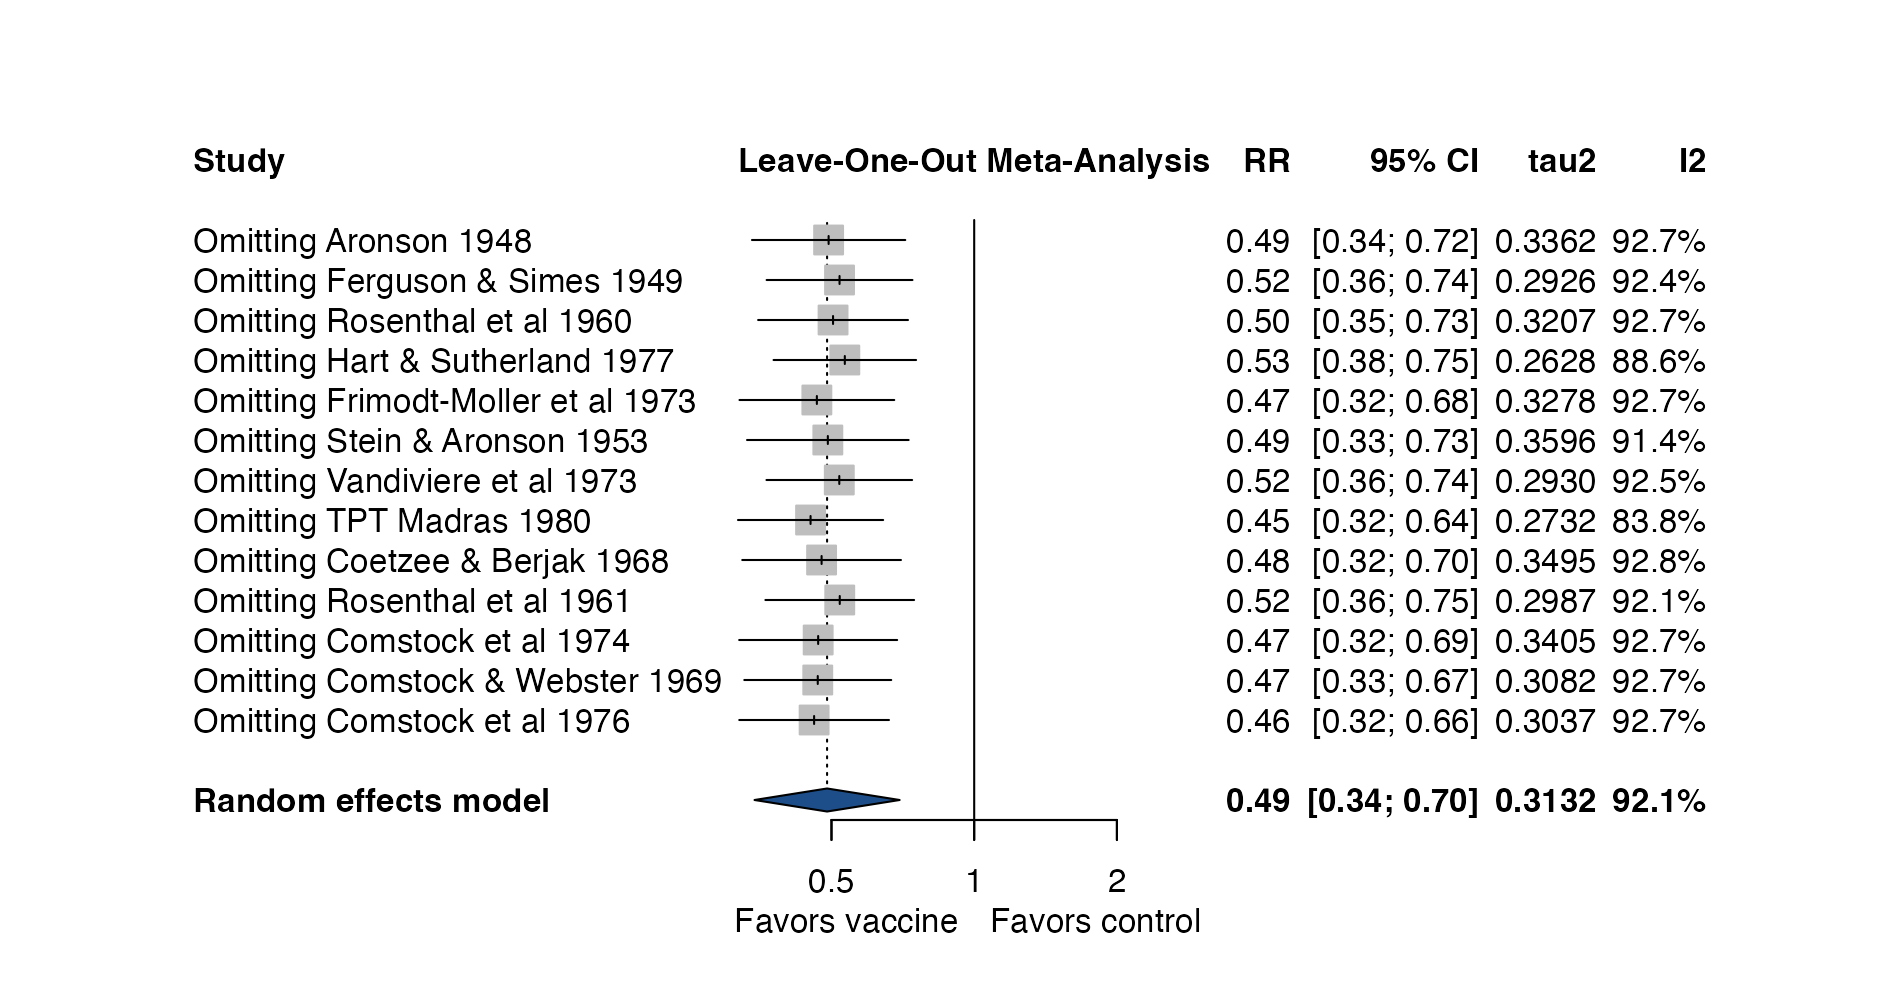
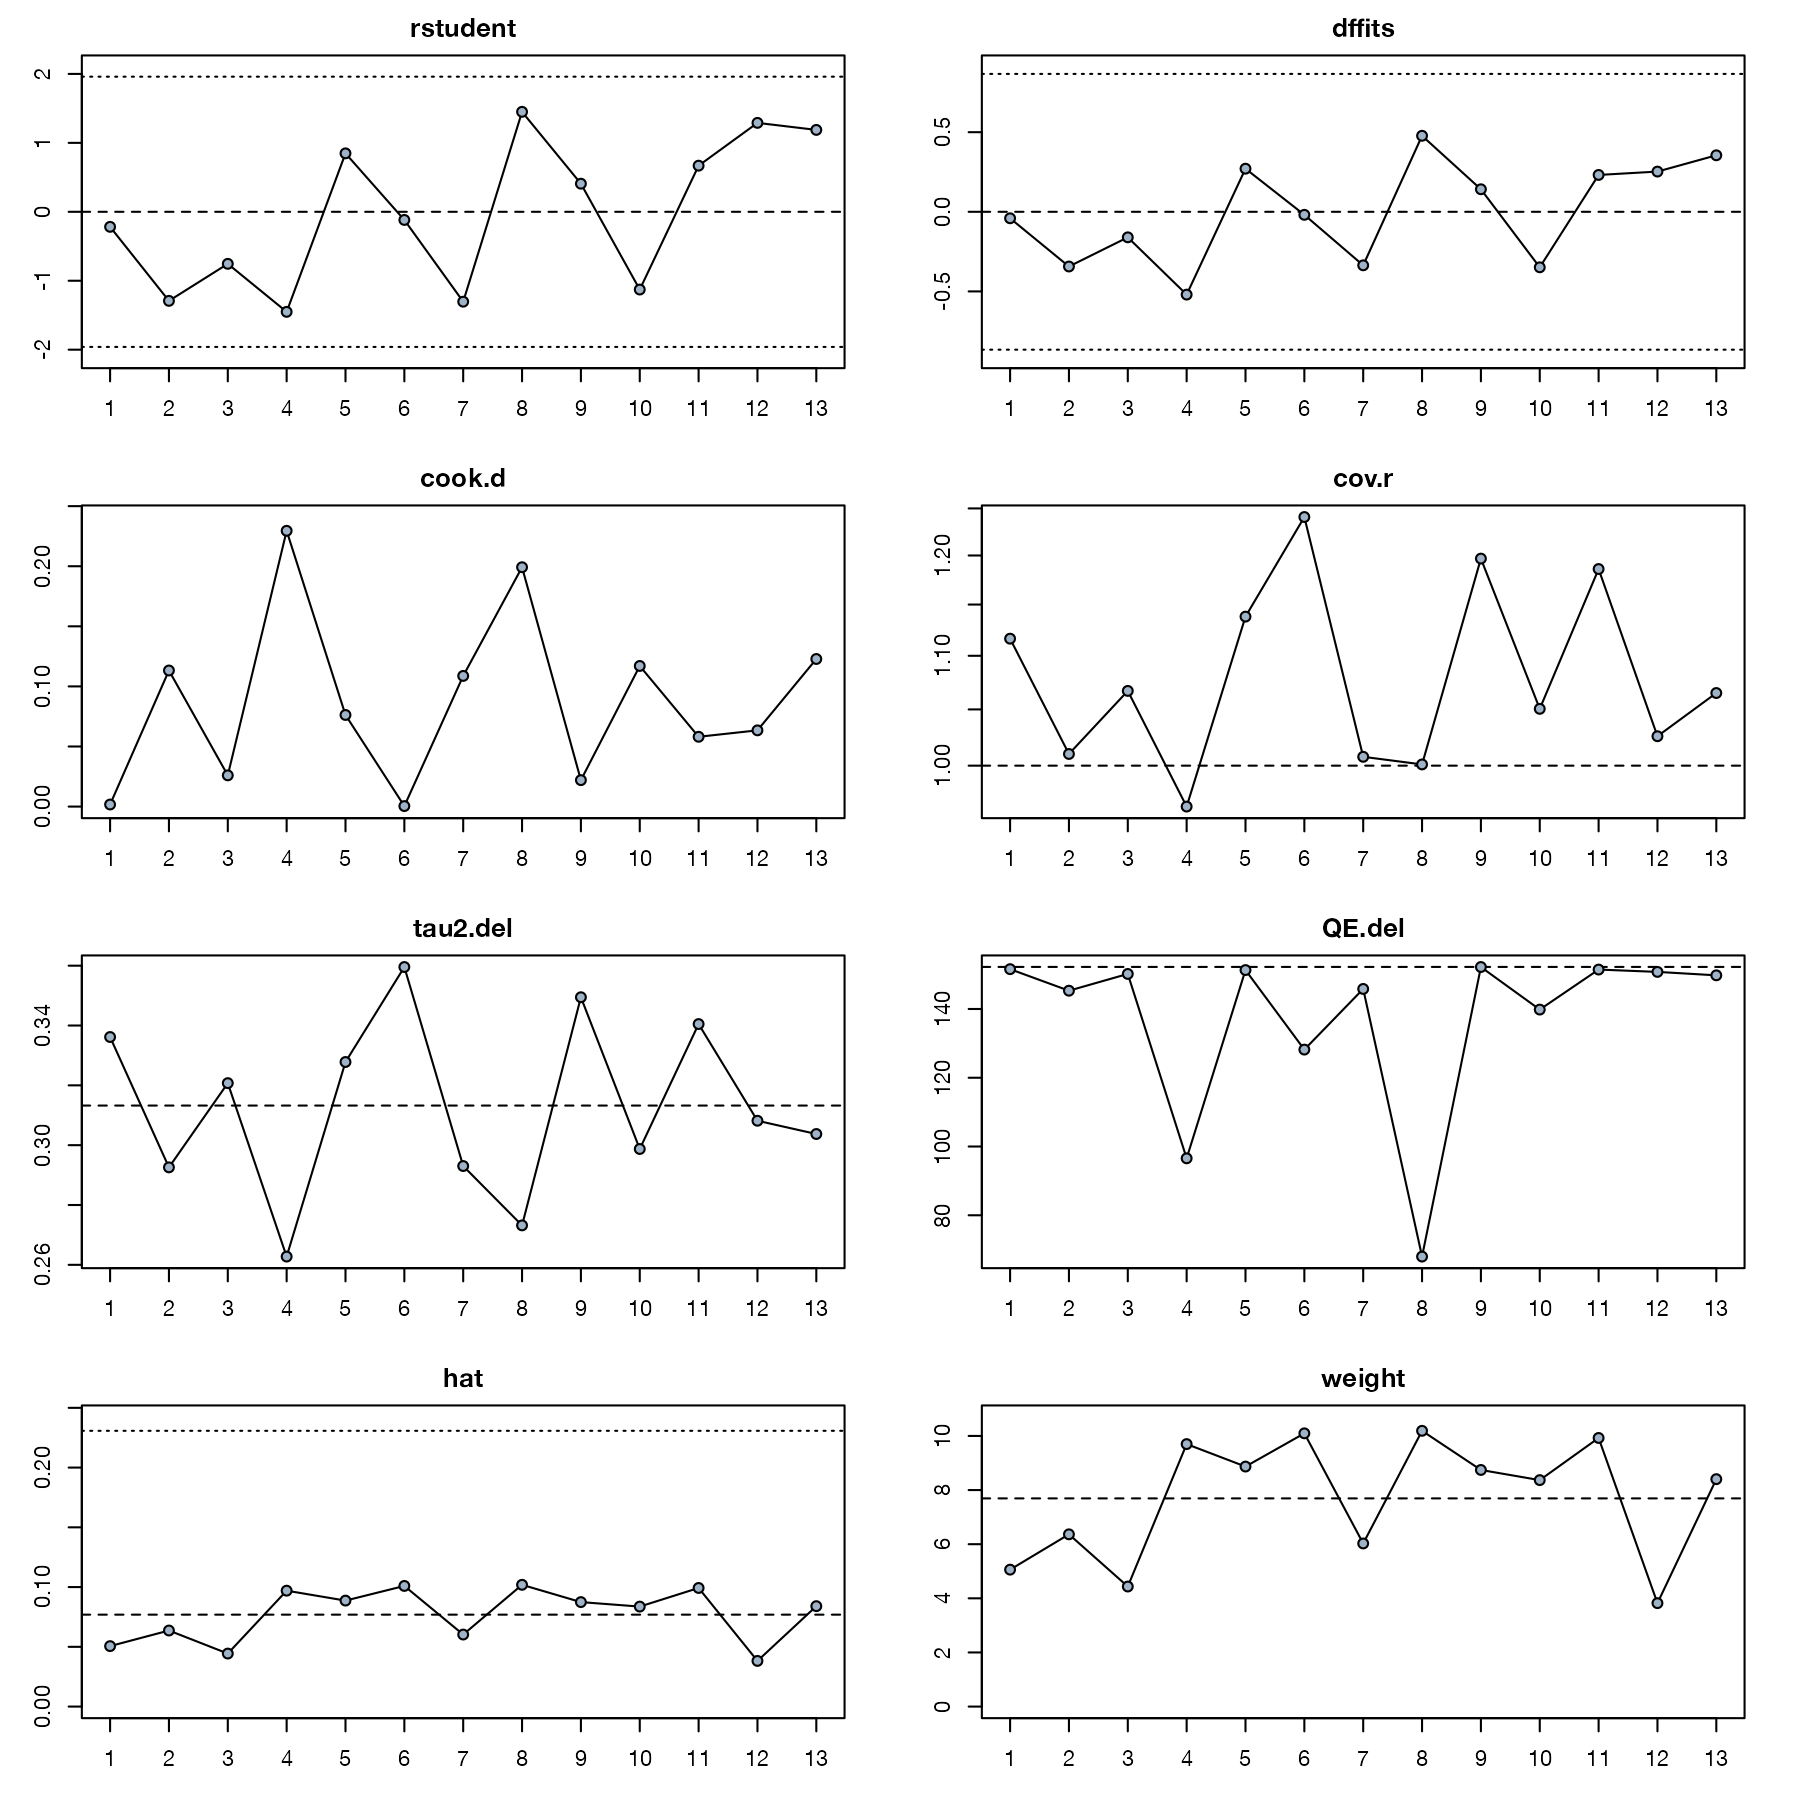
- A heterogeneity or influence diagnostic: Baujat plot, leave-one-out forest, or influence panel.
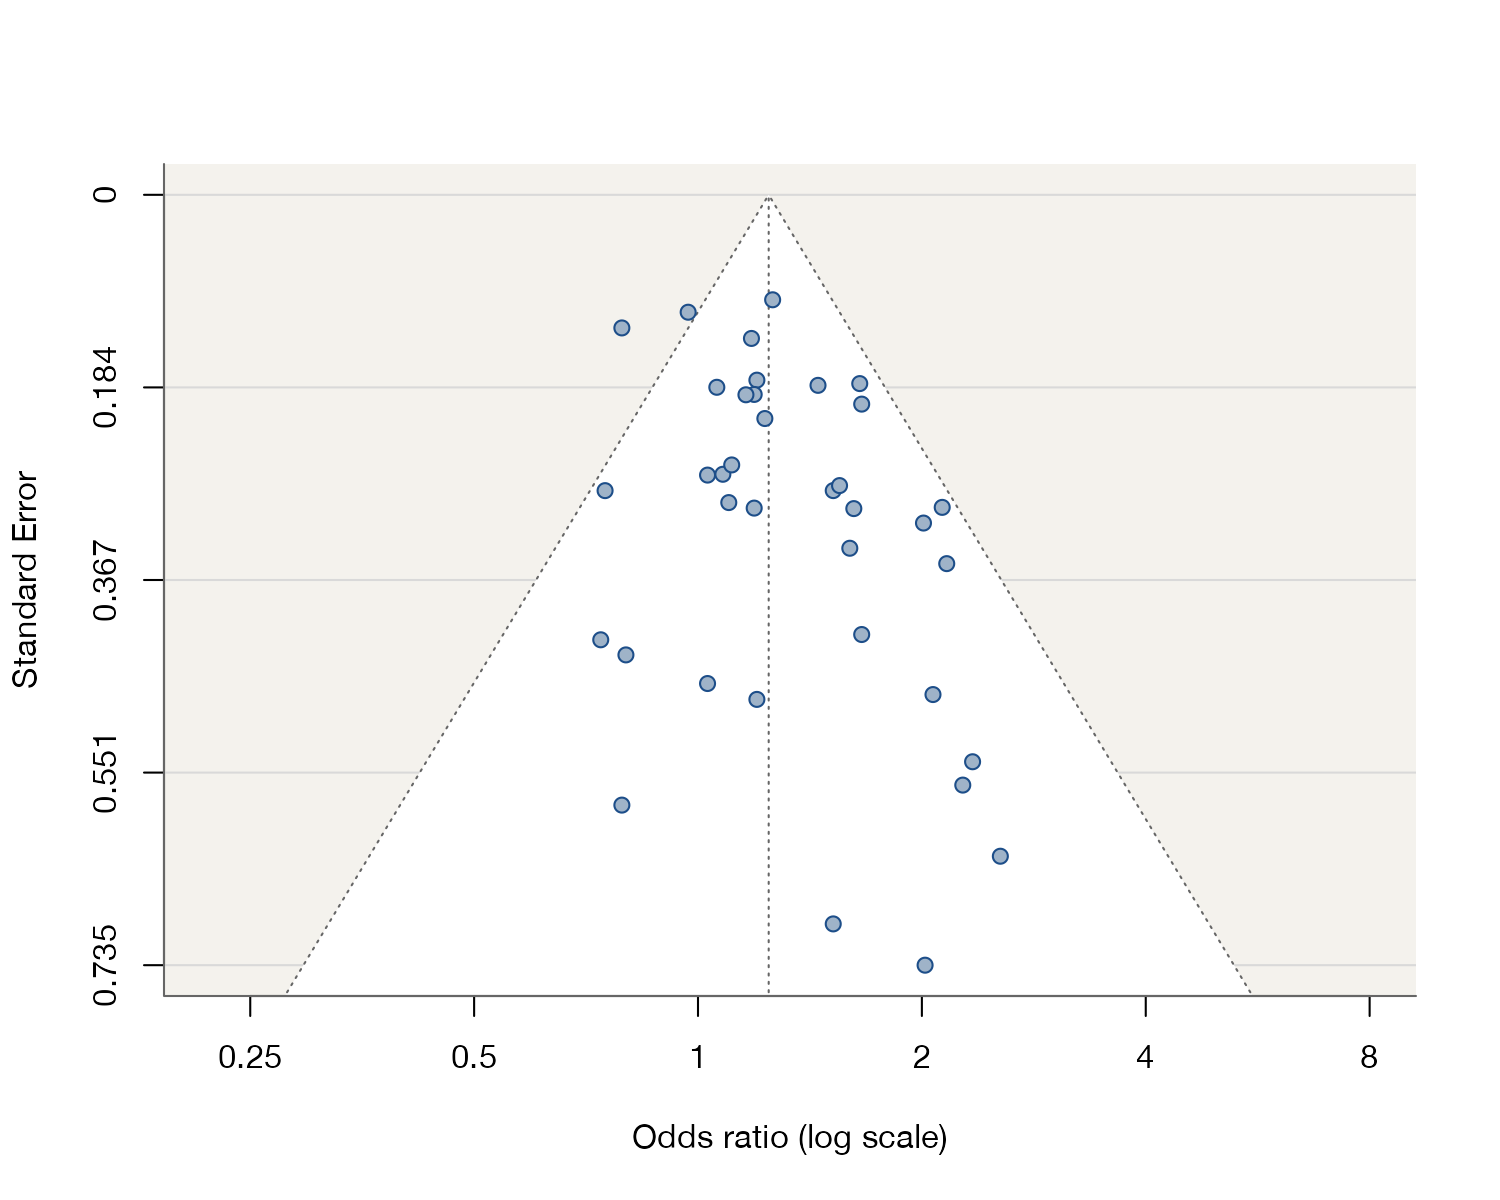
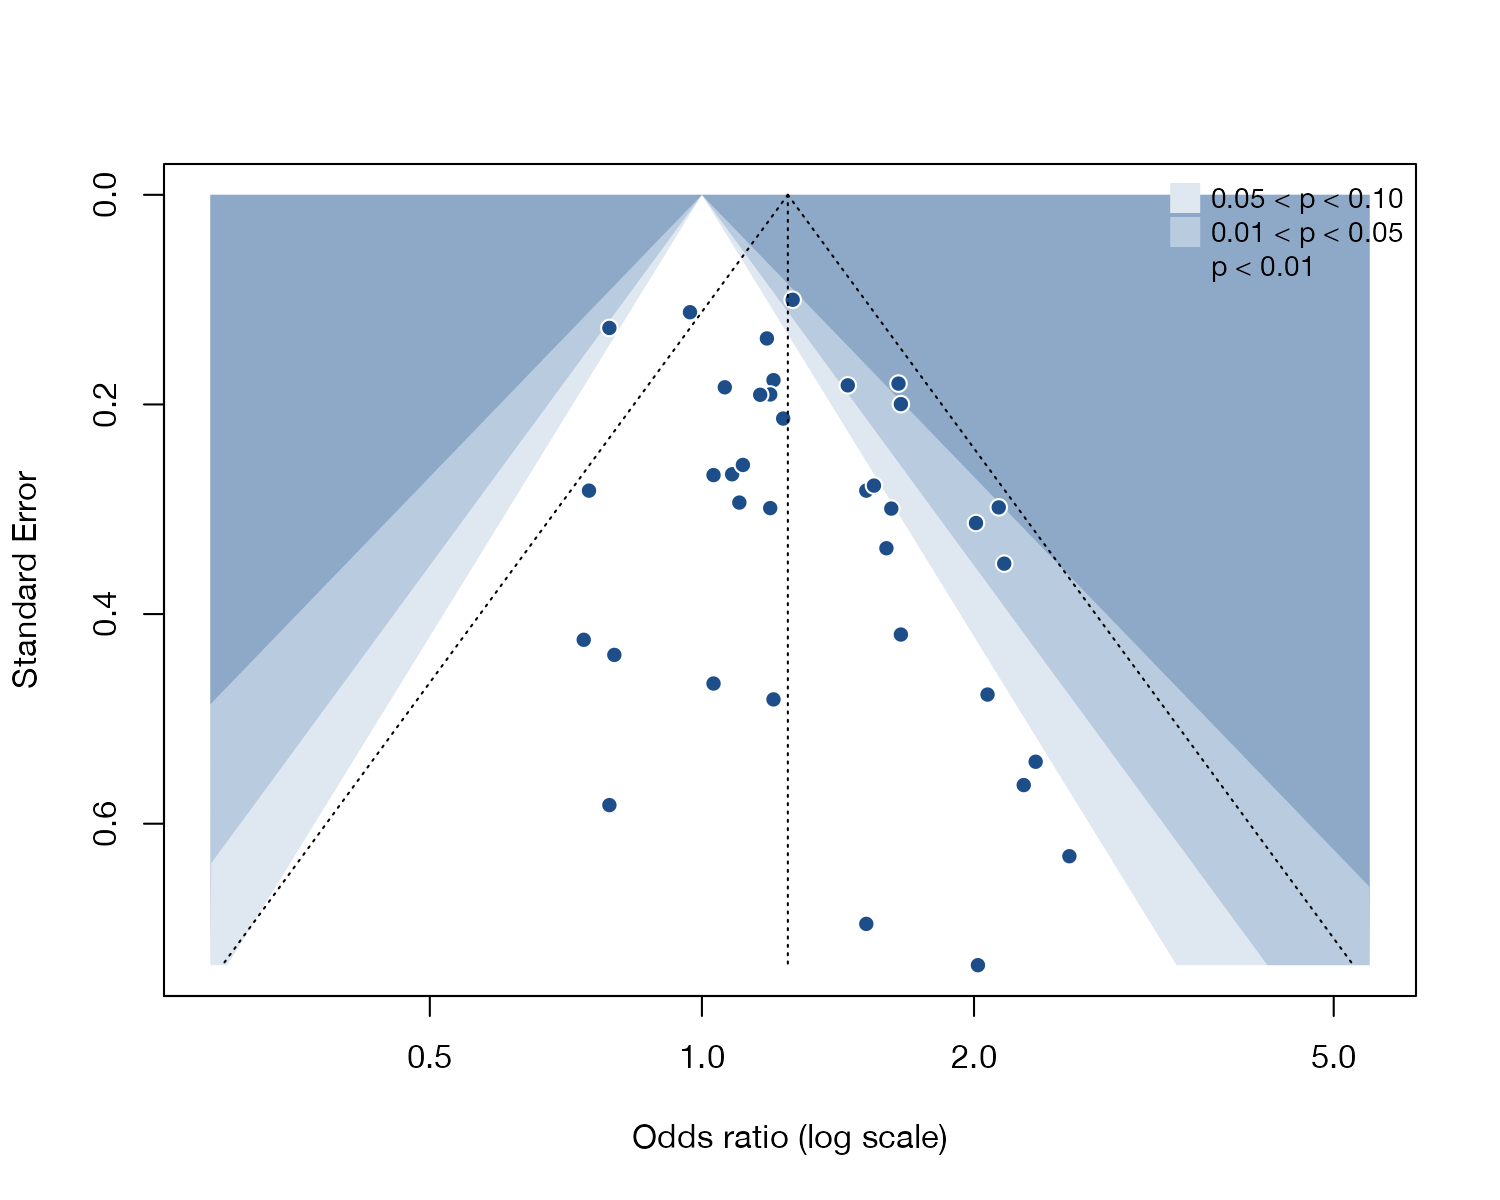
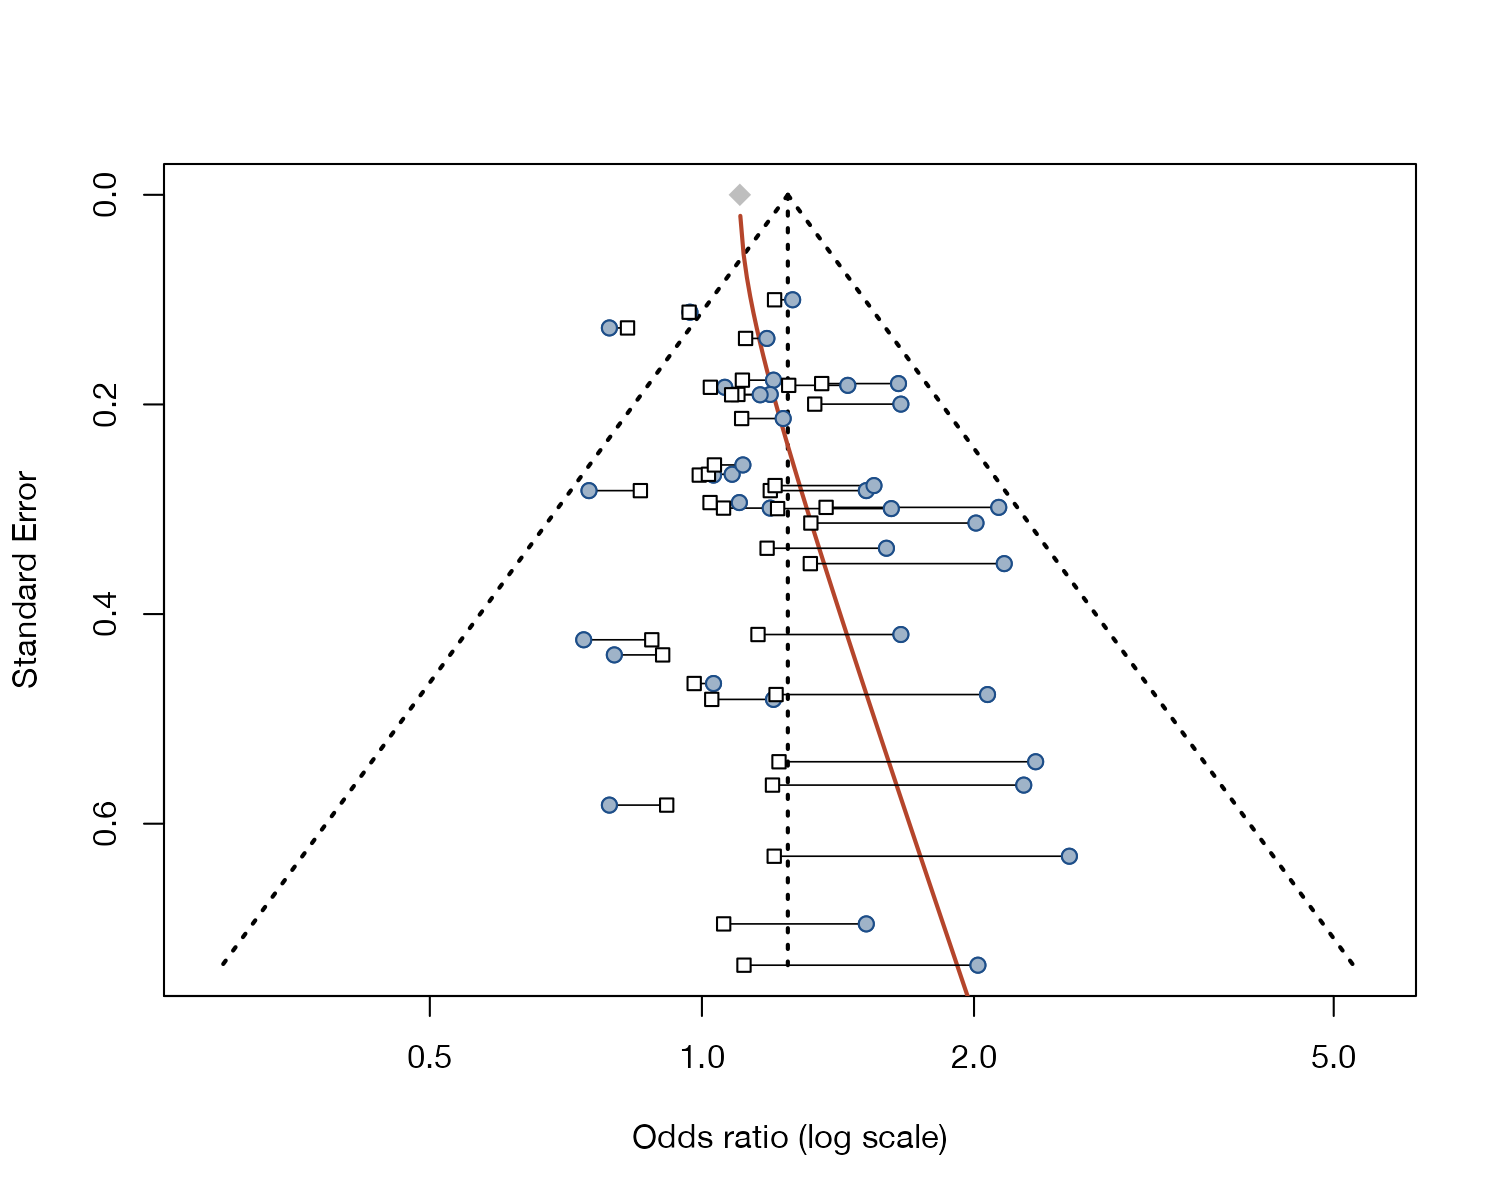
- A funnel plot, preferably contour-enhanced, only when there are enough studies (about ten or more).
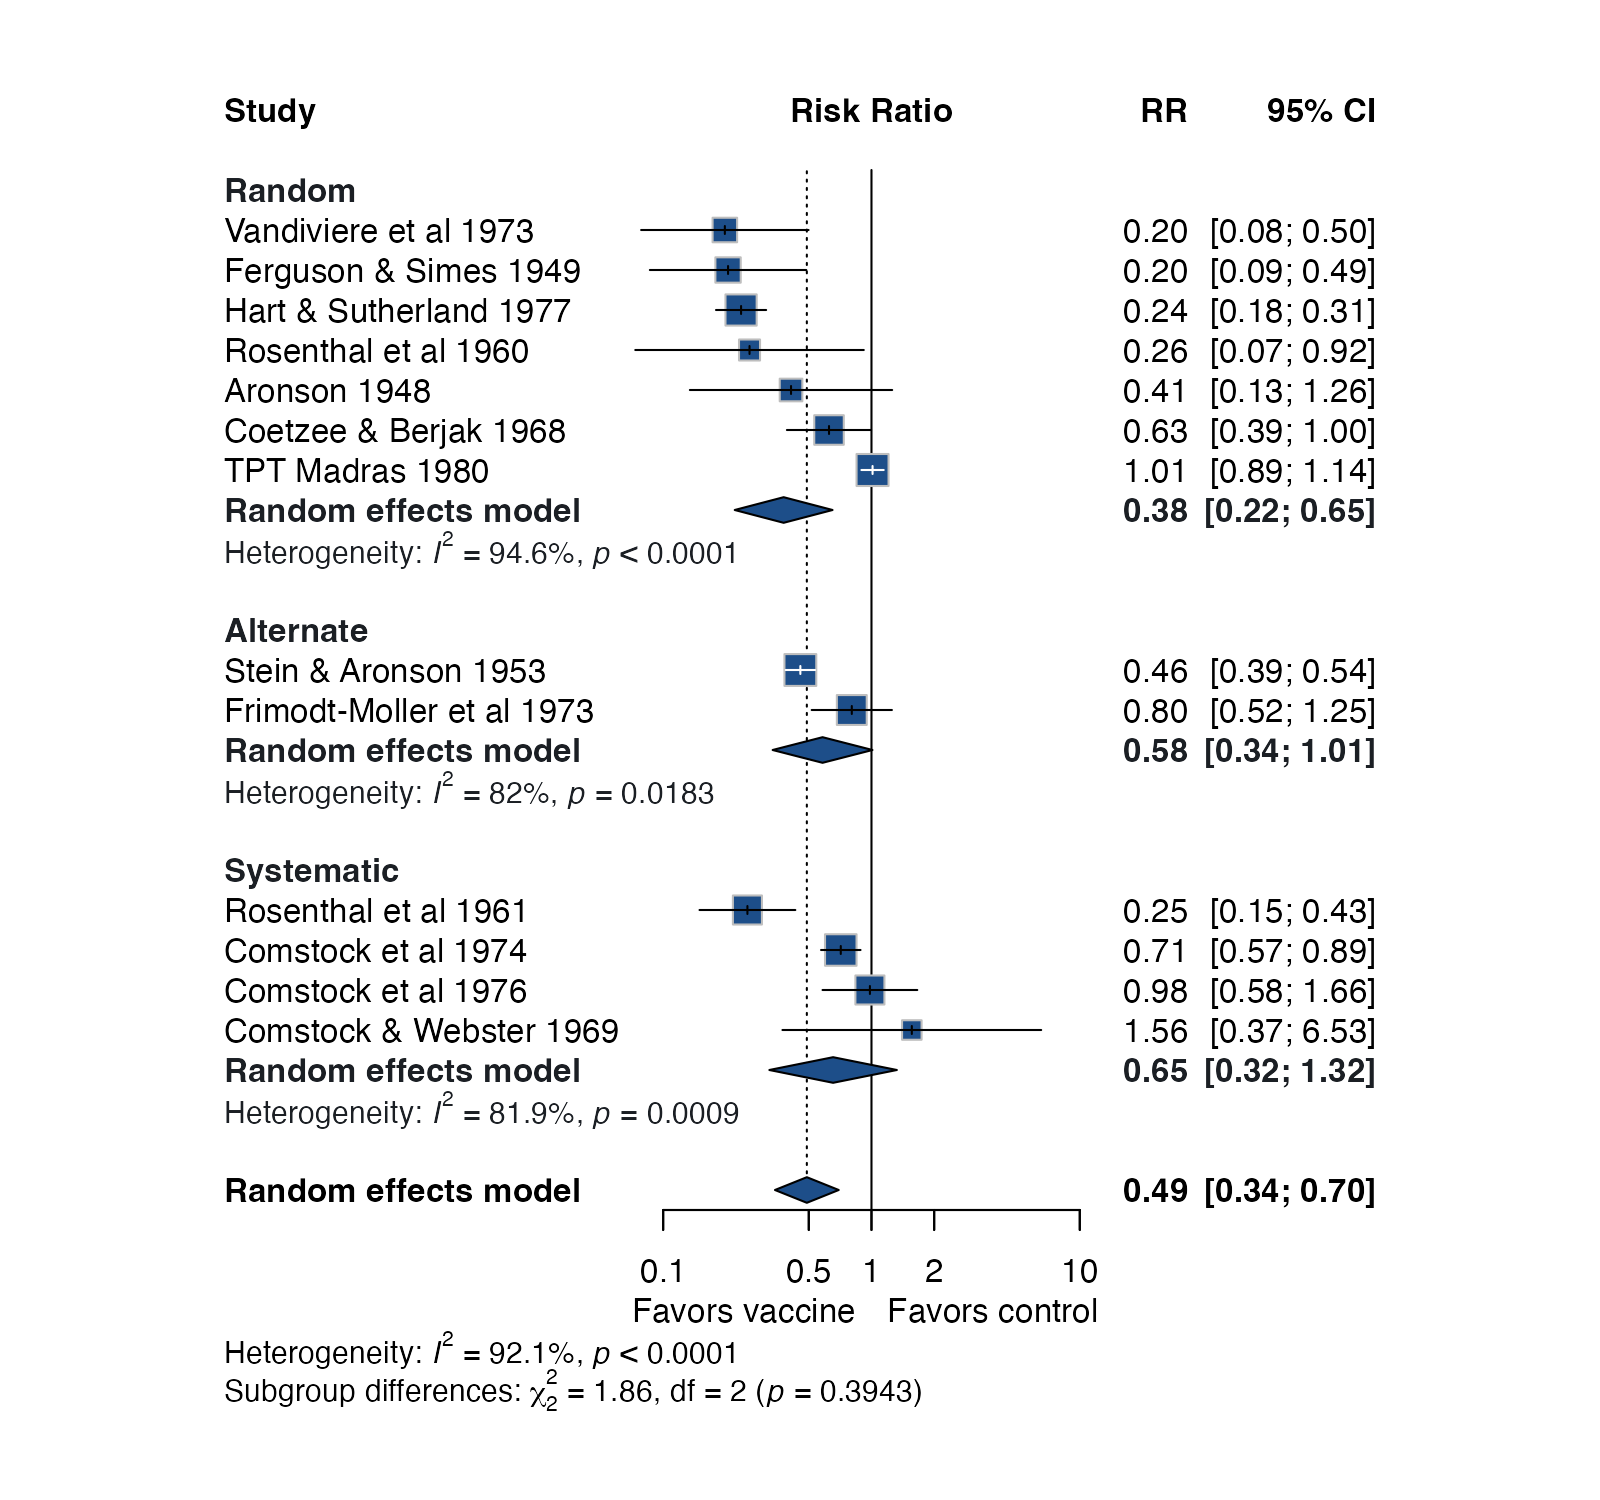
- A bubble plot or subgroup forest plot whenever heterogeneity is being explained.
All plots for pairwise meta-analysis
Effect display
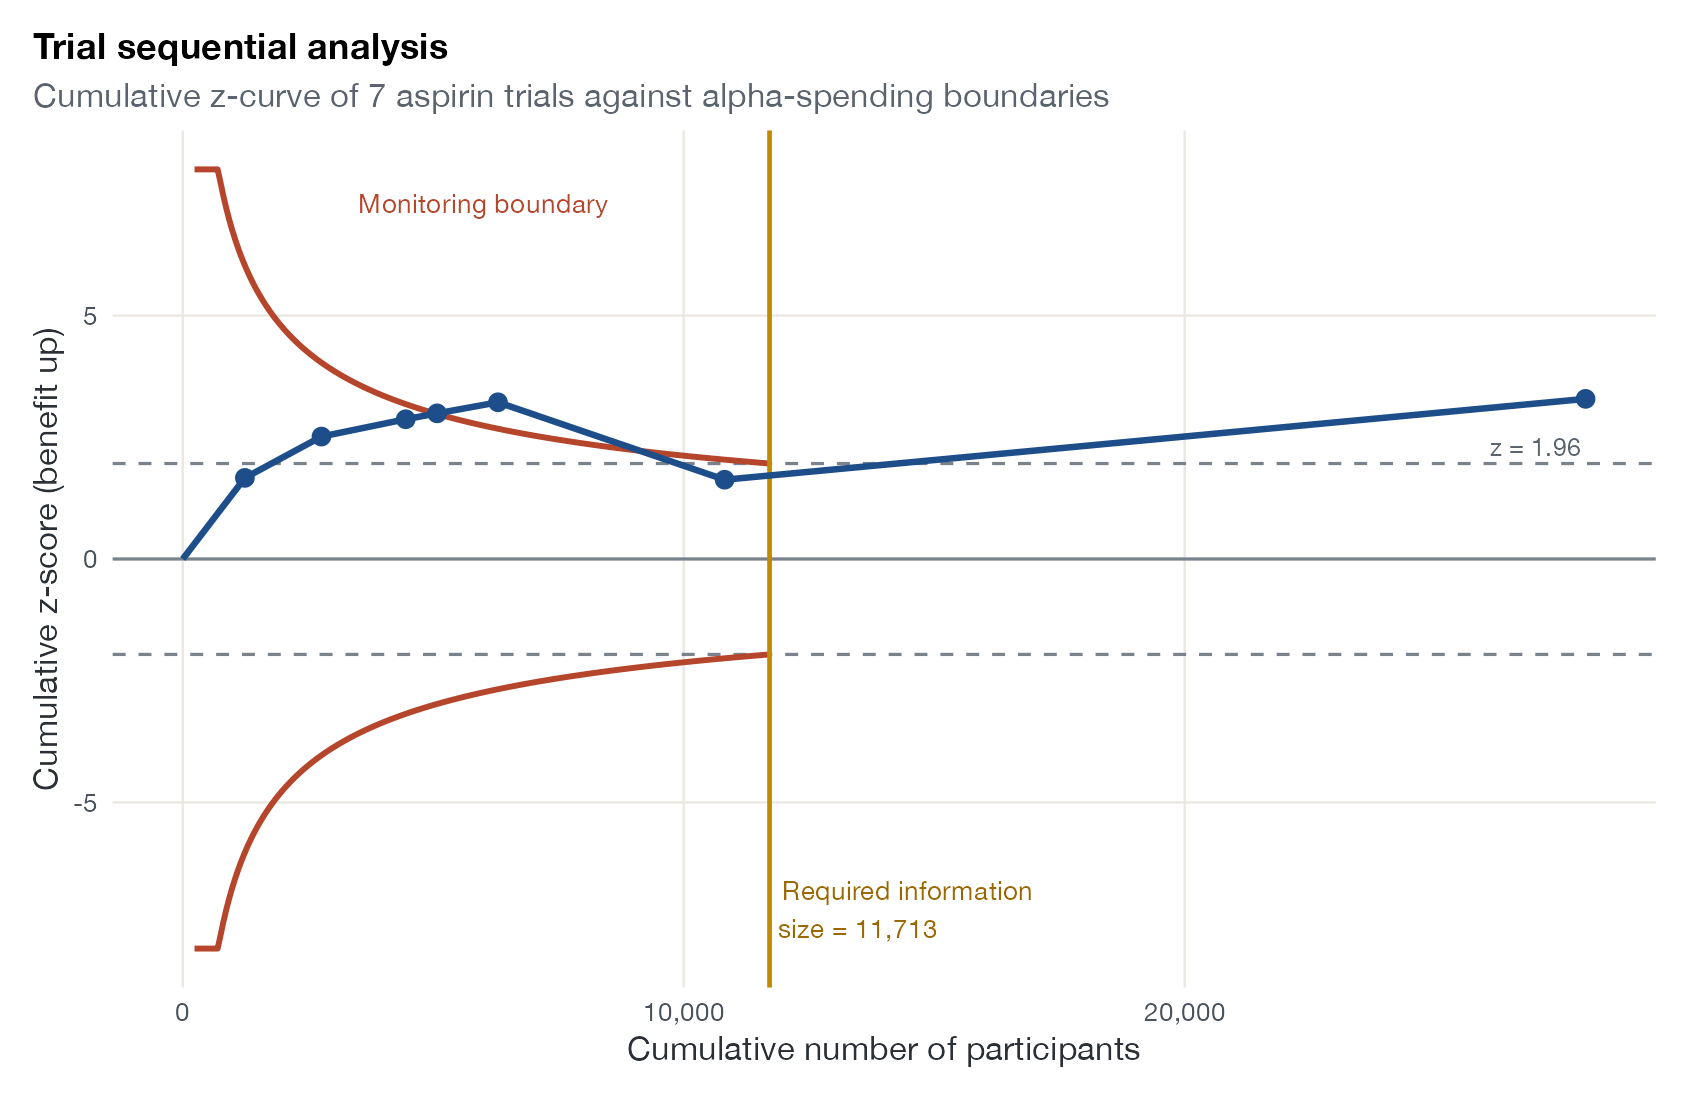
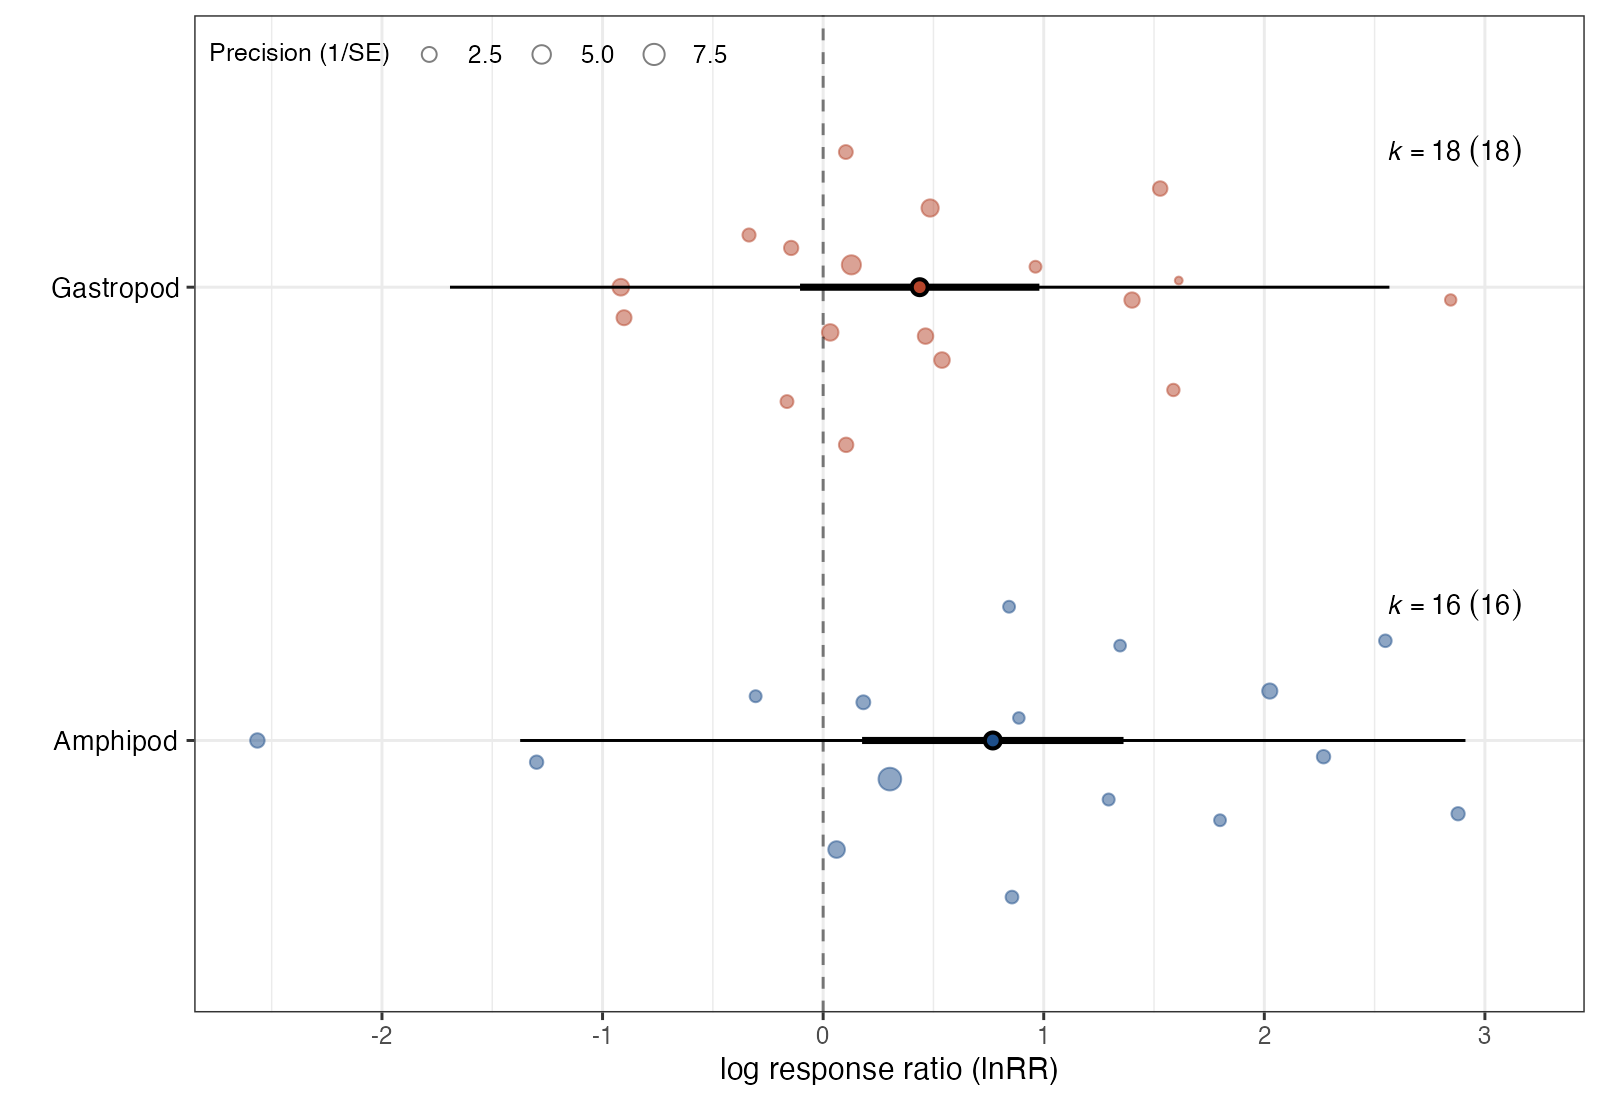
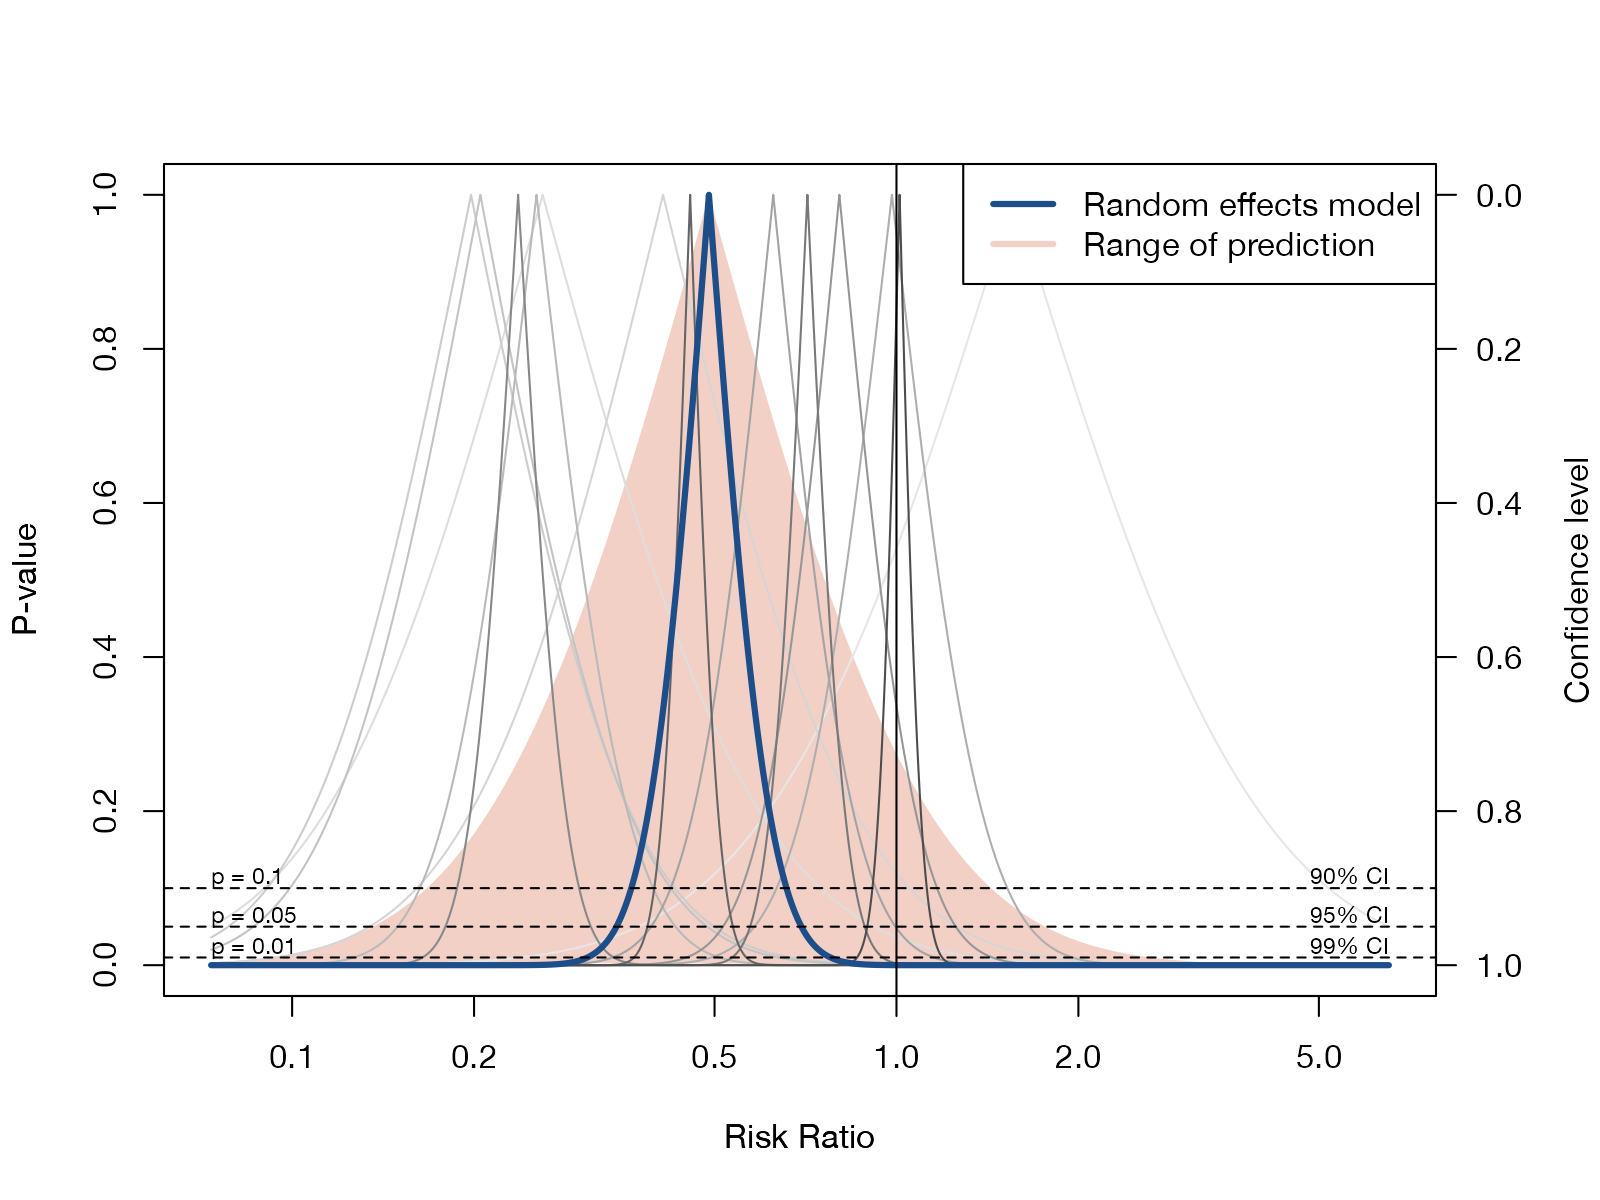
Estimates, intervals, and pooled summaries: the forest plot and its many descendants.
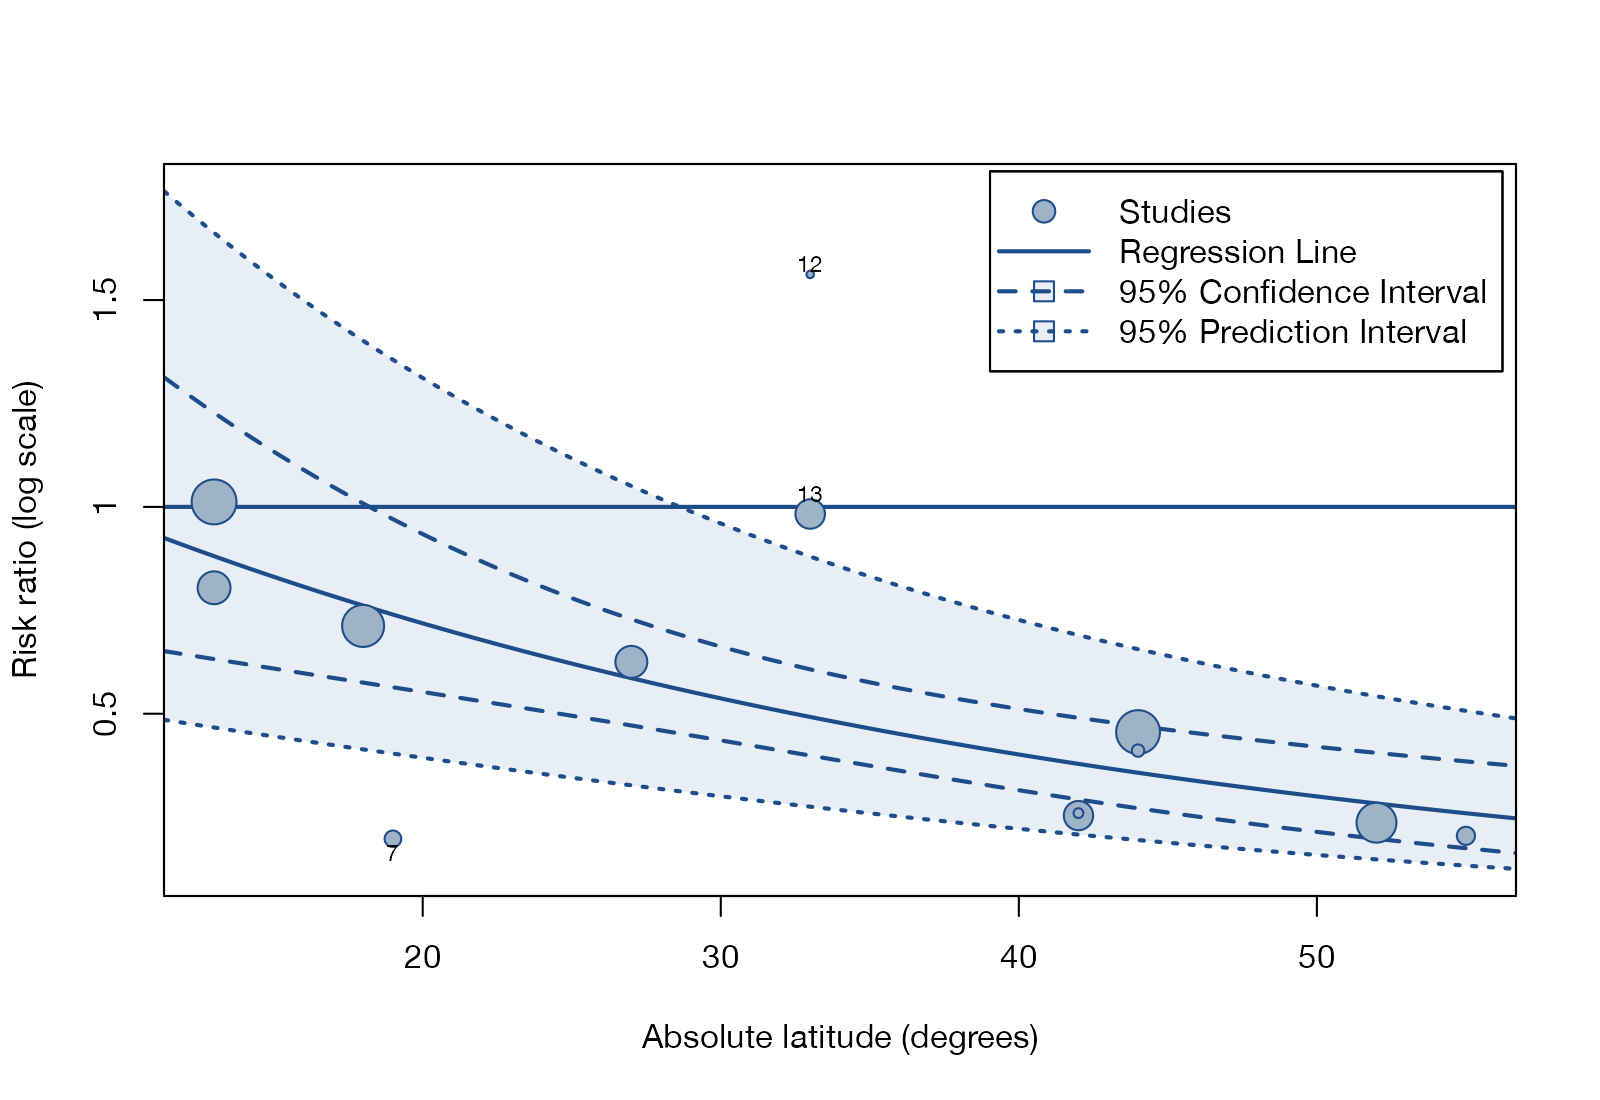
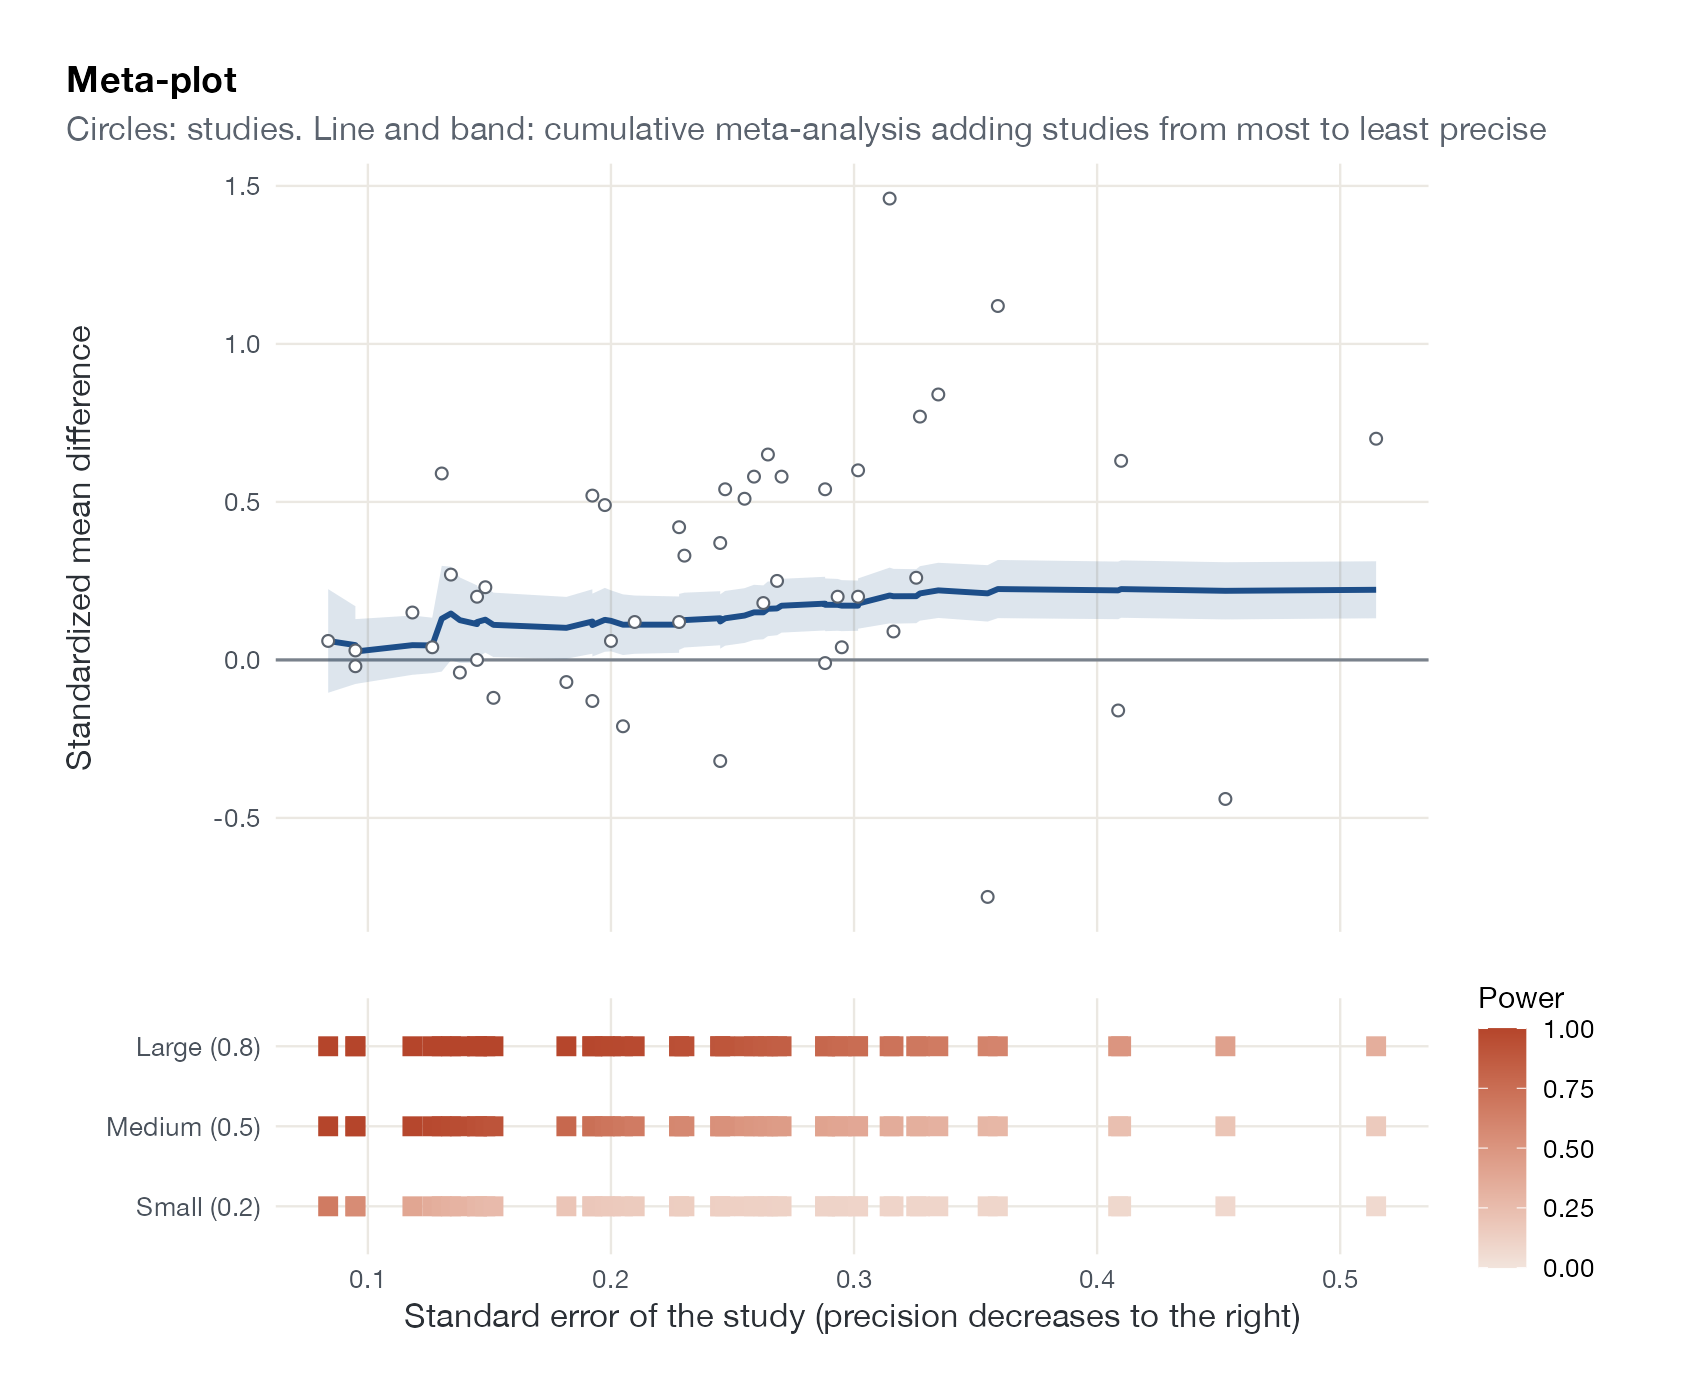
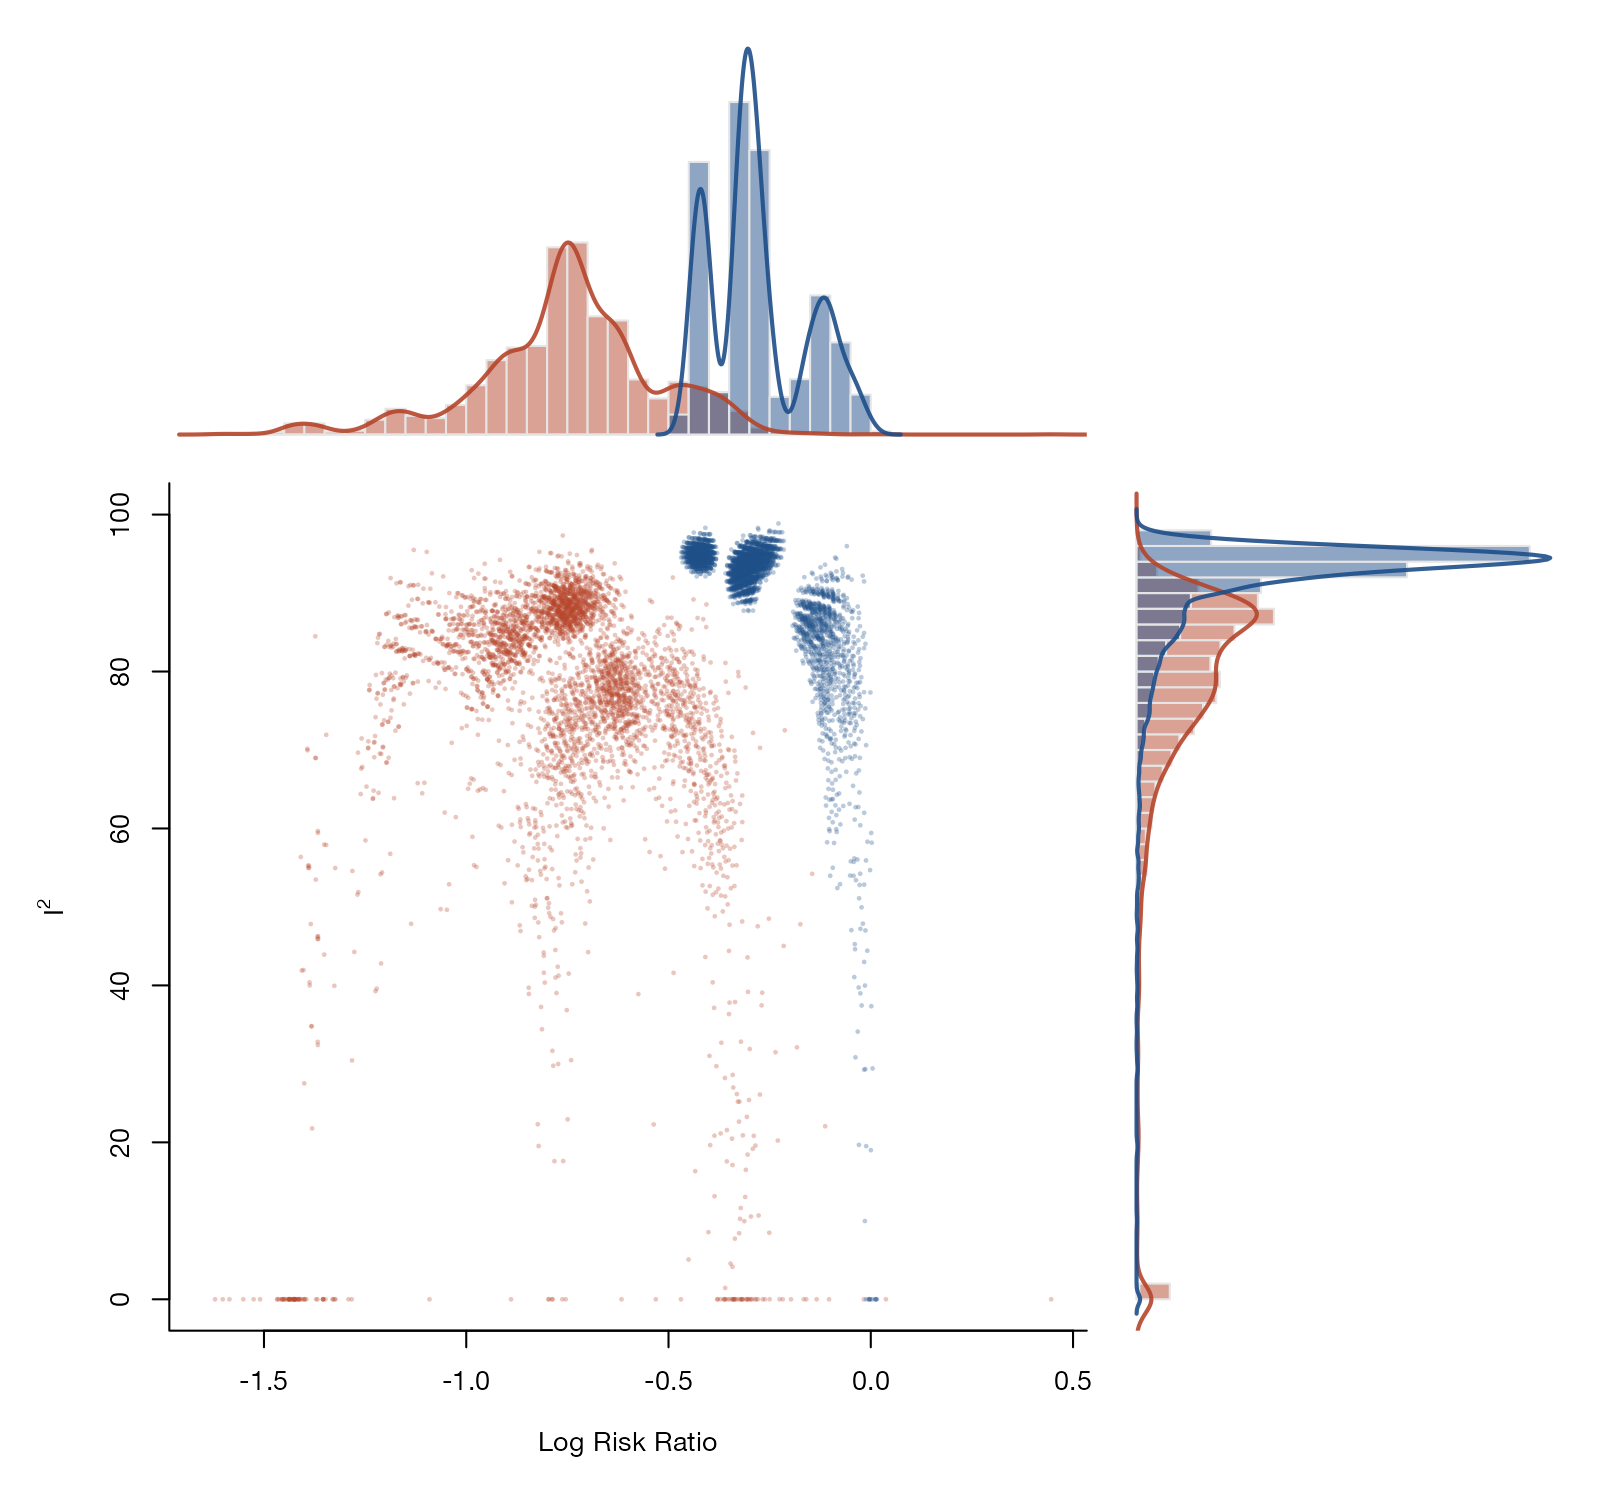
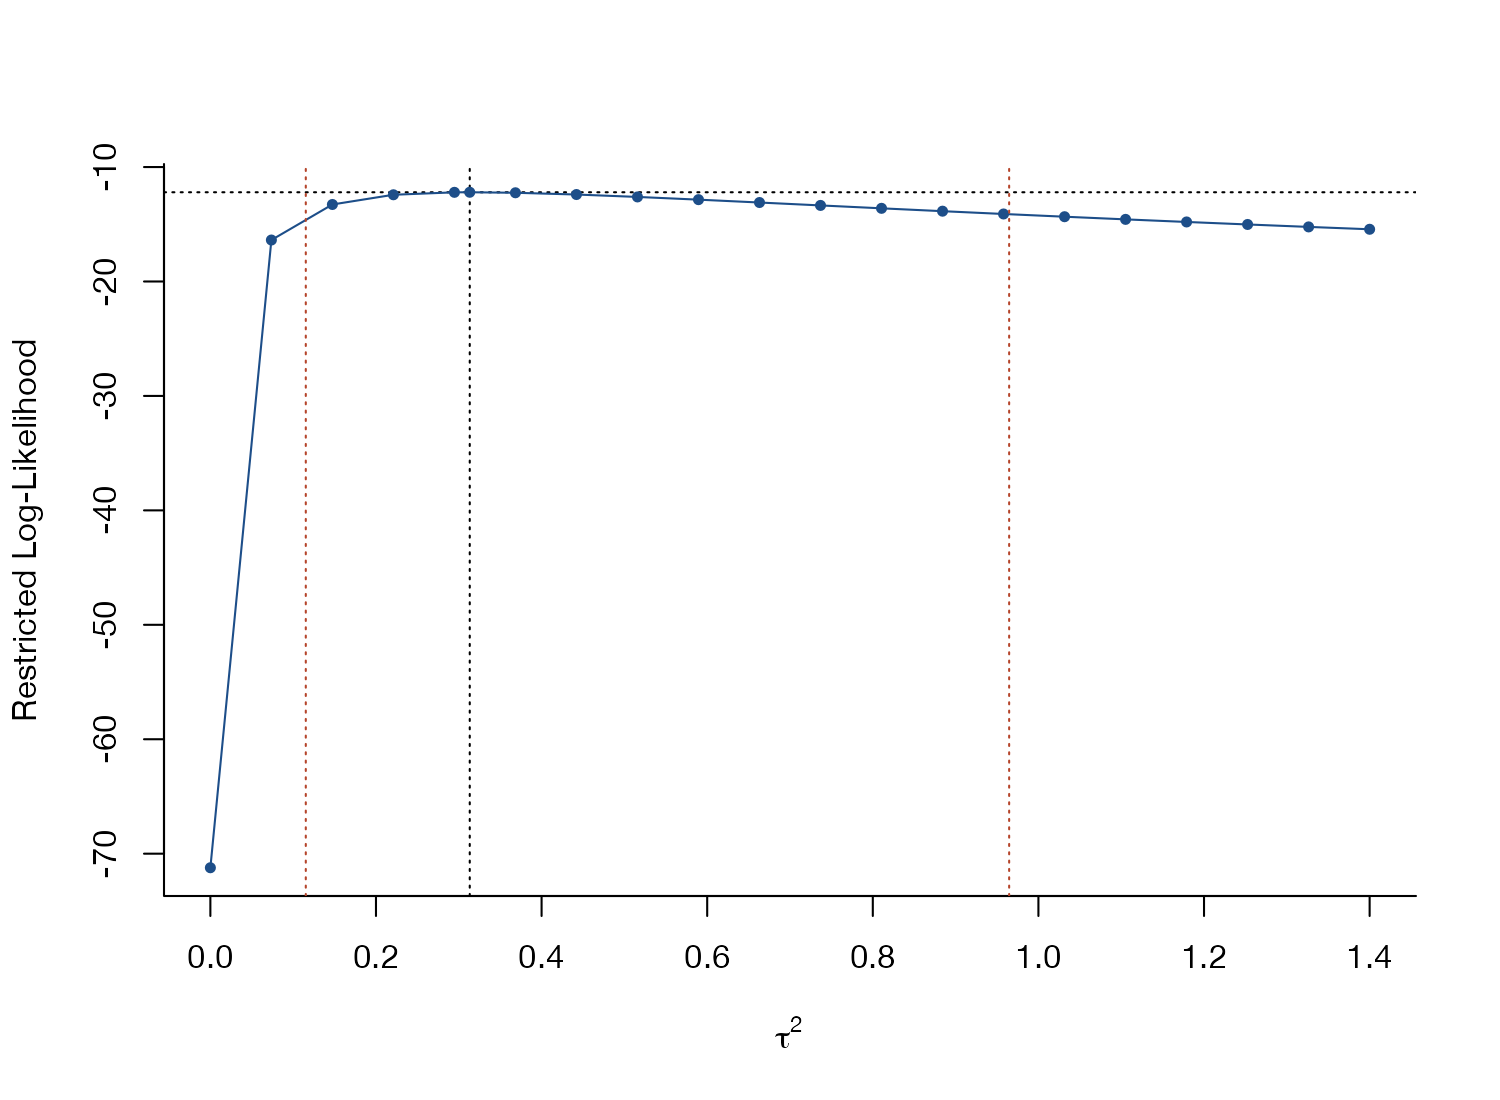
Heterogeneity and influence
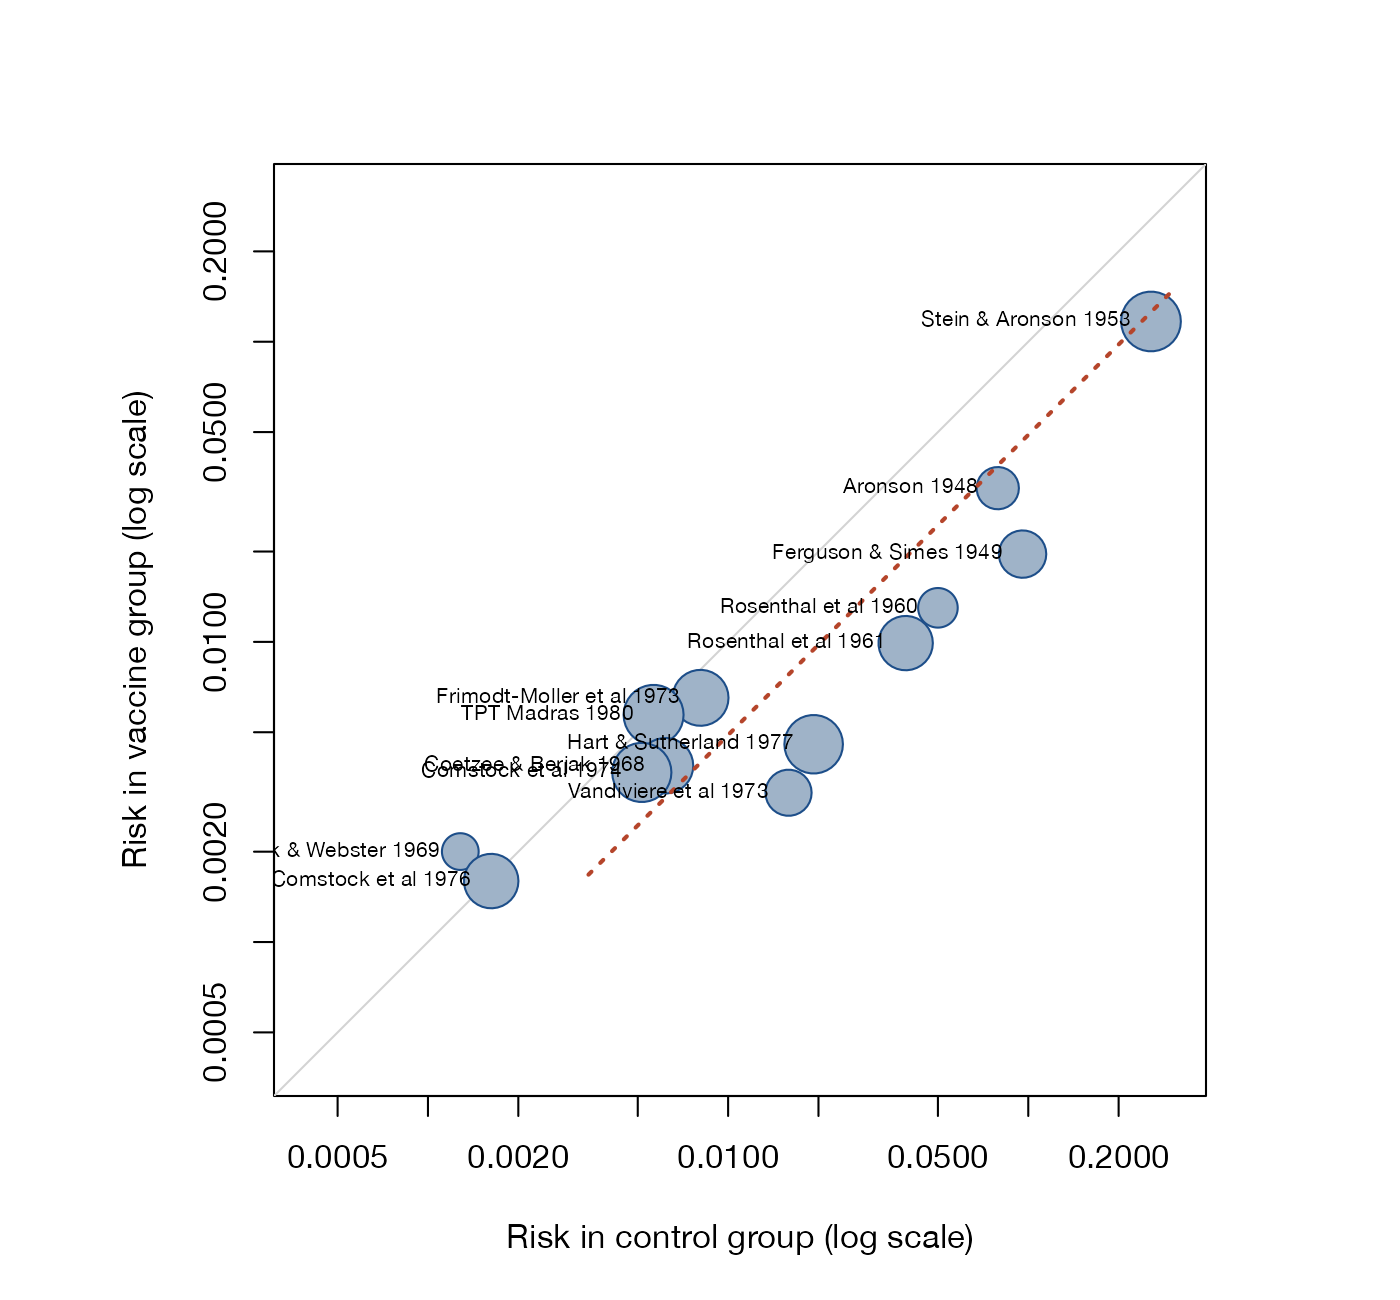
Where between-study variation comes from, and which studies move the pooled result.
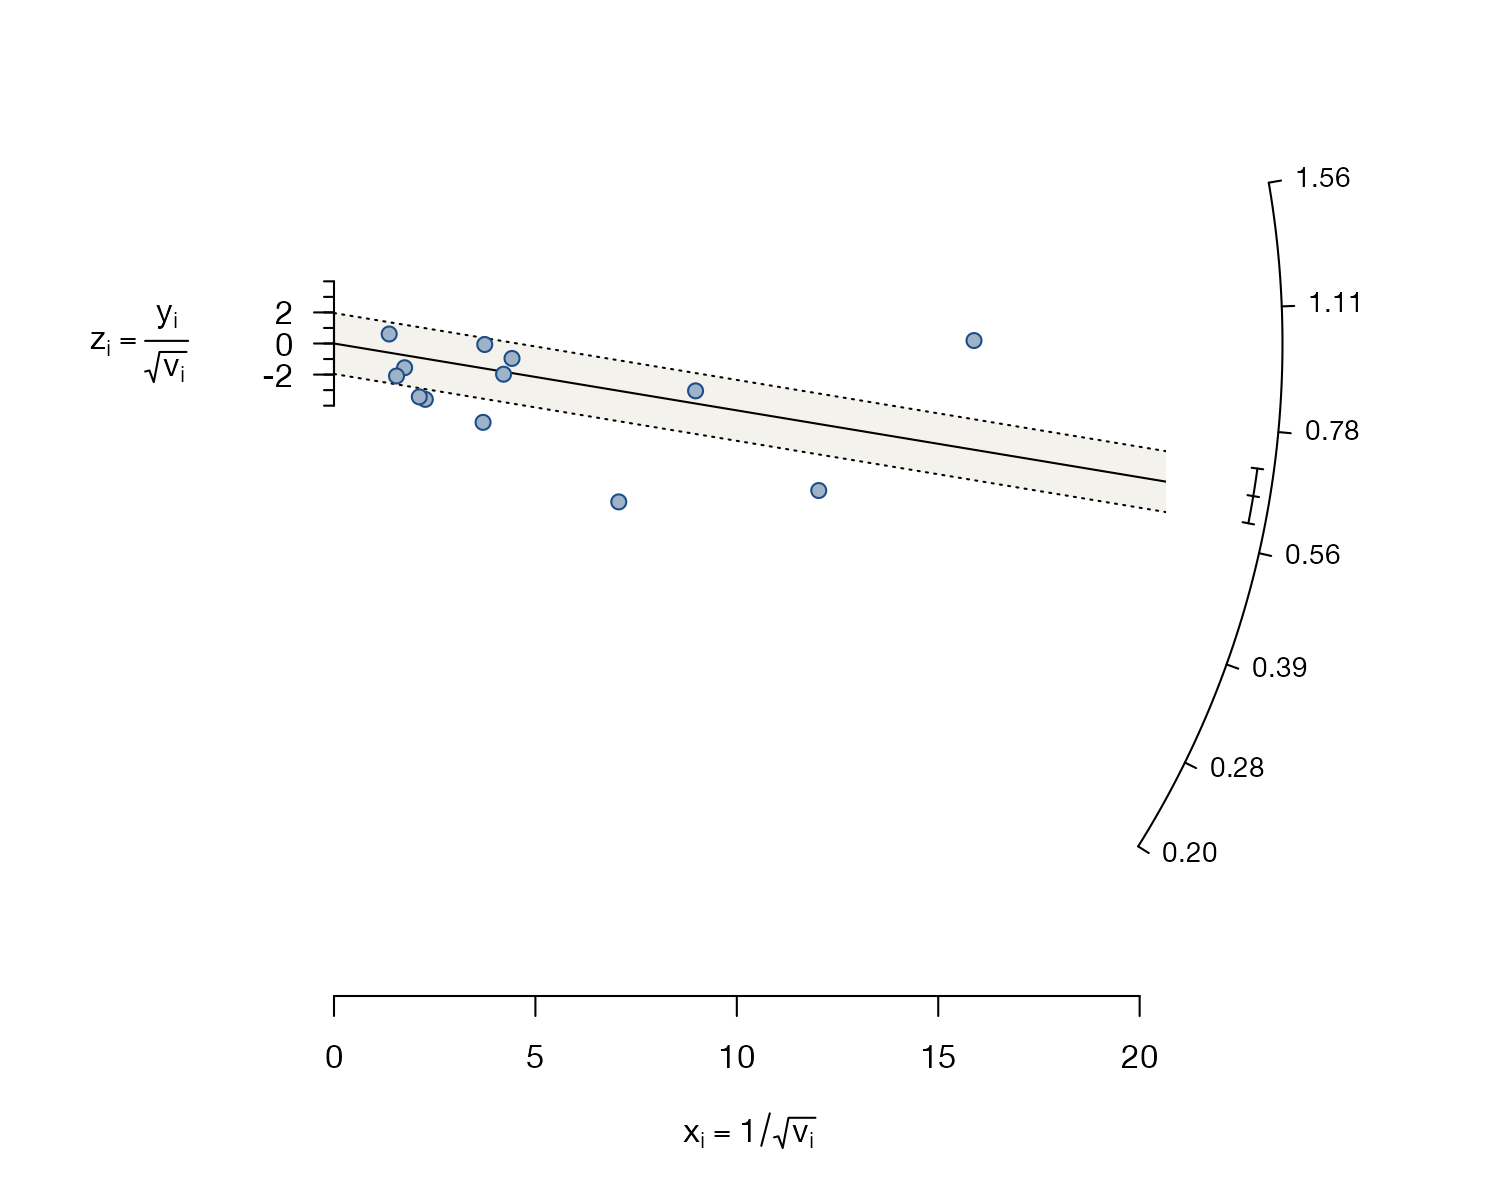
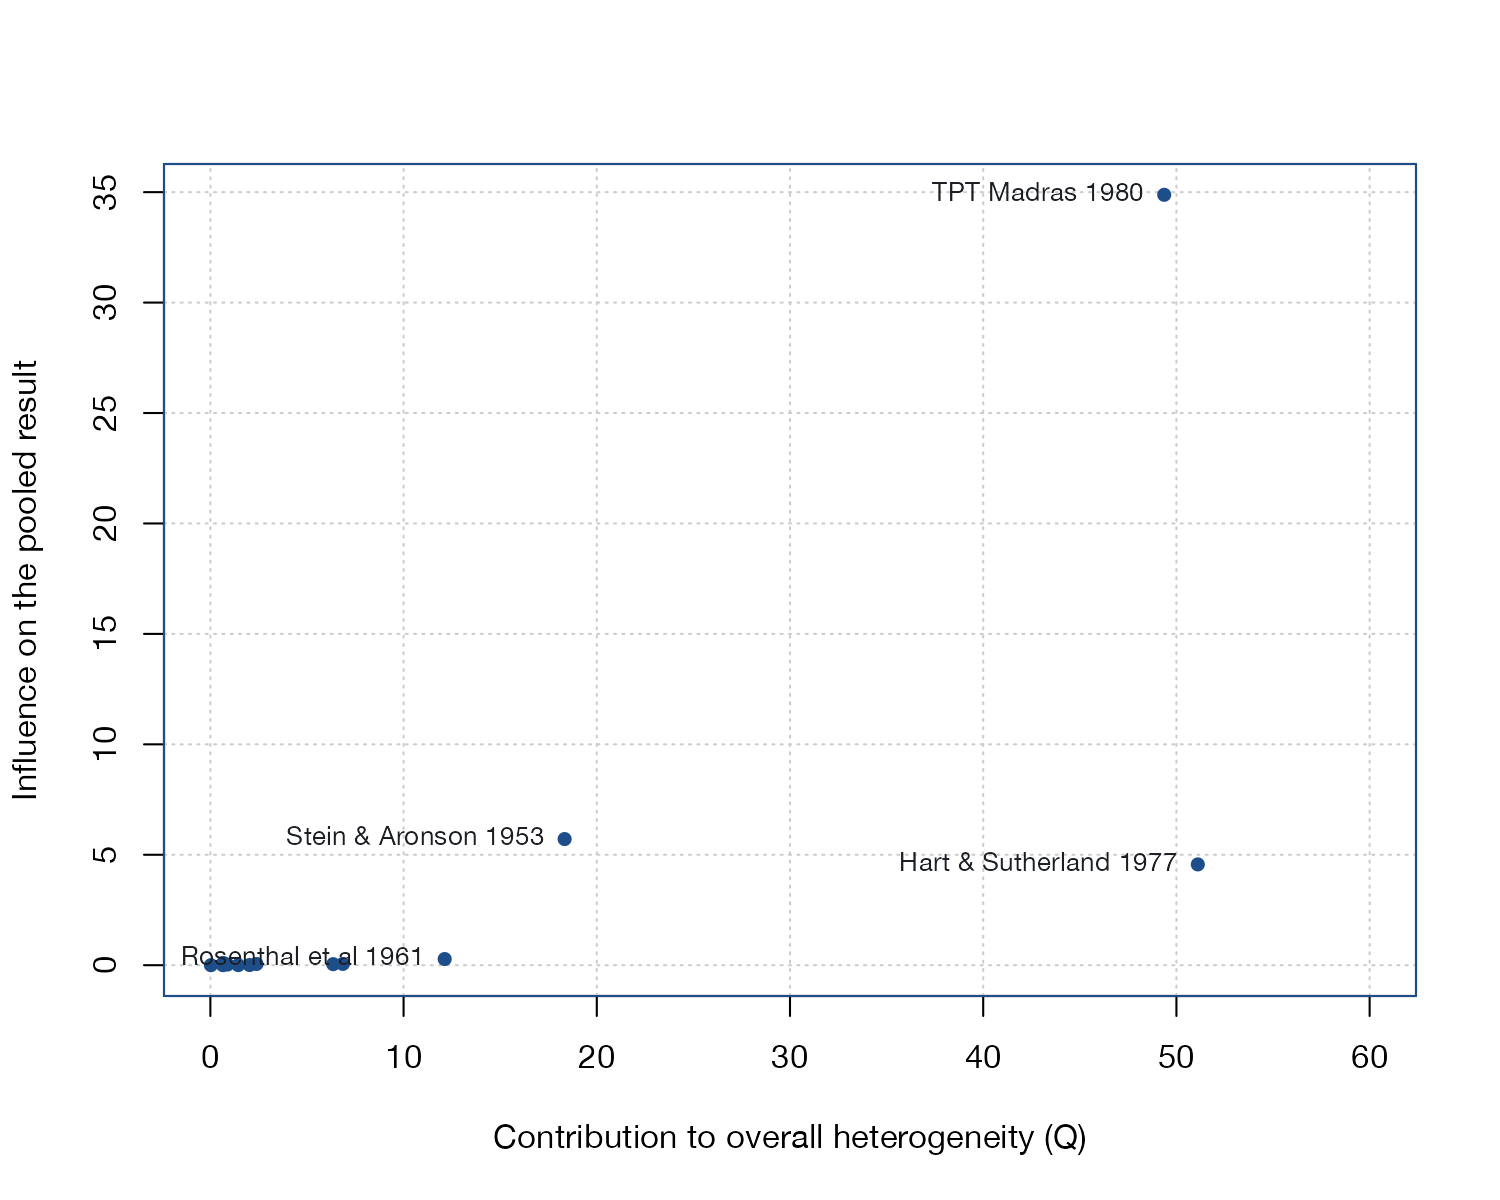
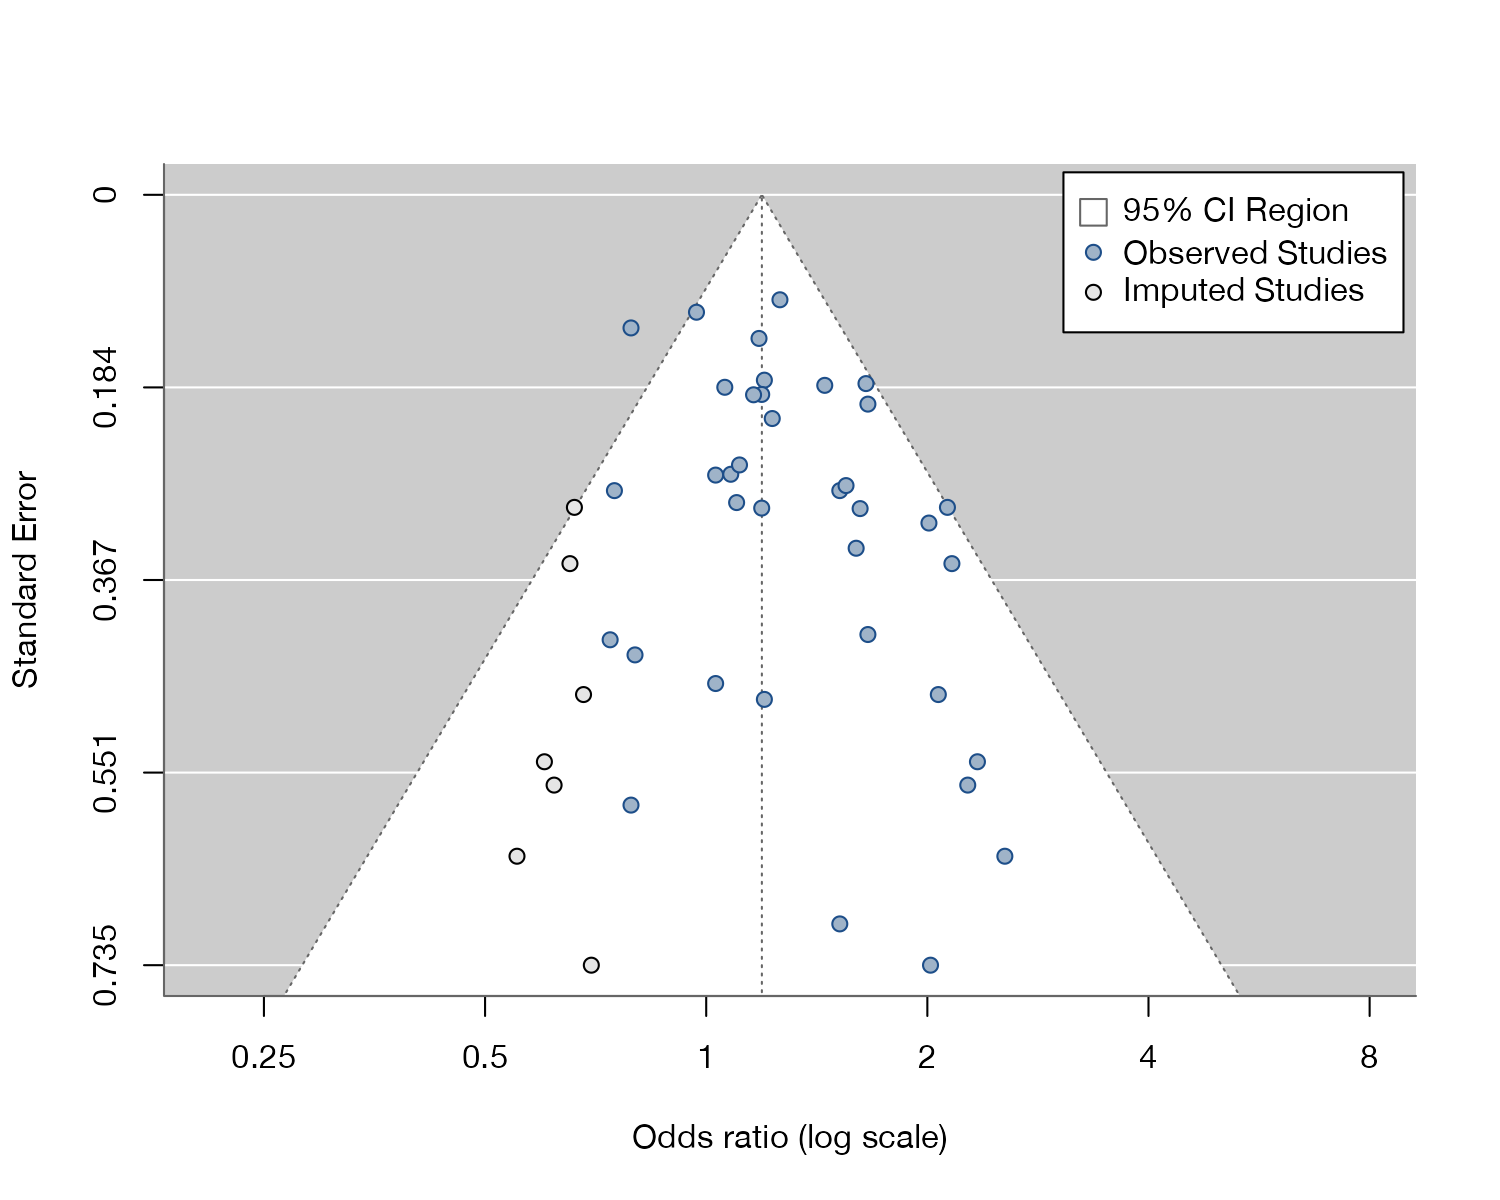
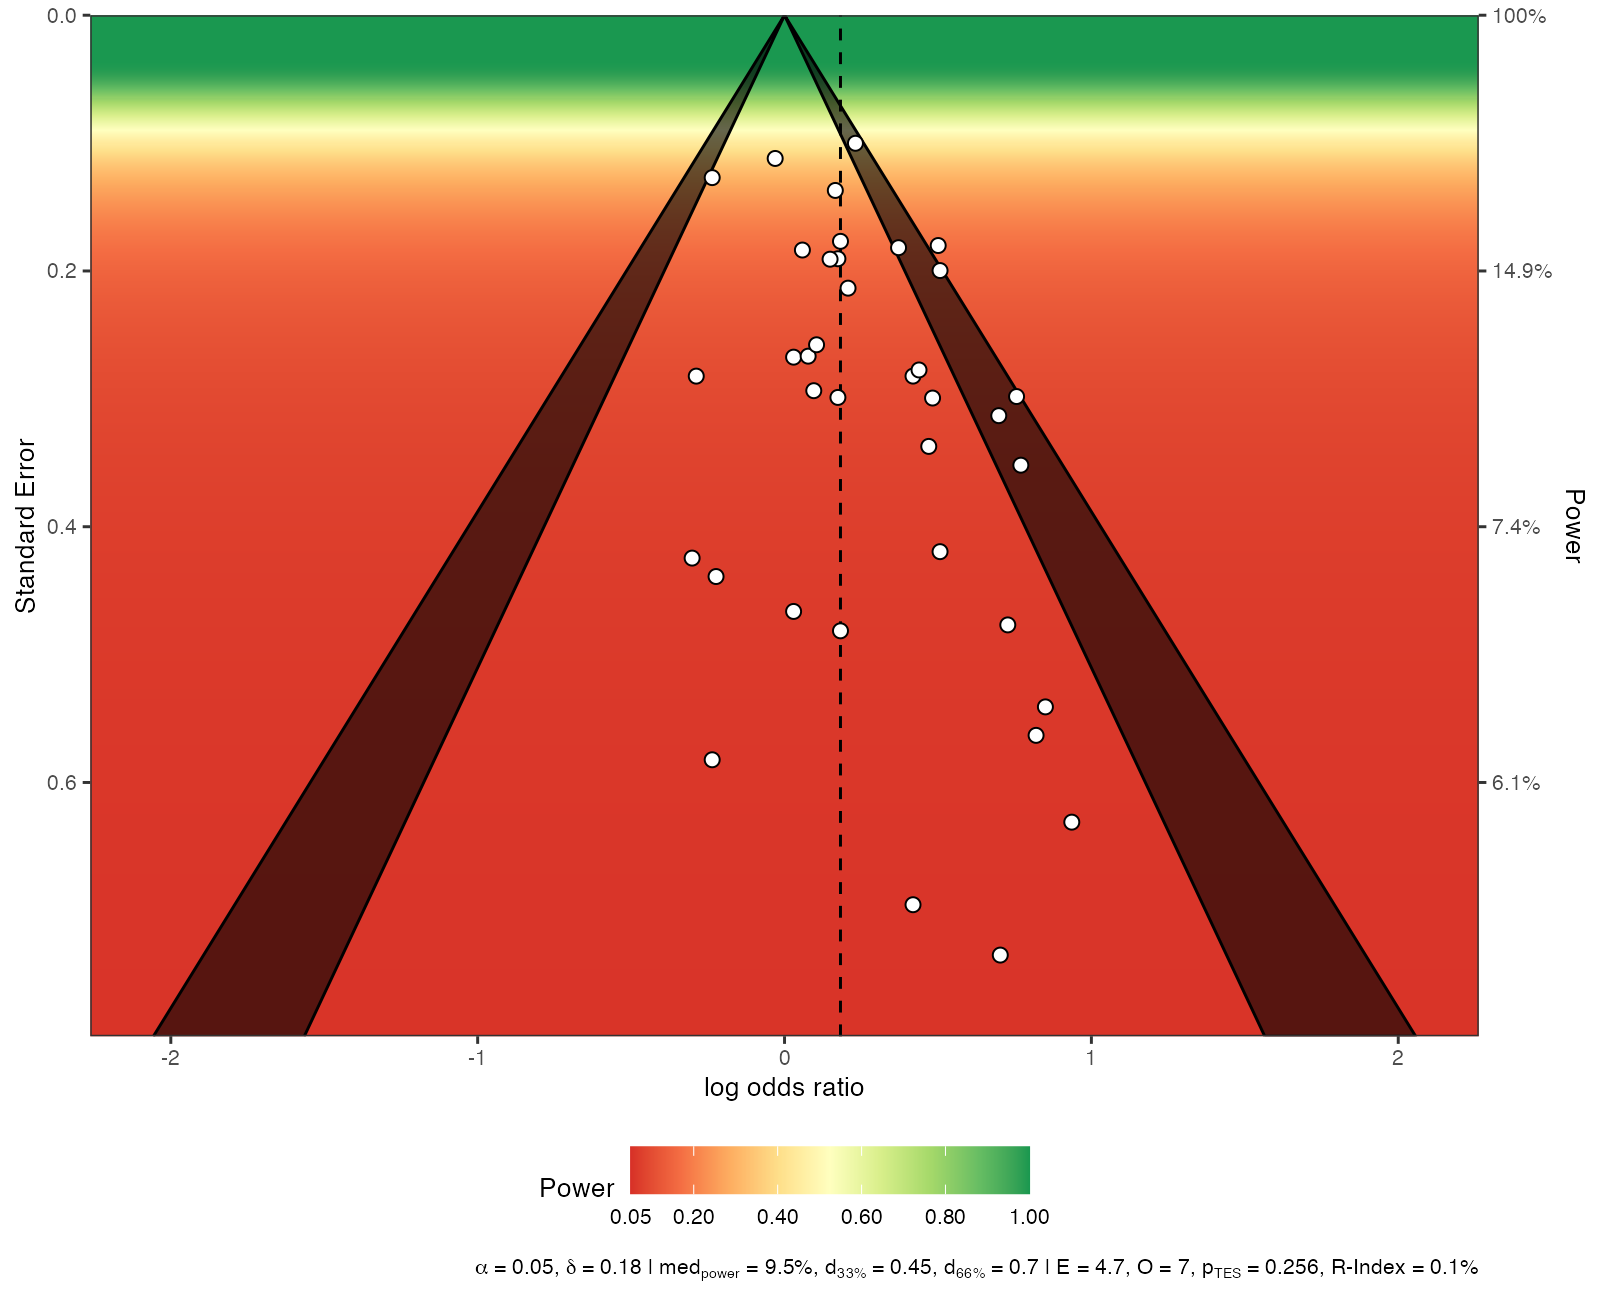
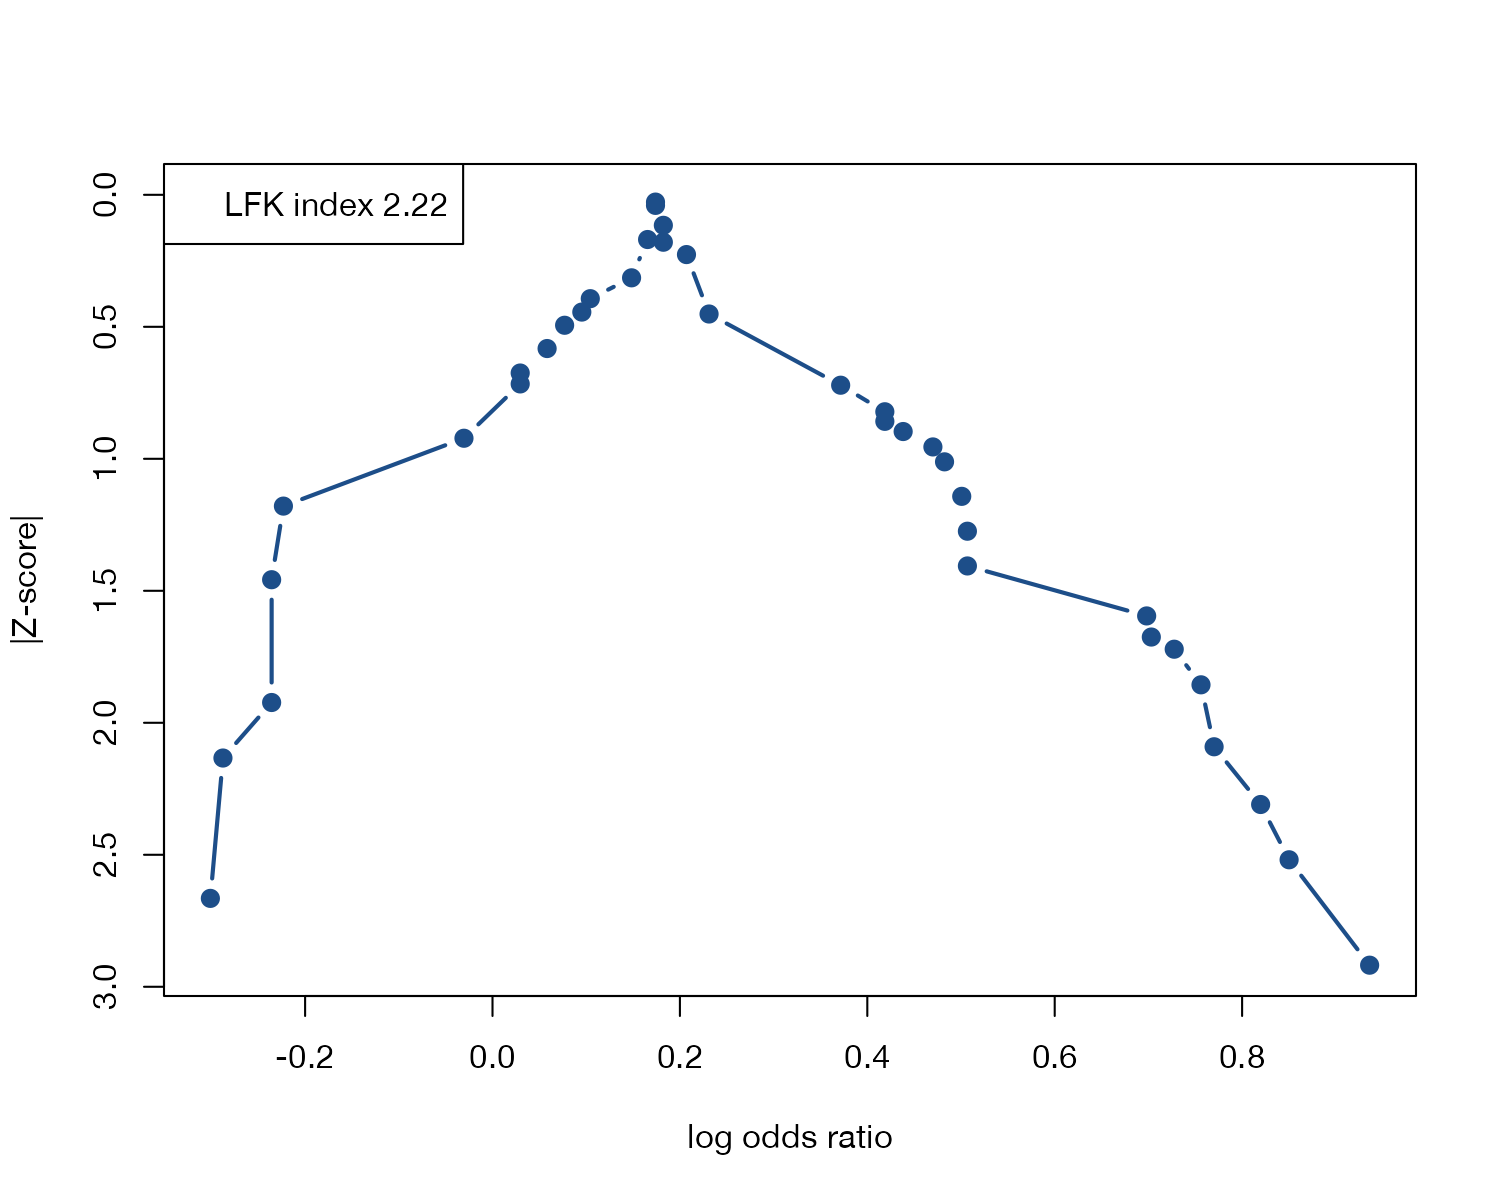
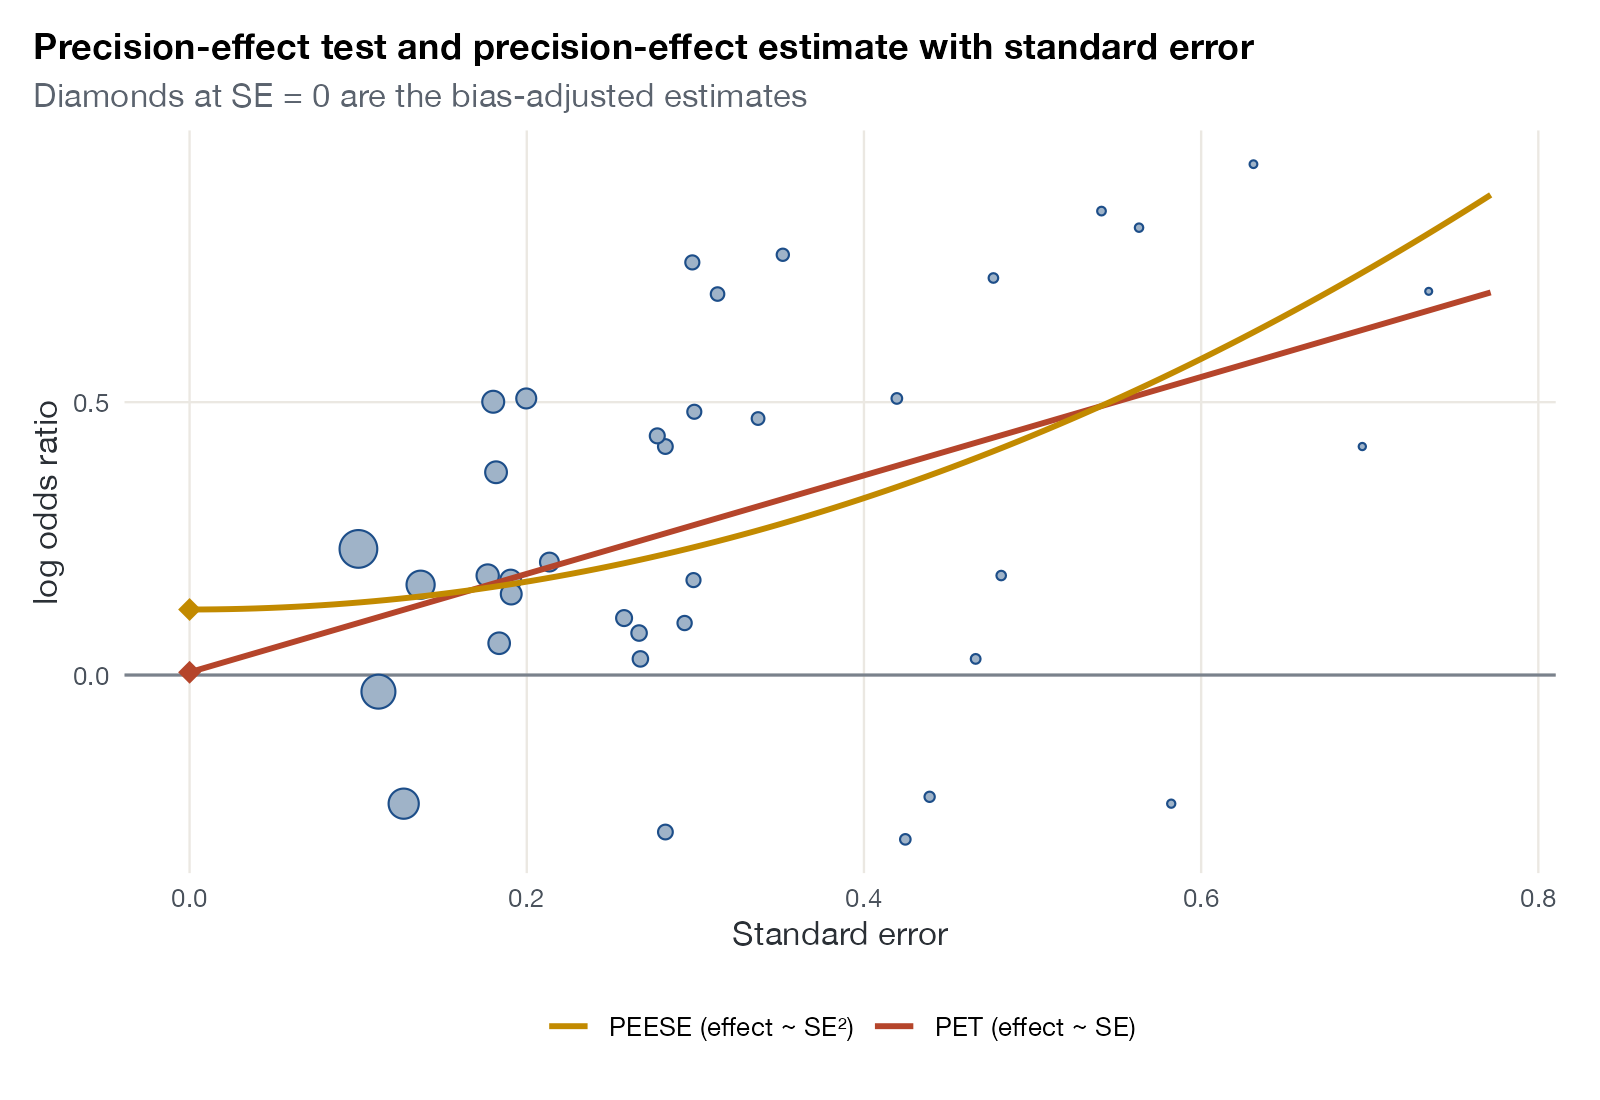
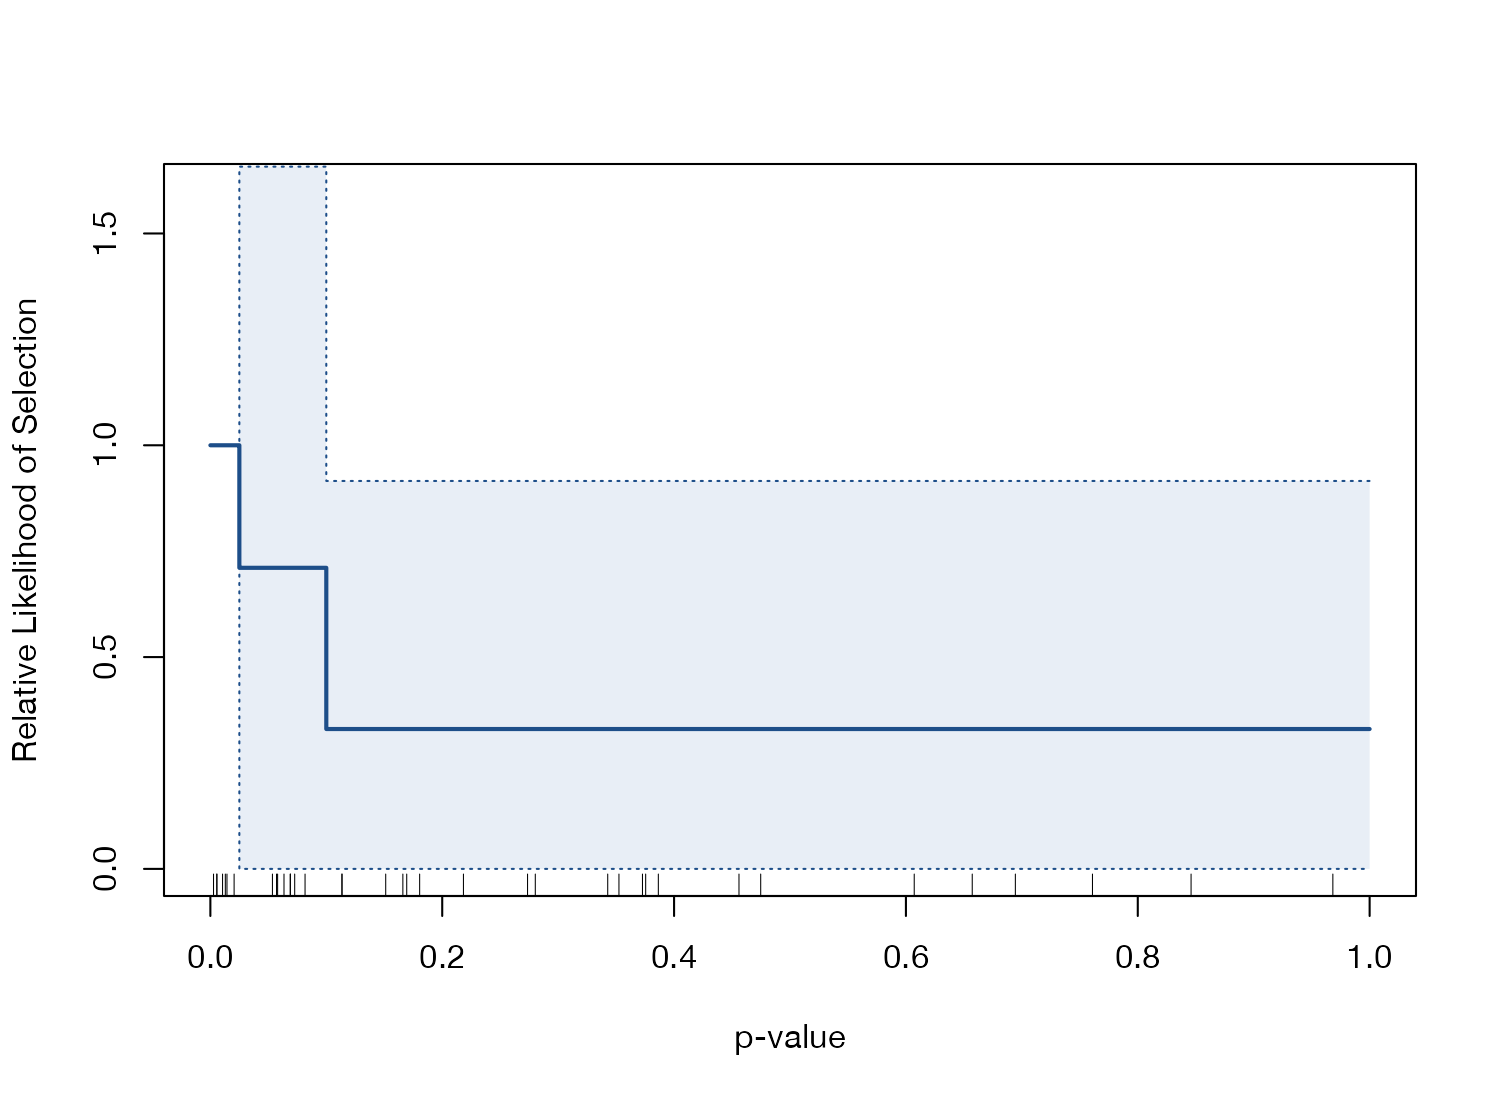
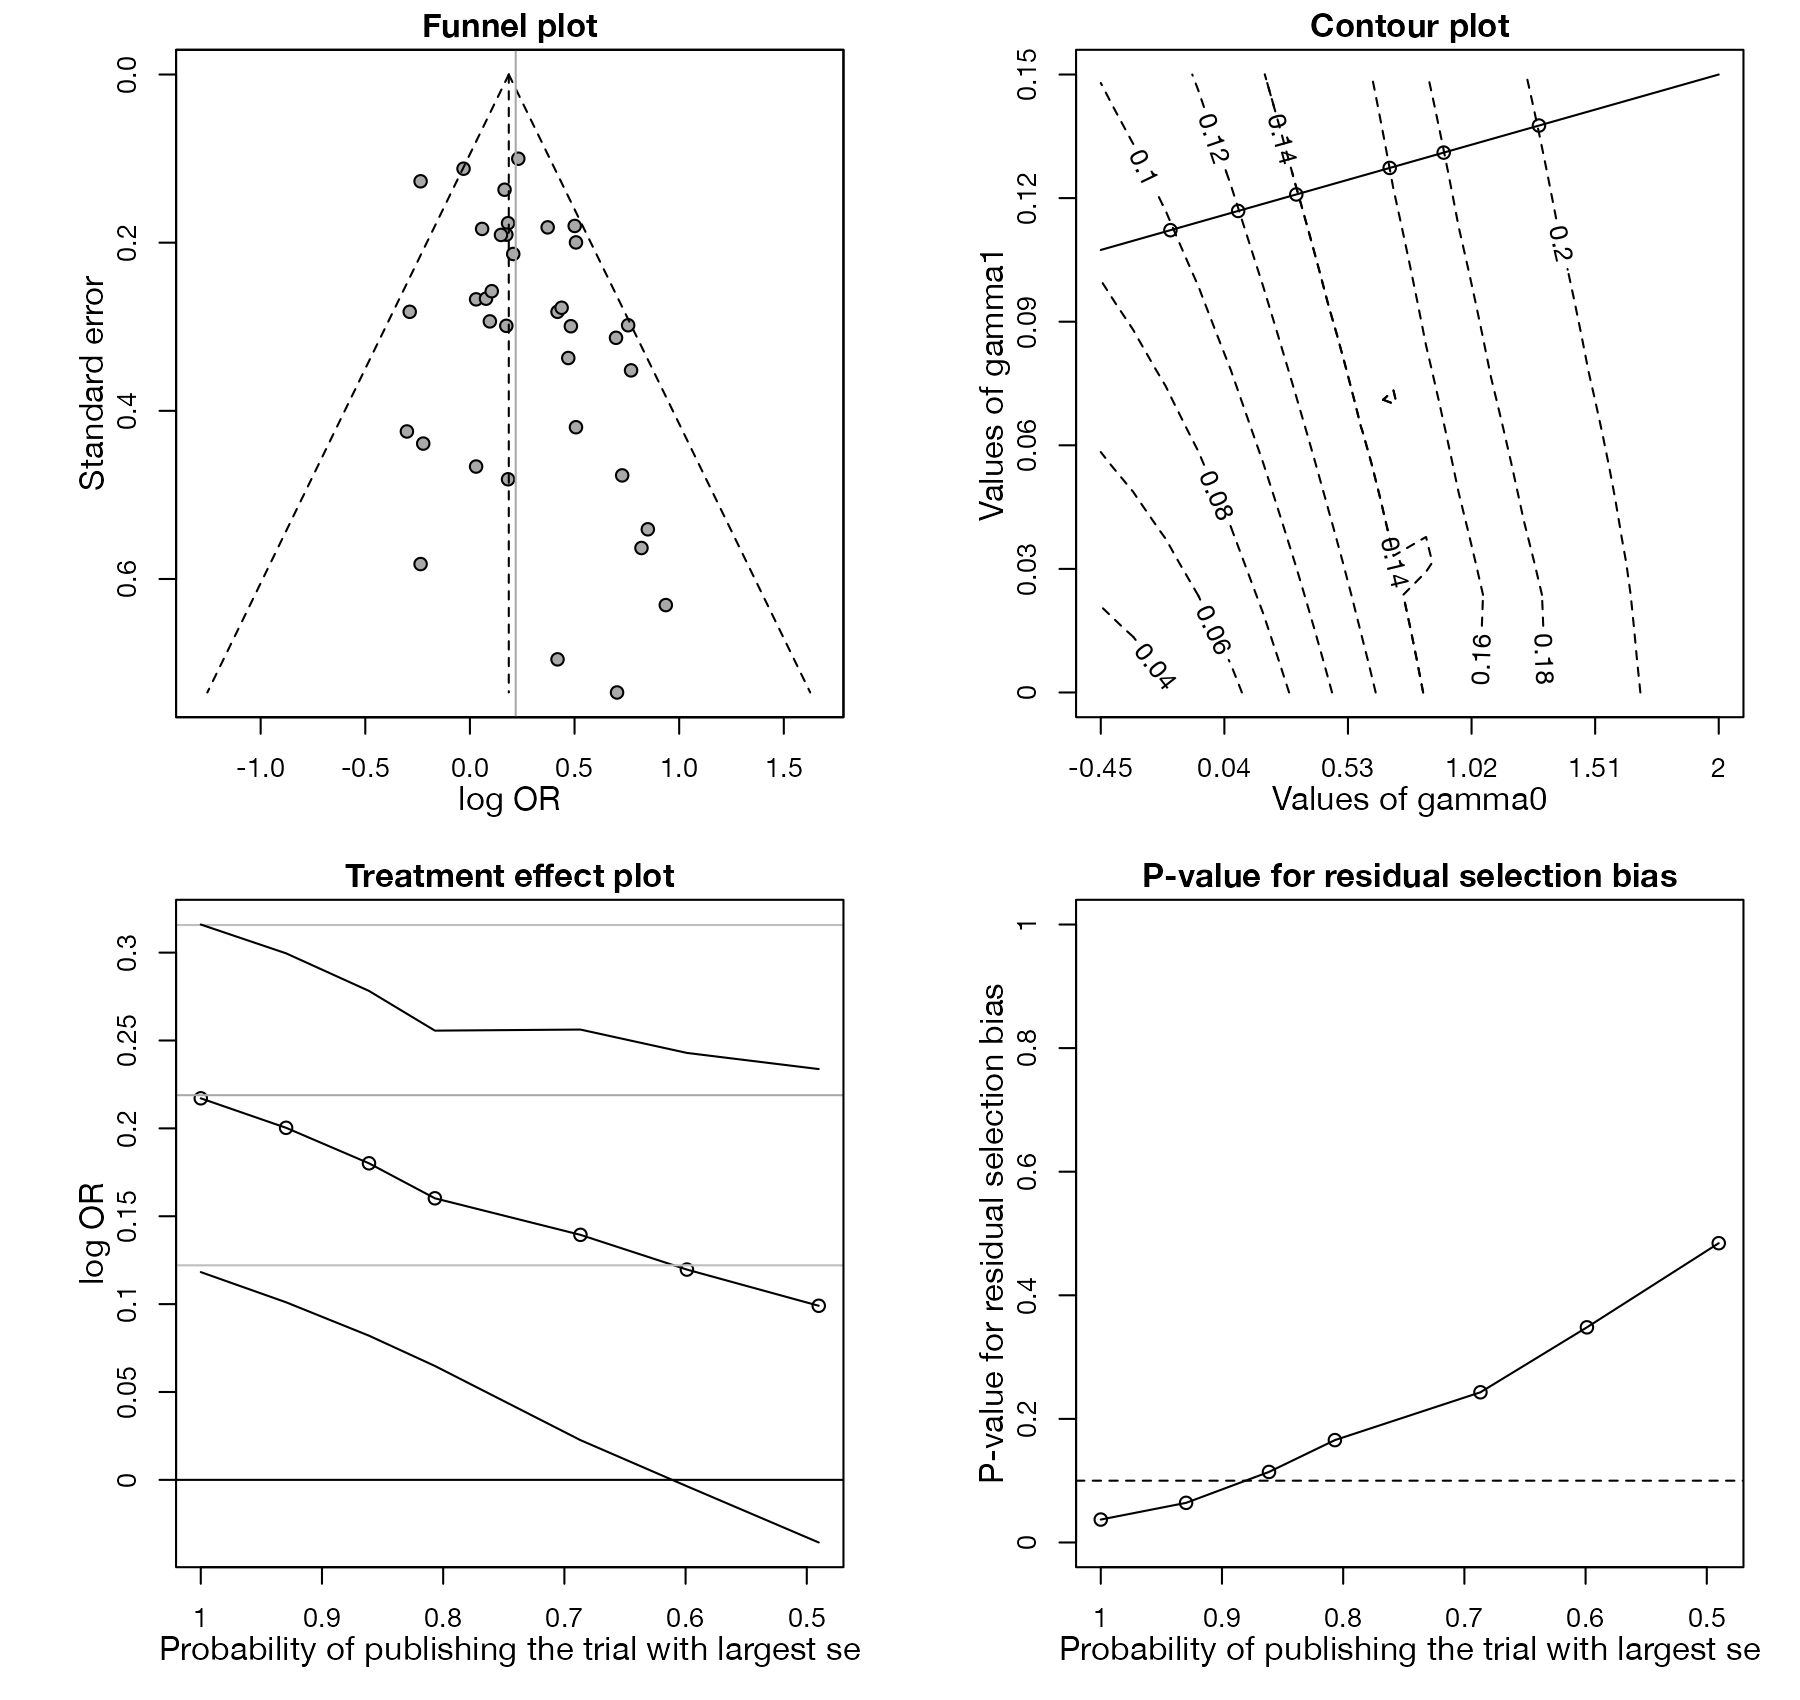
Small-study effects and reporting bias
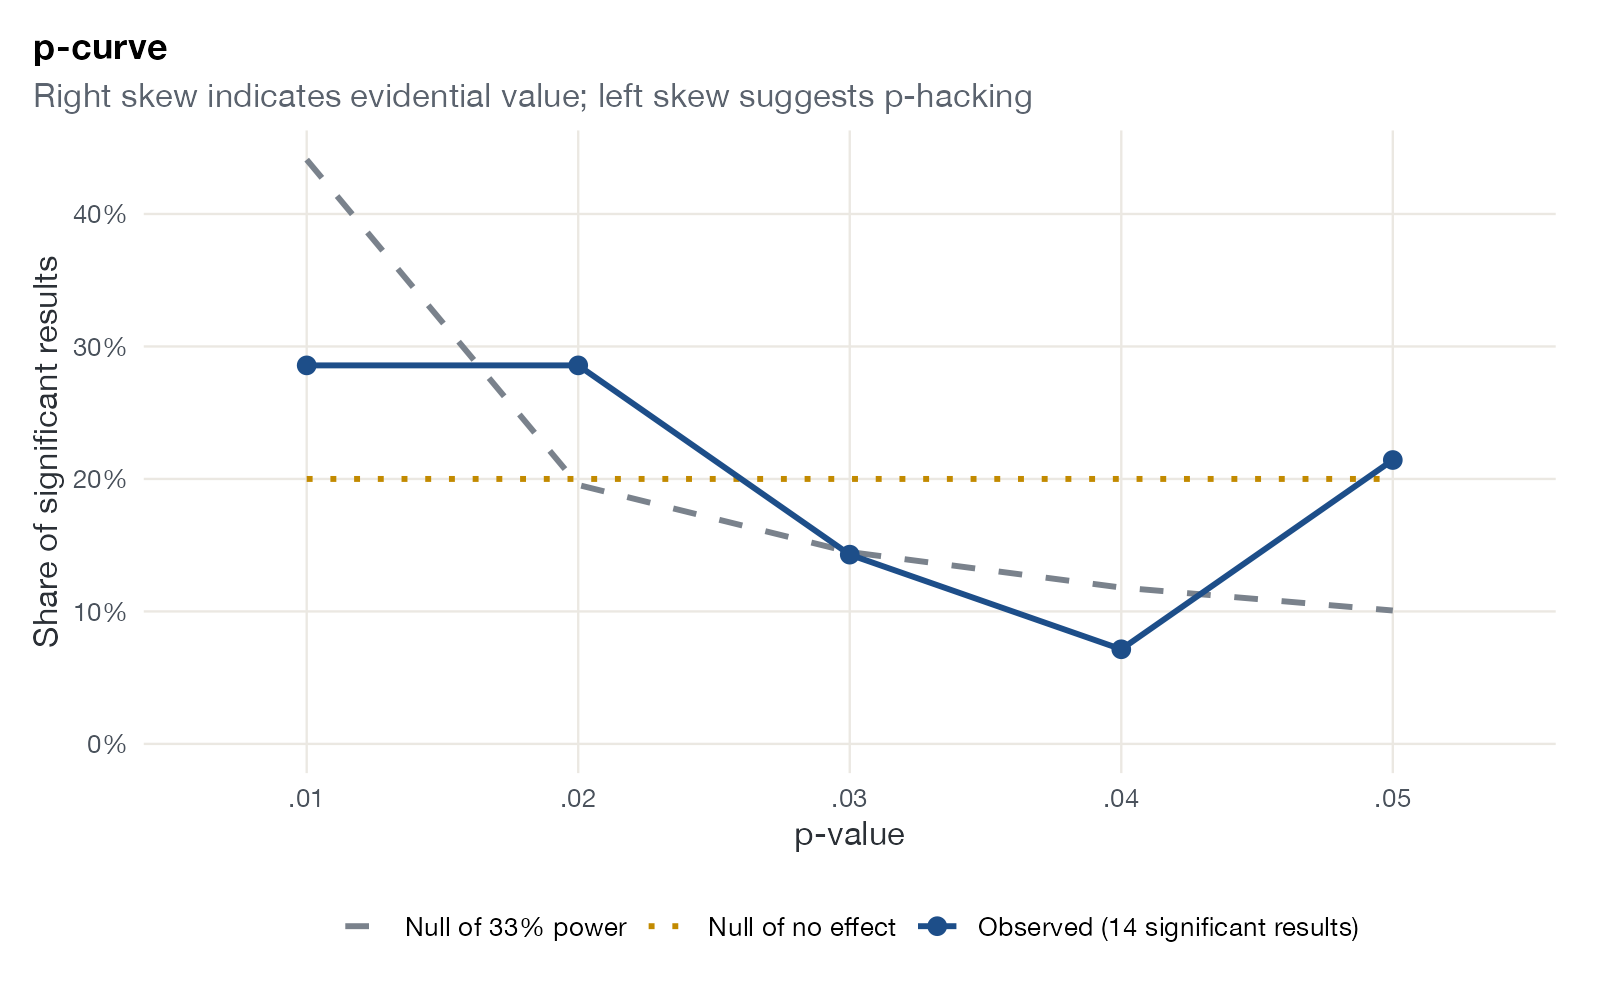
Funnel plots and their successors for exploring asymmetry, selective reporting, and sensitivity to it.
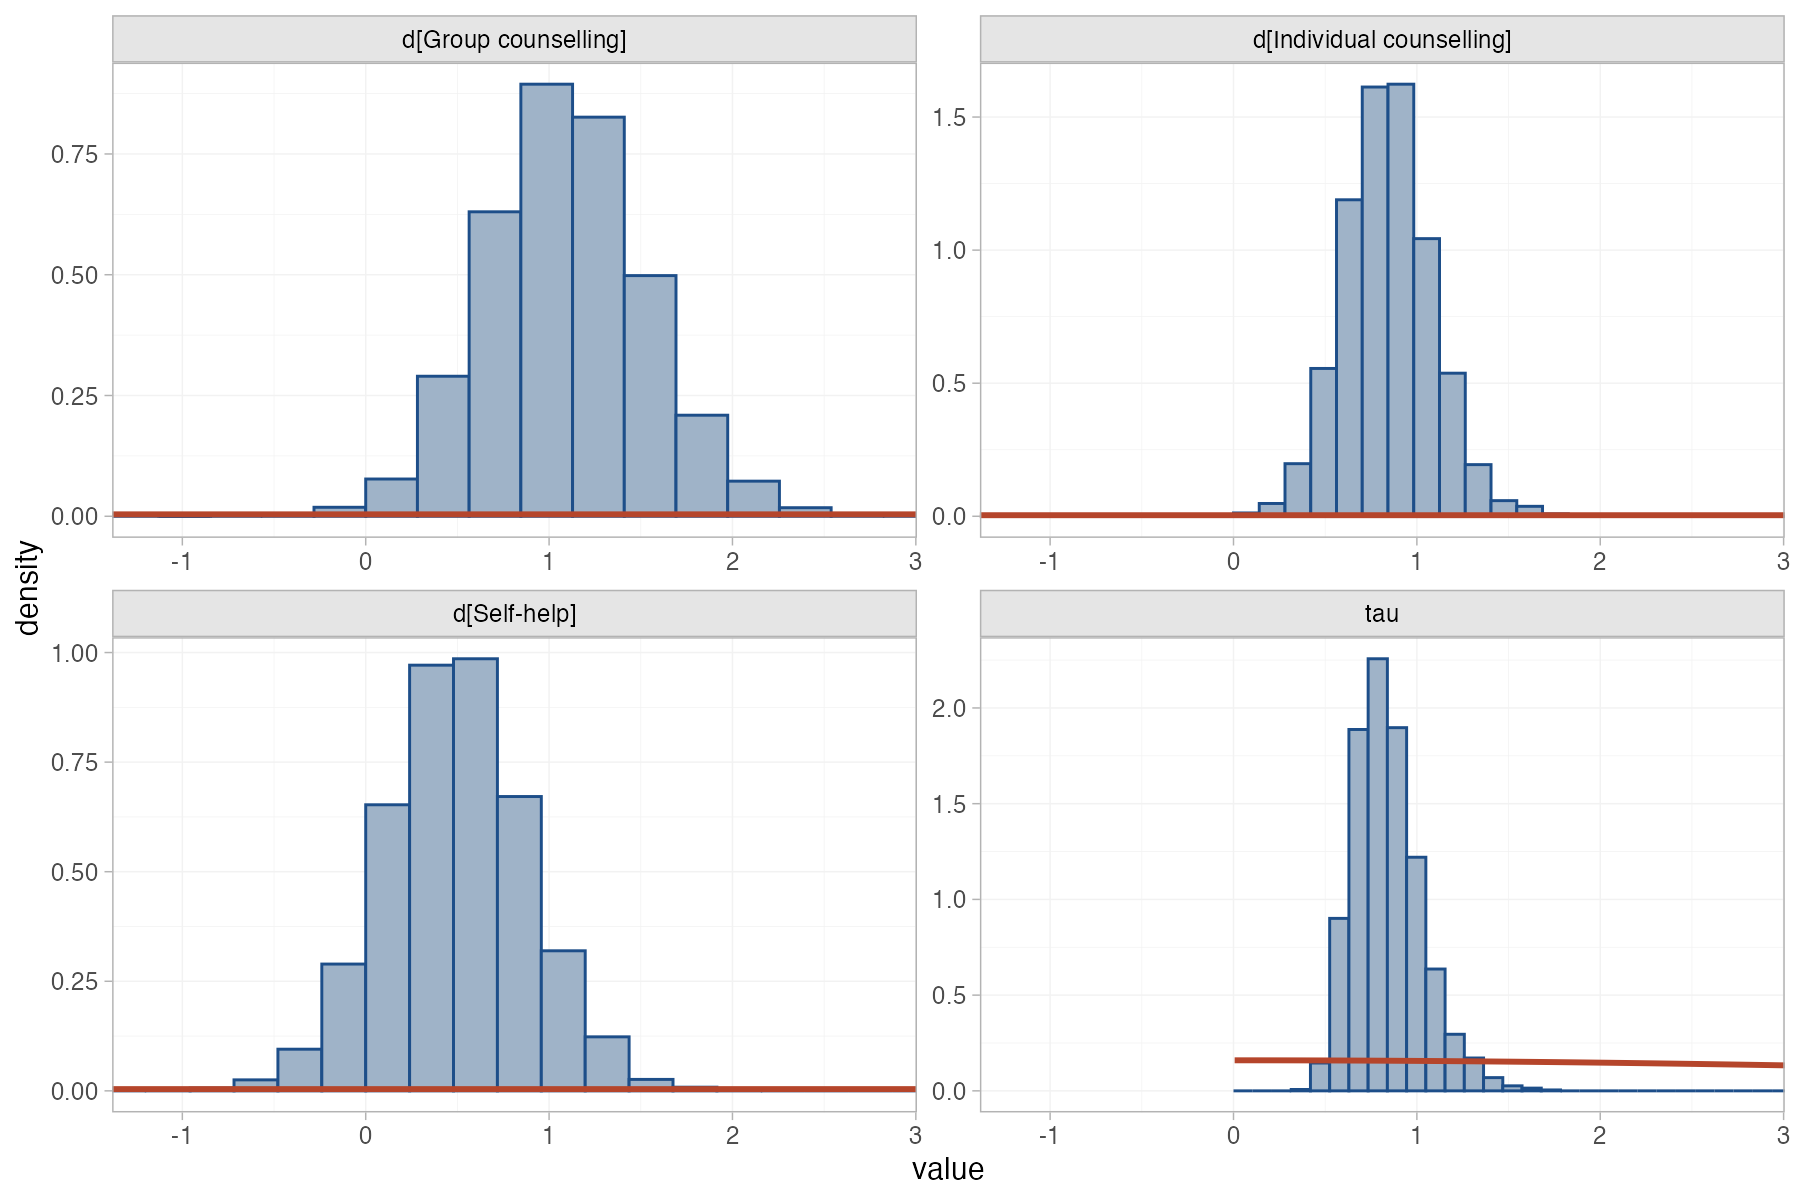
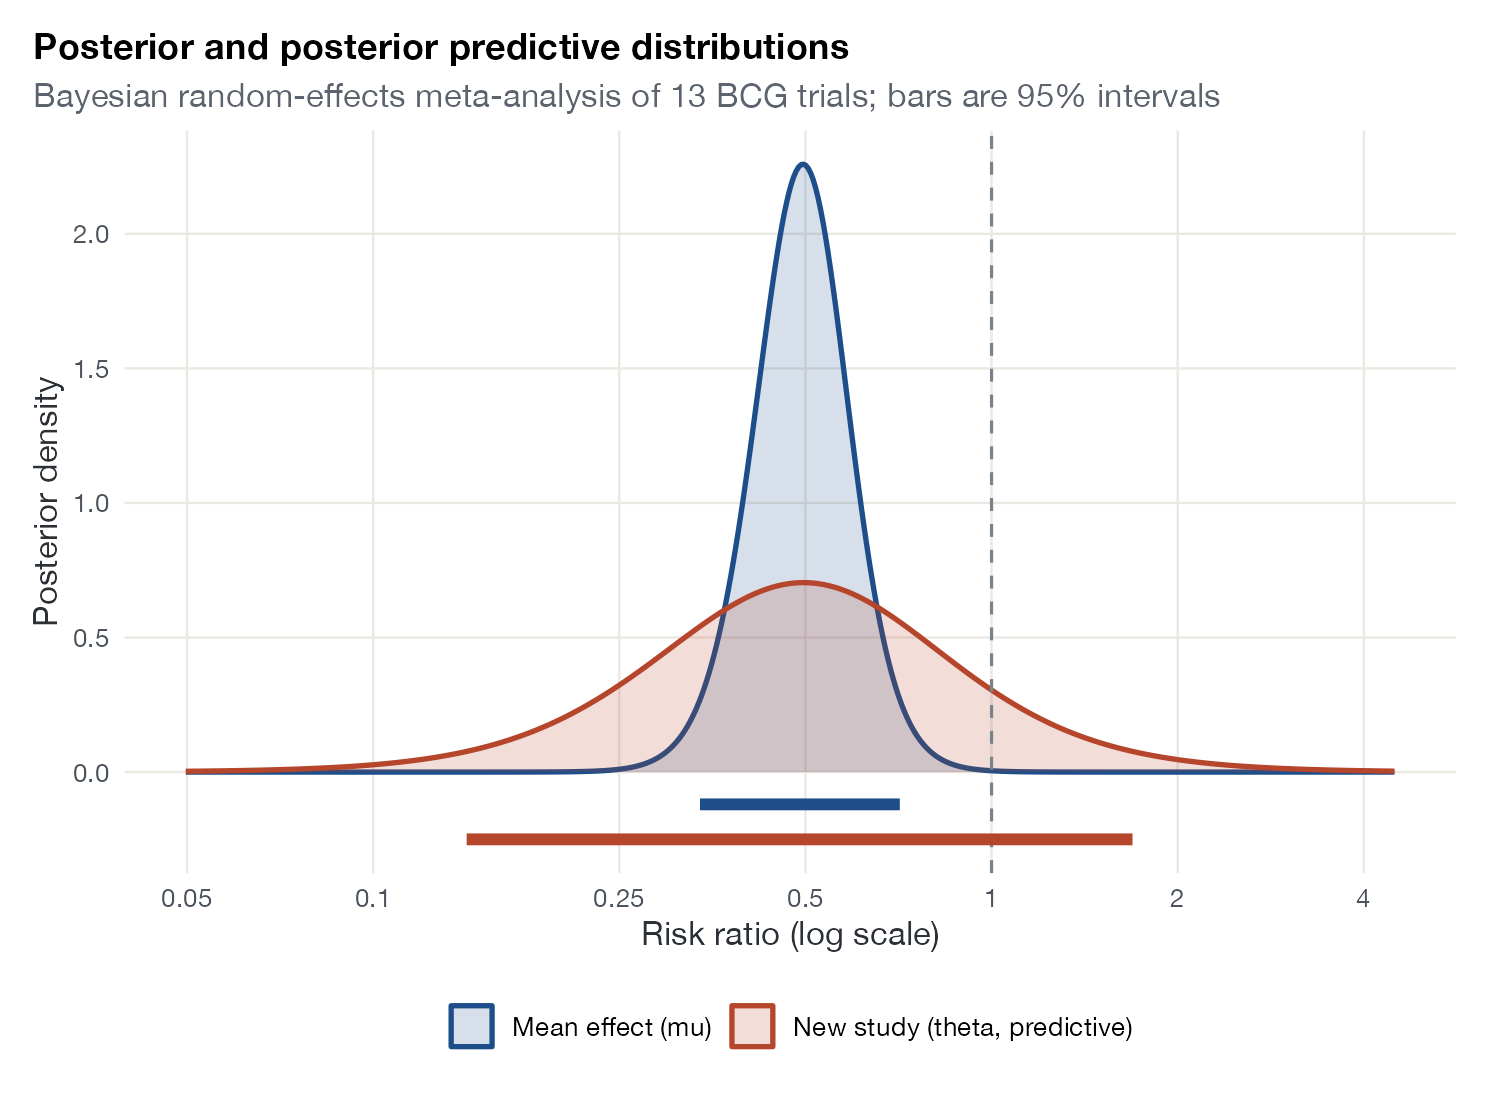
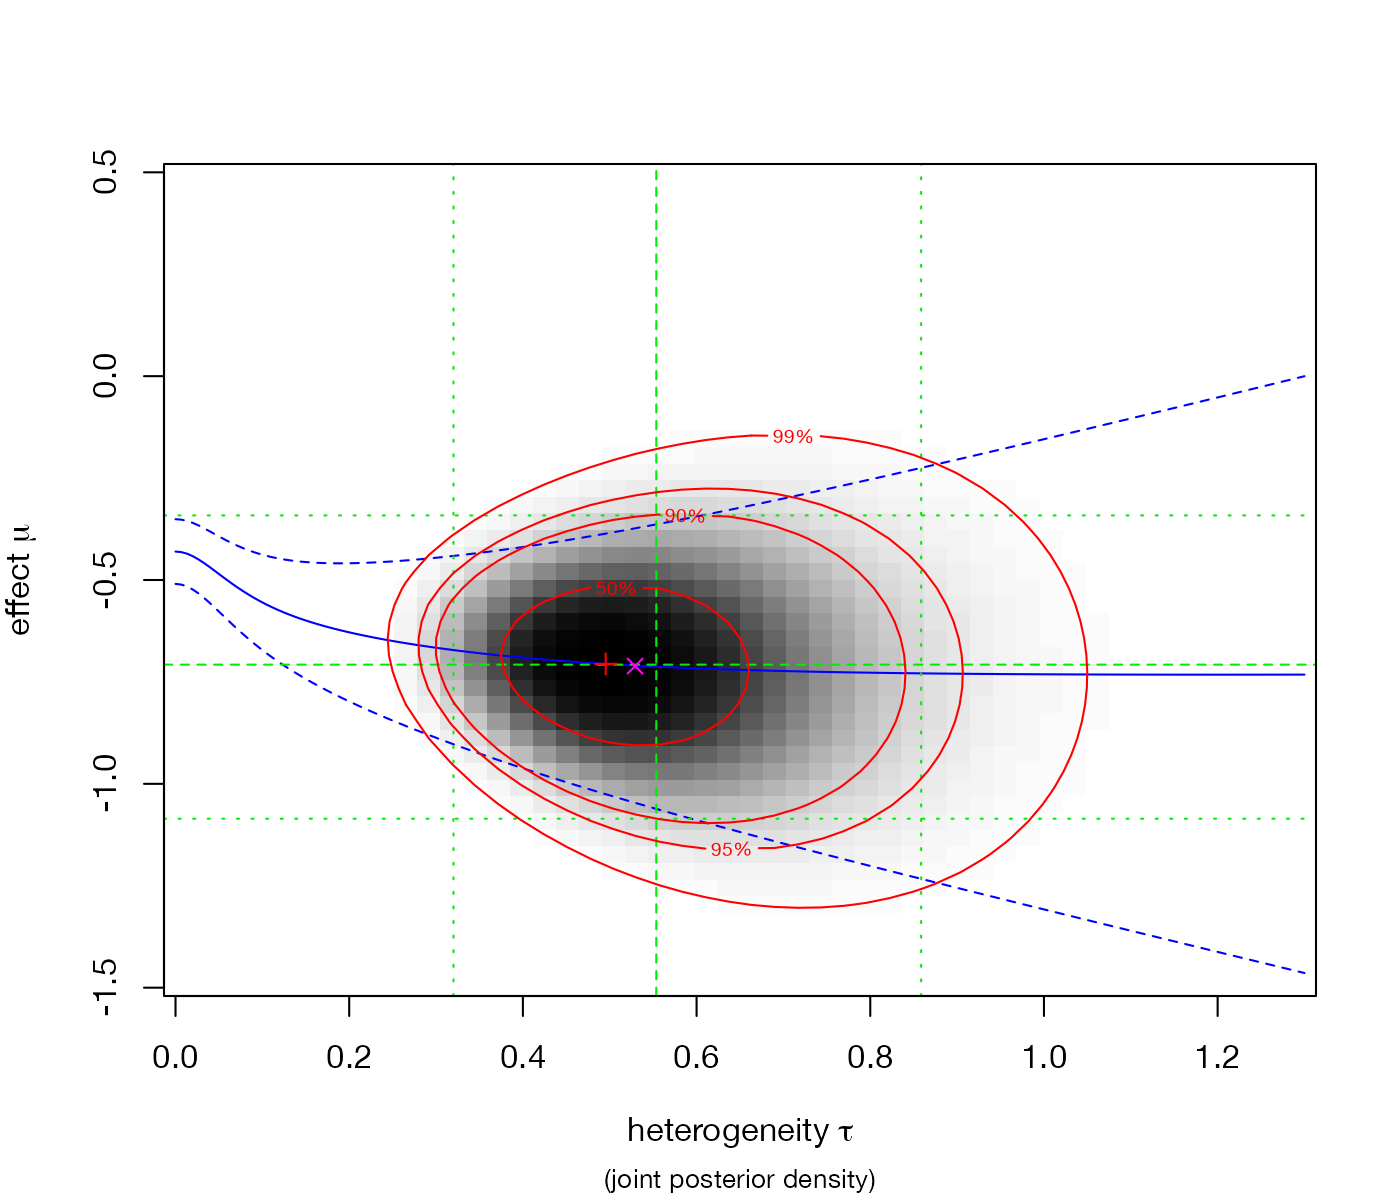
Model checking and Bayesian diagnostics
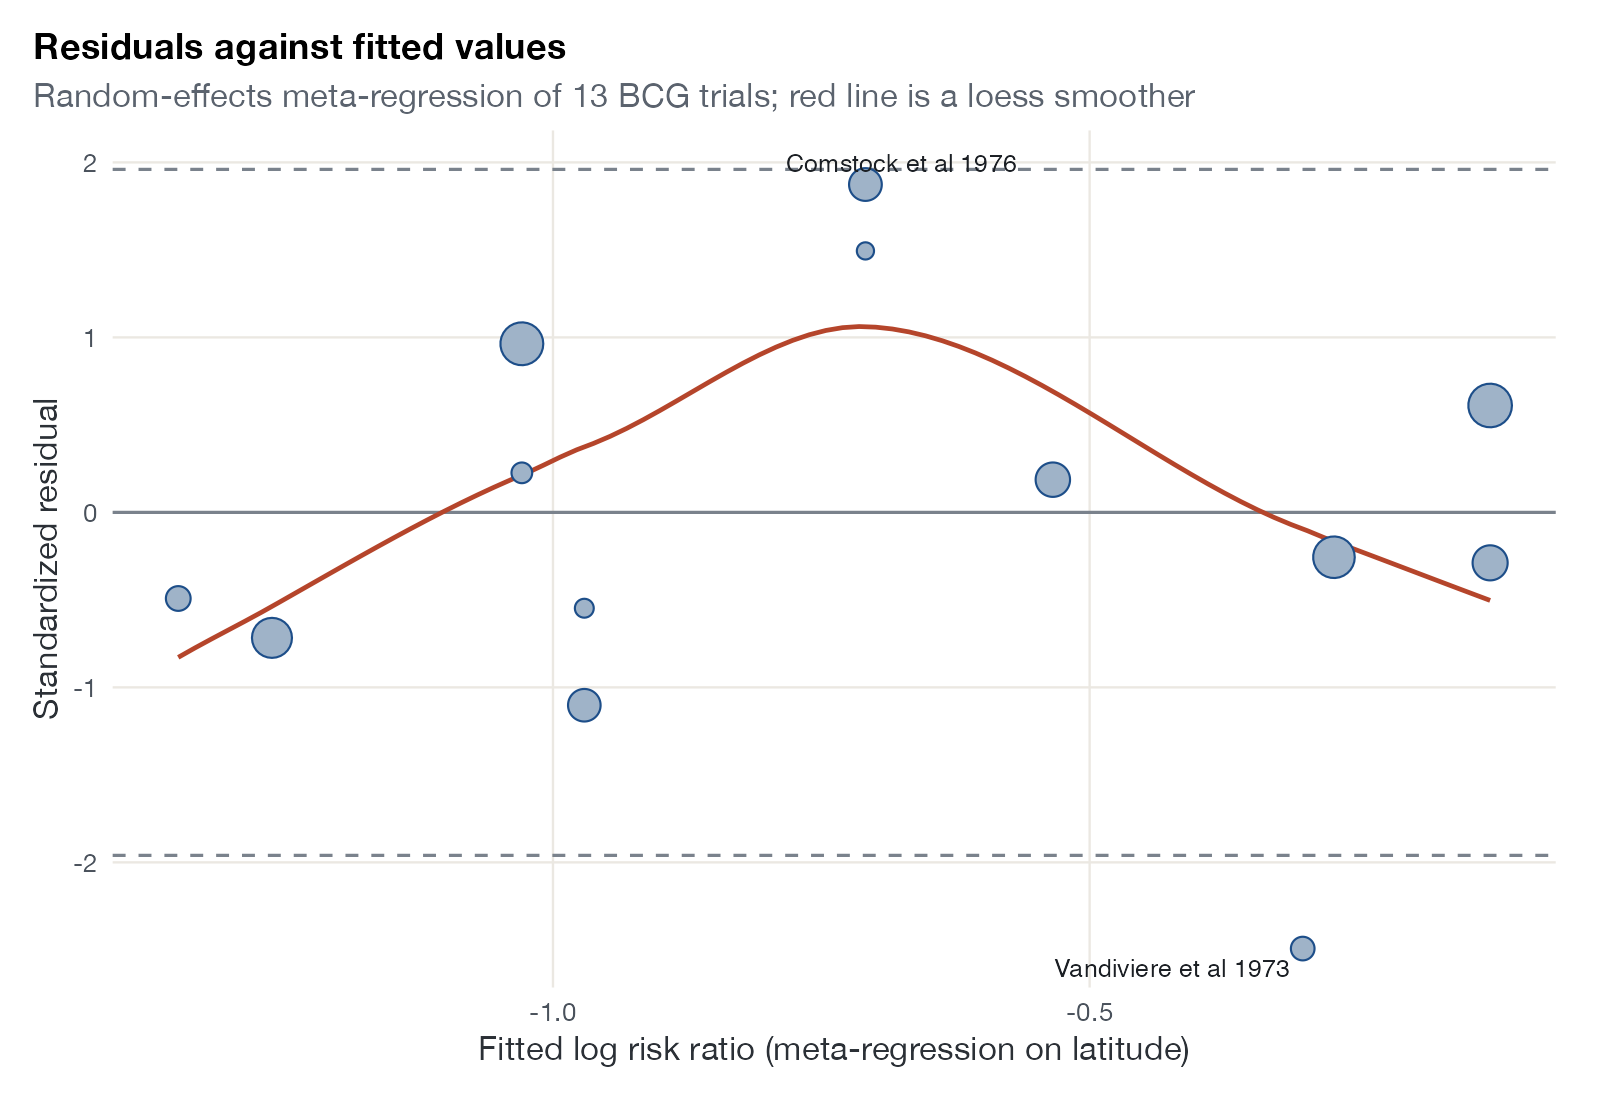
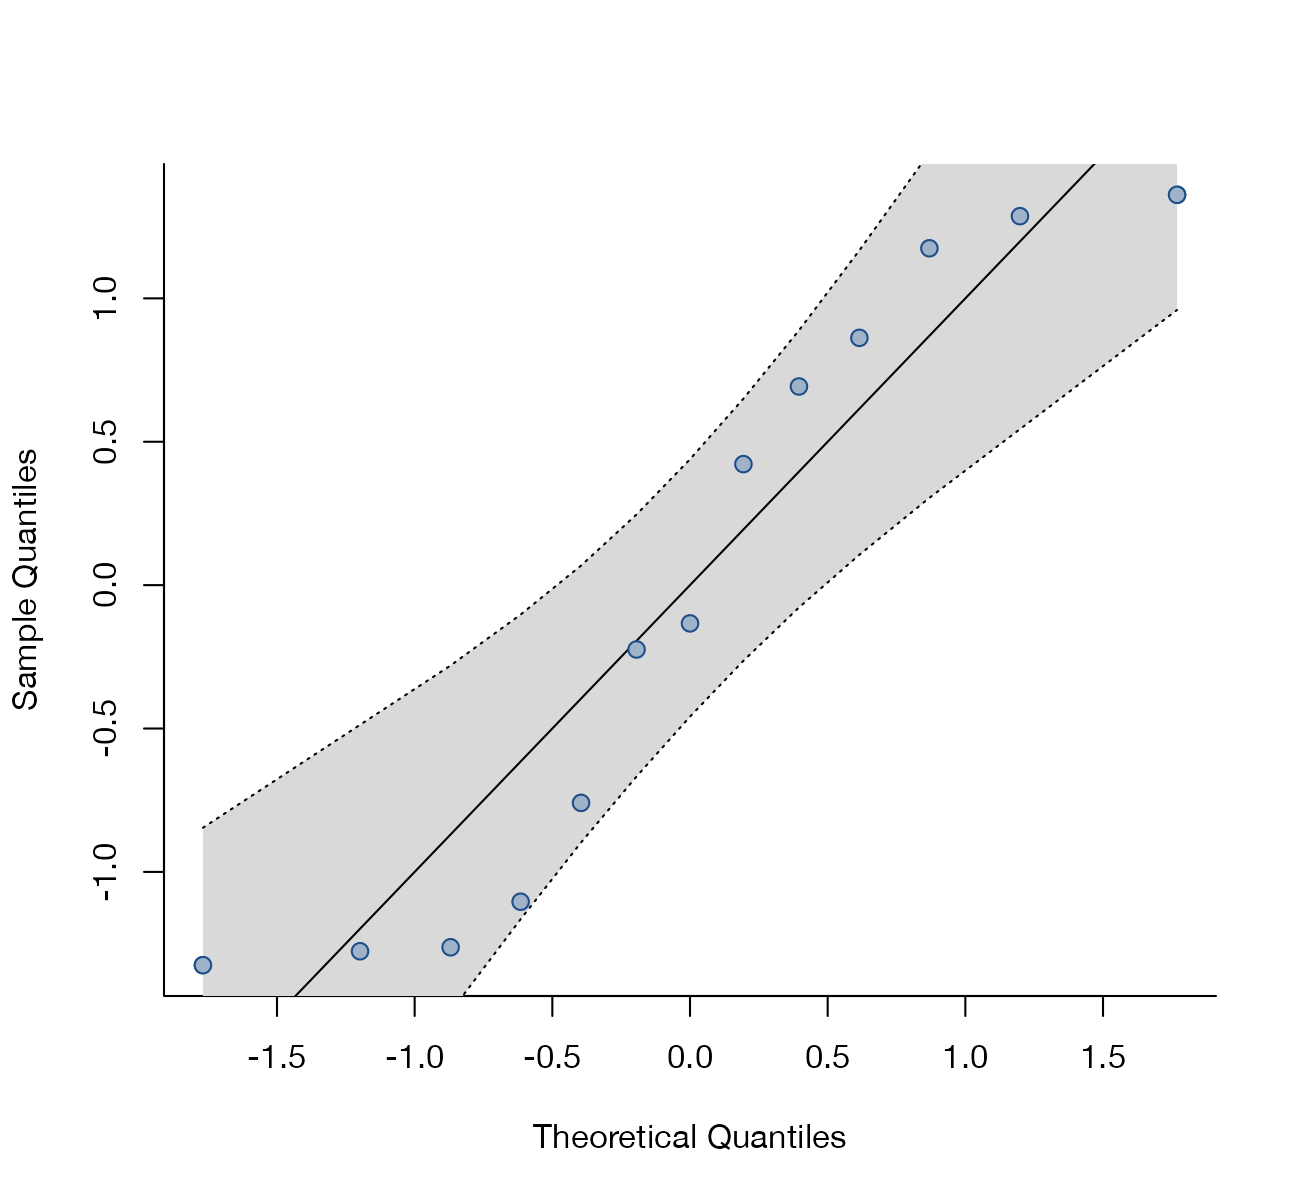
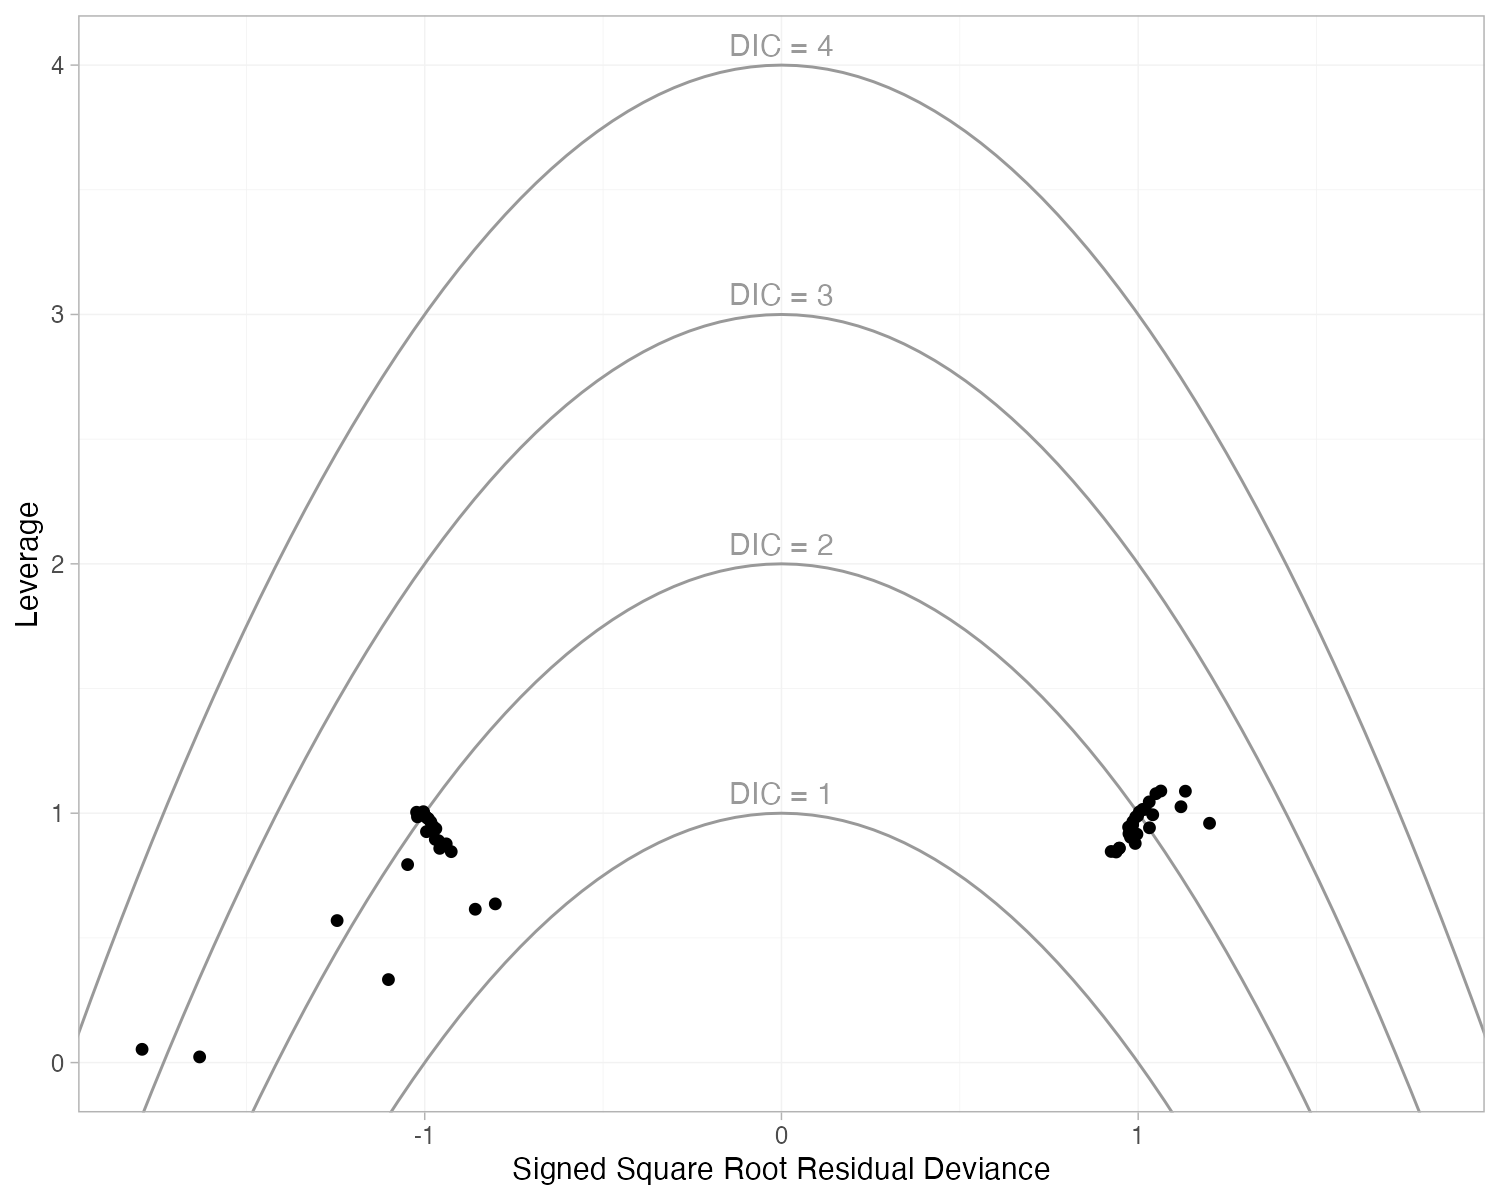
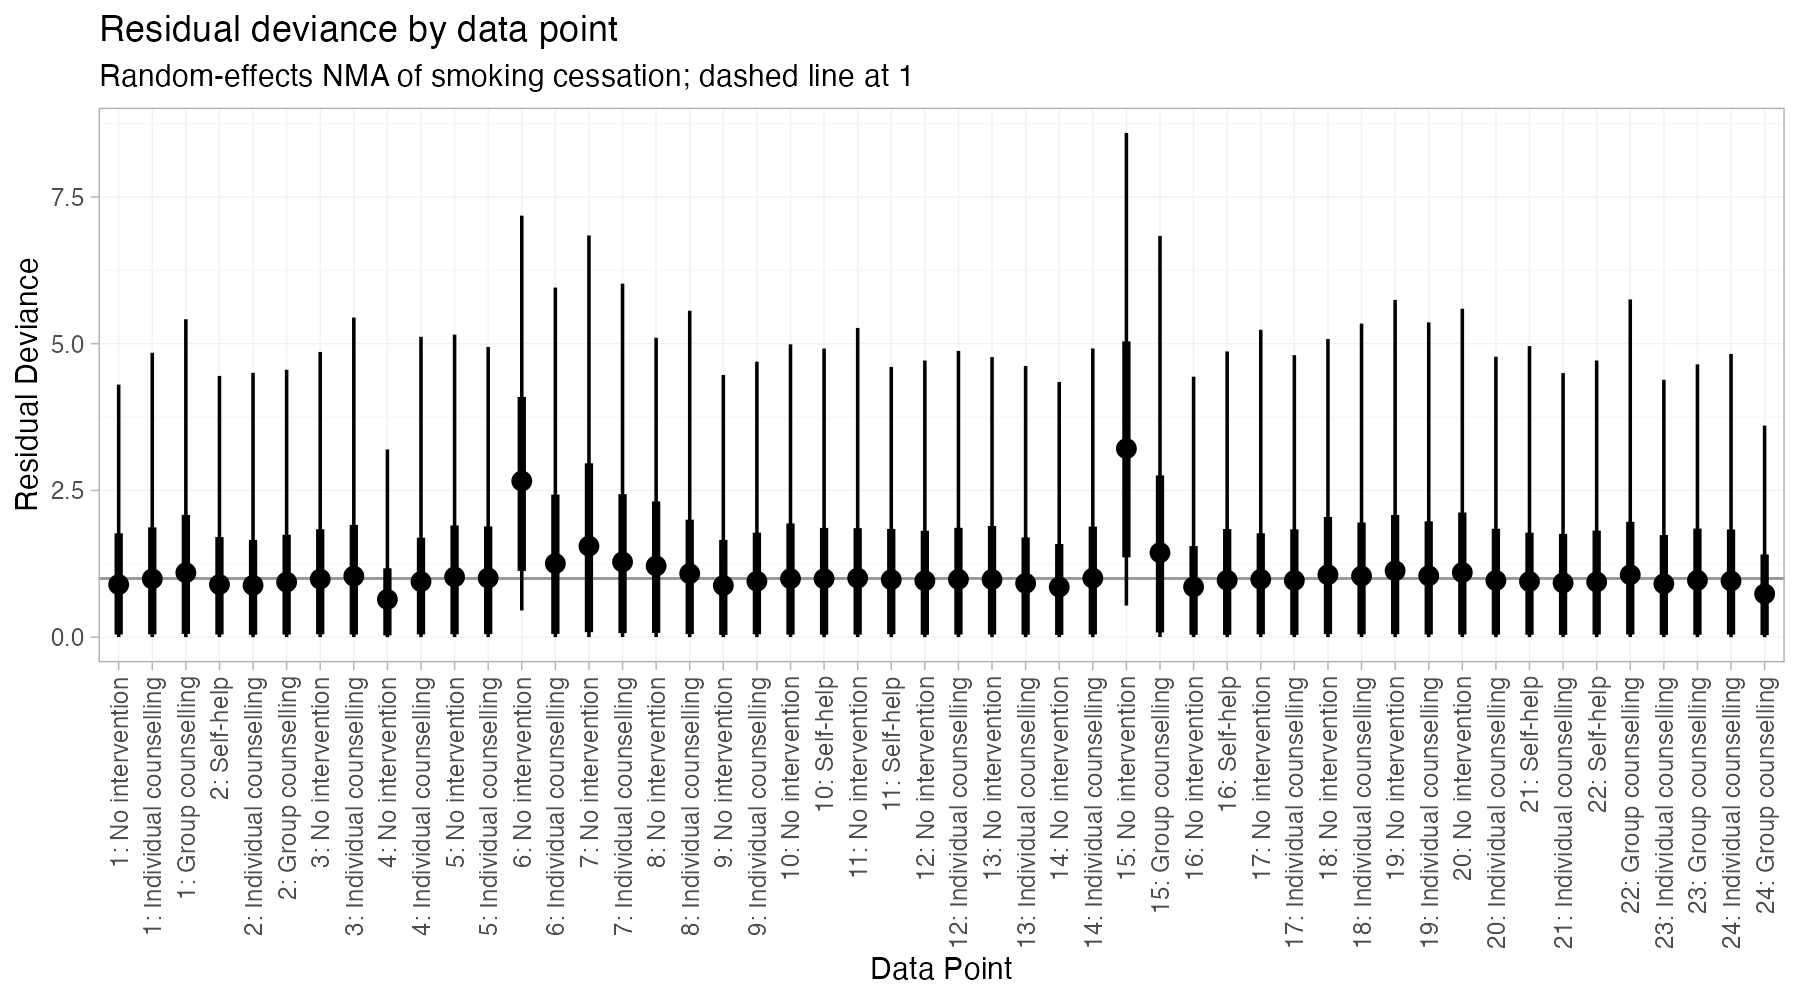
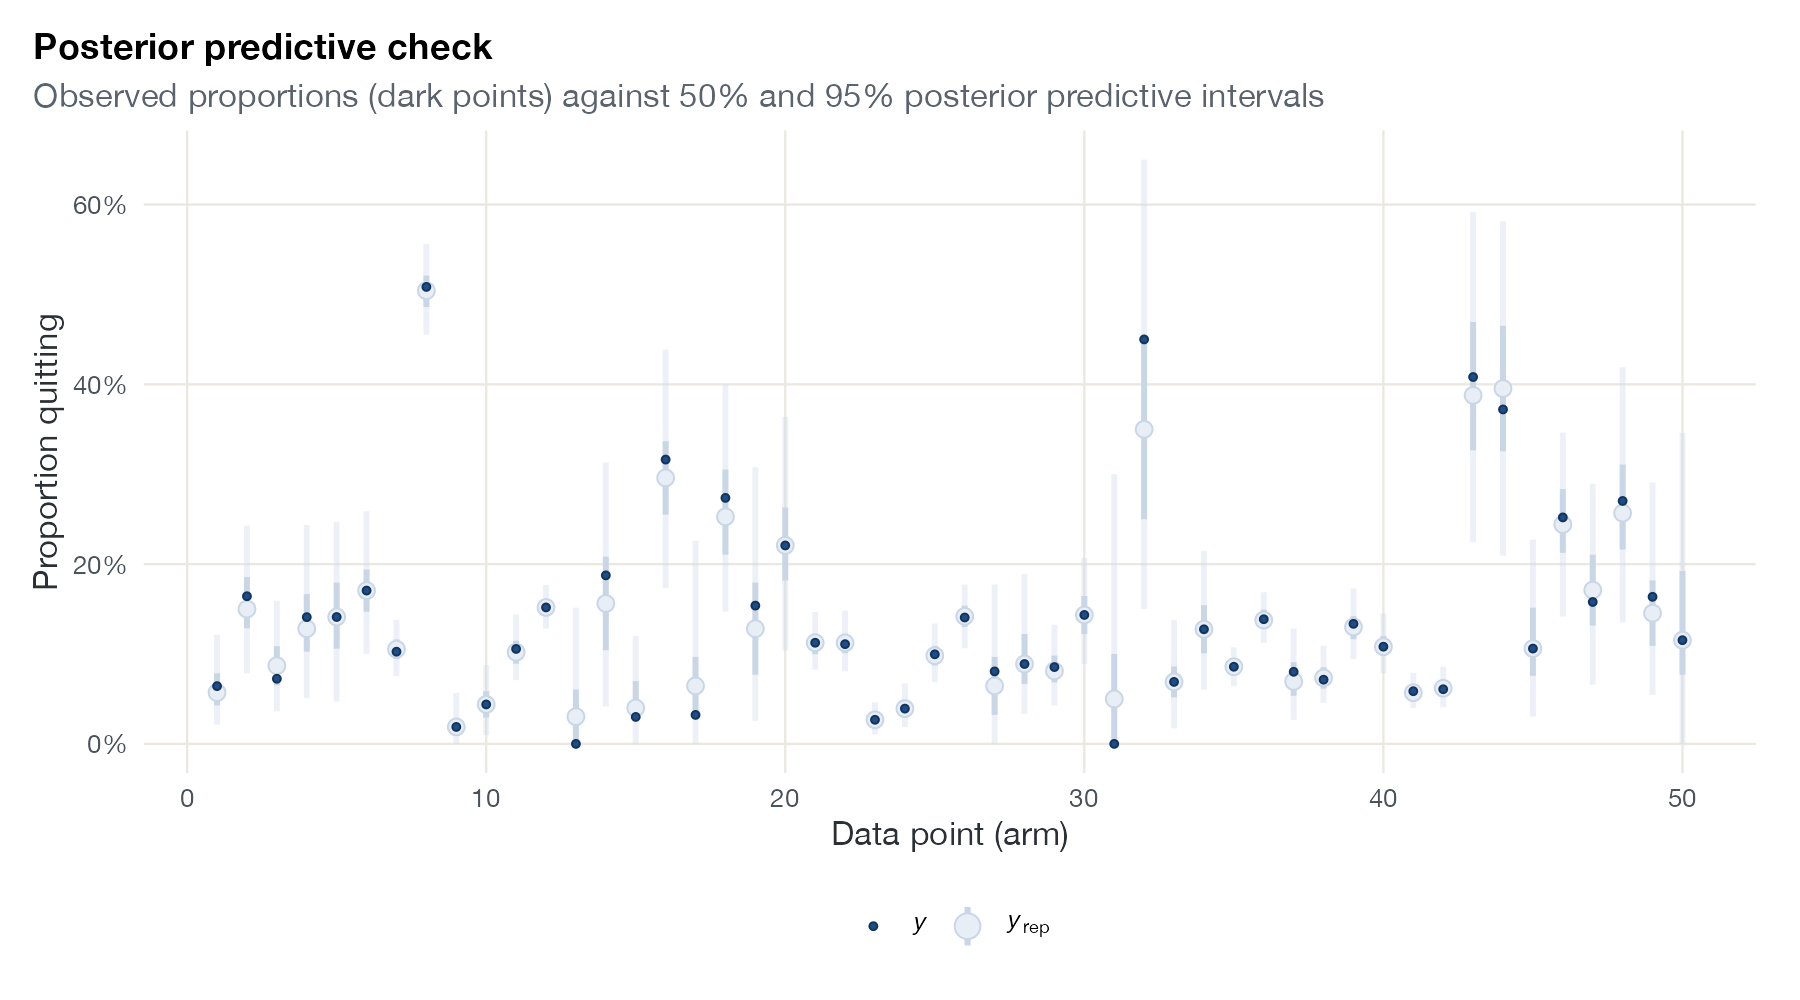
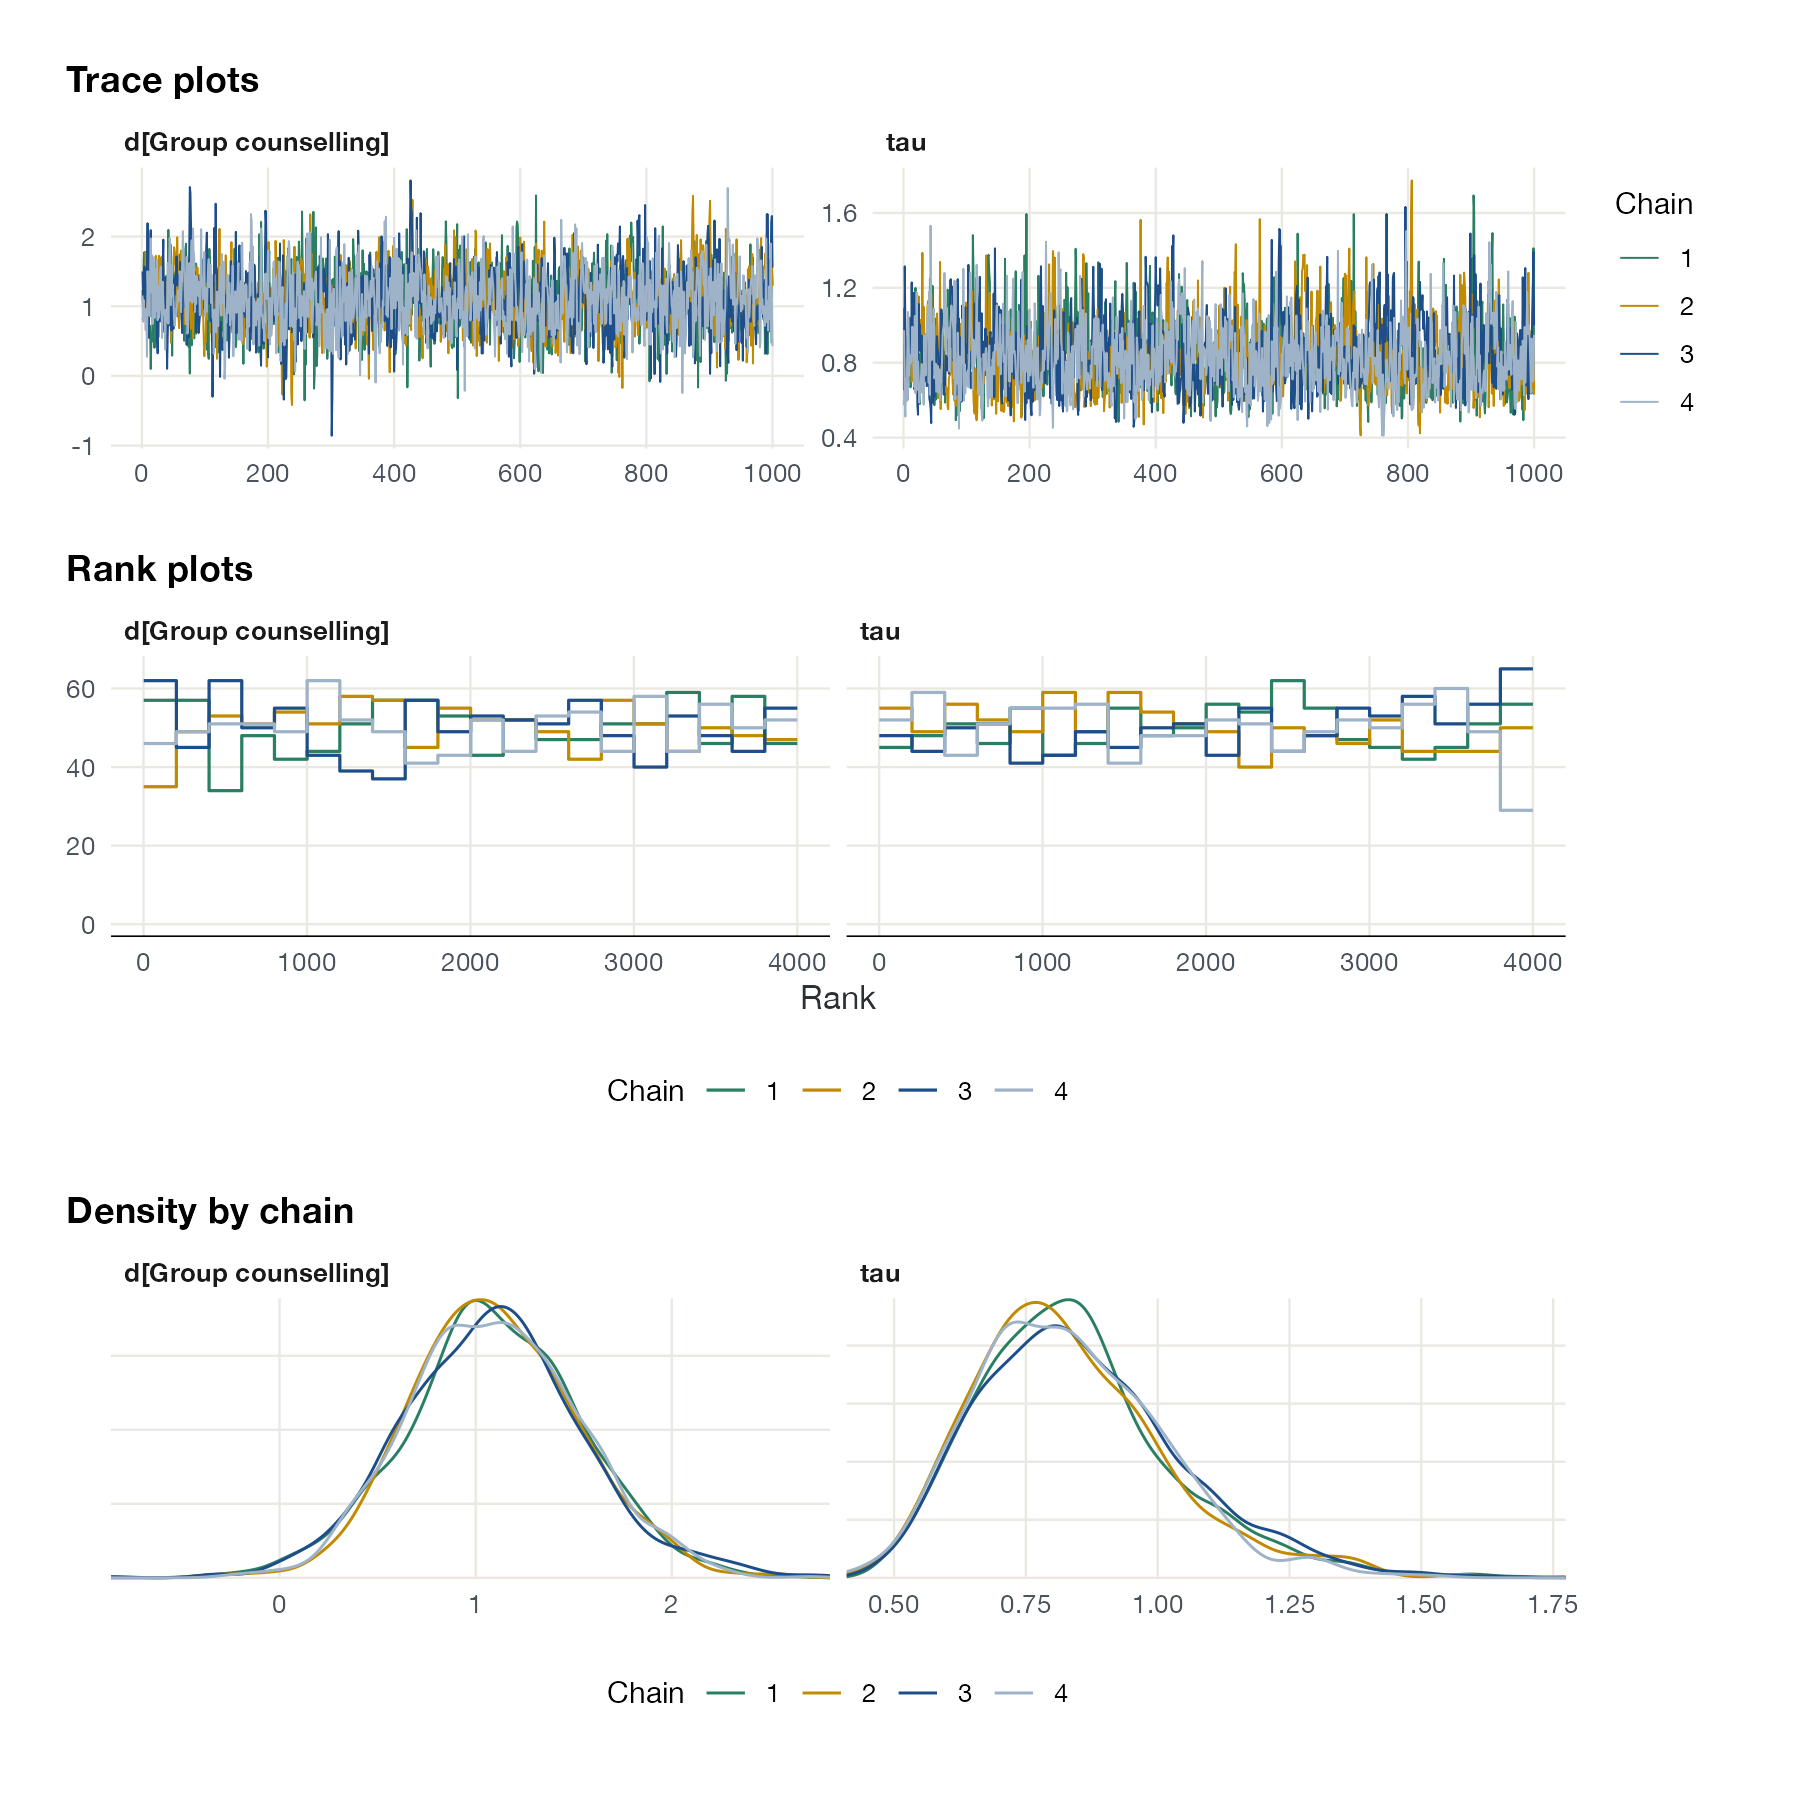
Residuals, fit, predictive checks, and the computational health of Bayesian models.
Component, dose-response, and threshold NMA
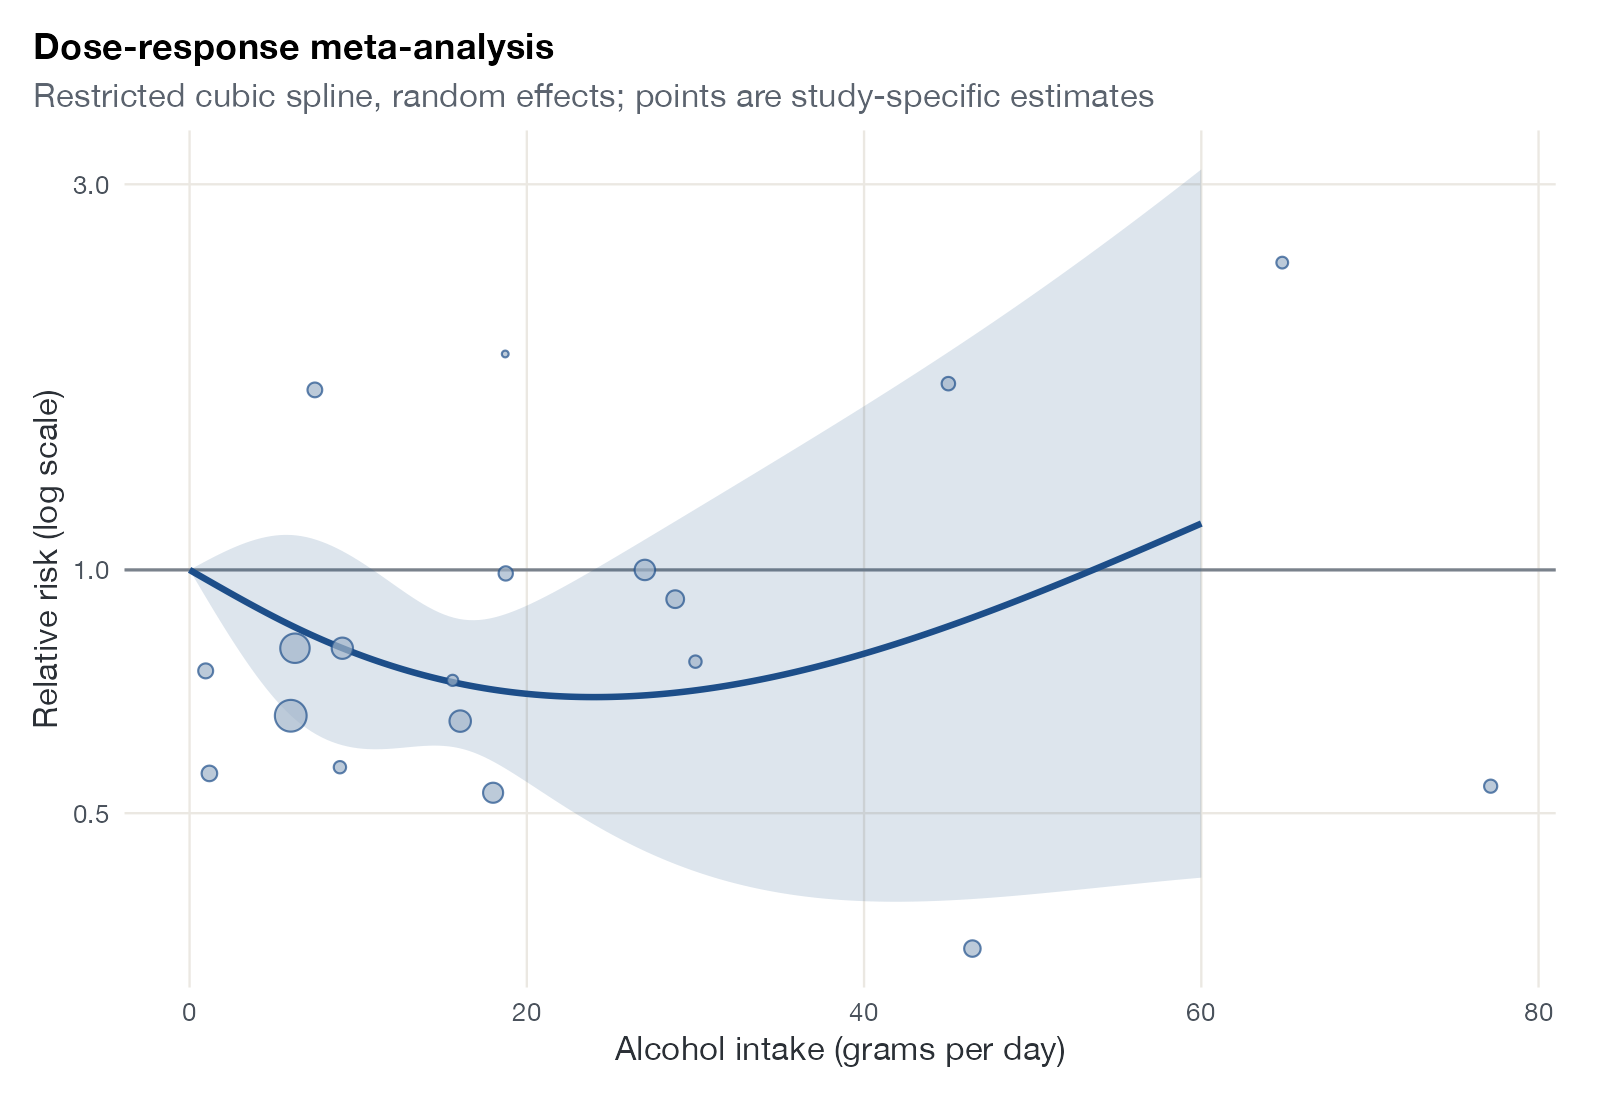
Extensions of NMA for complex interventions, dose-response relationships, and decision robustness.
Survival and time-to-event
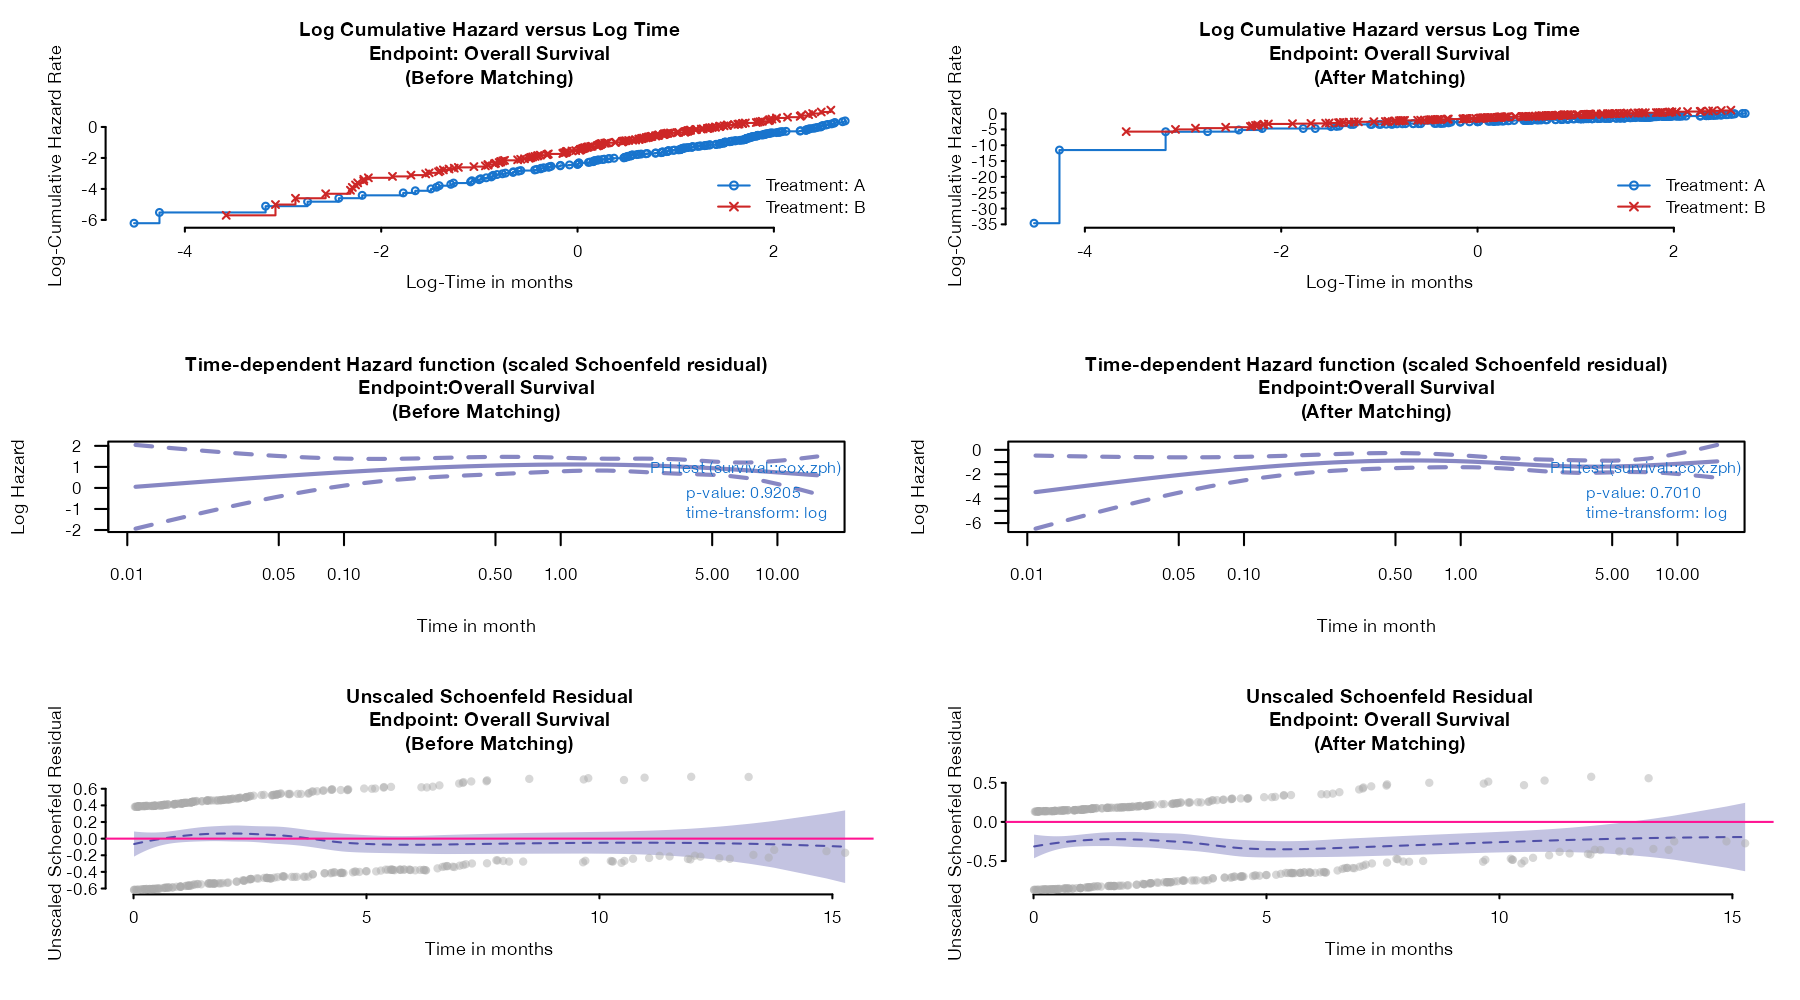
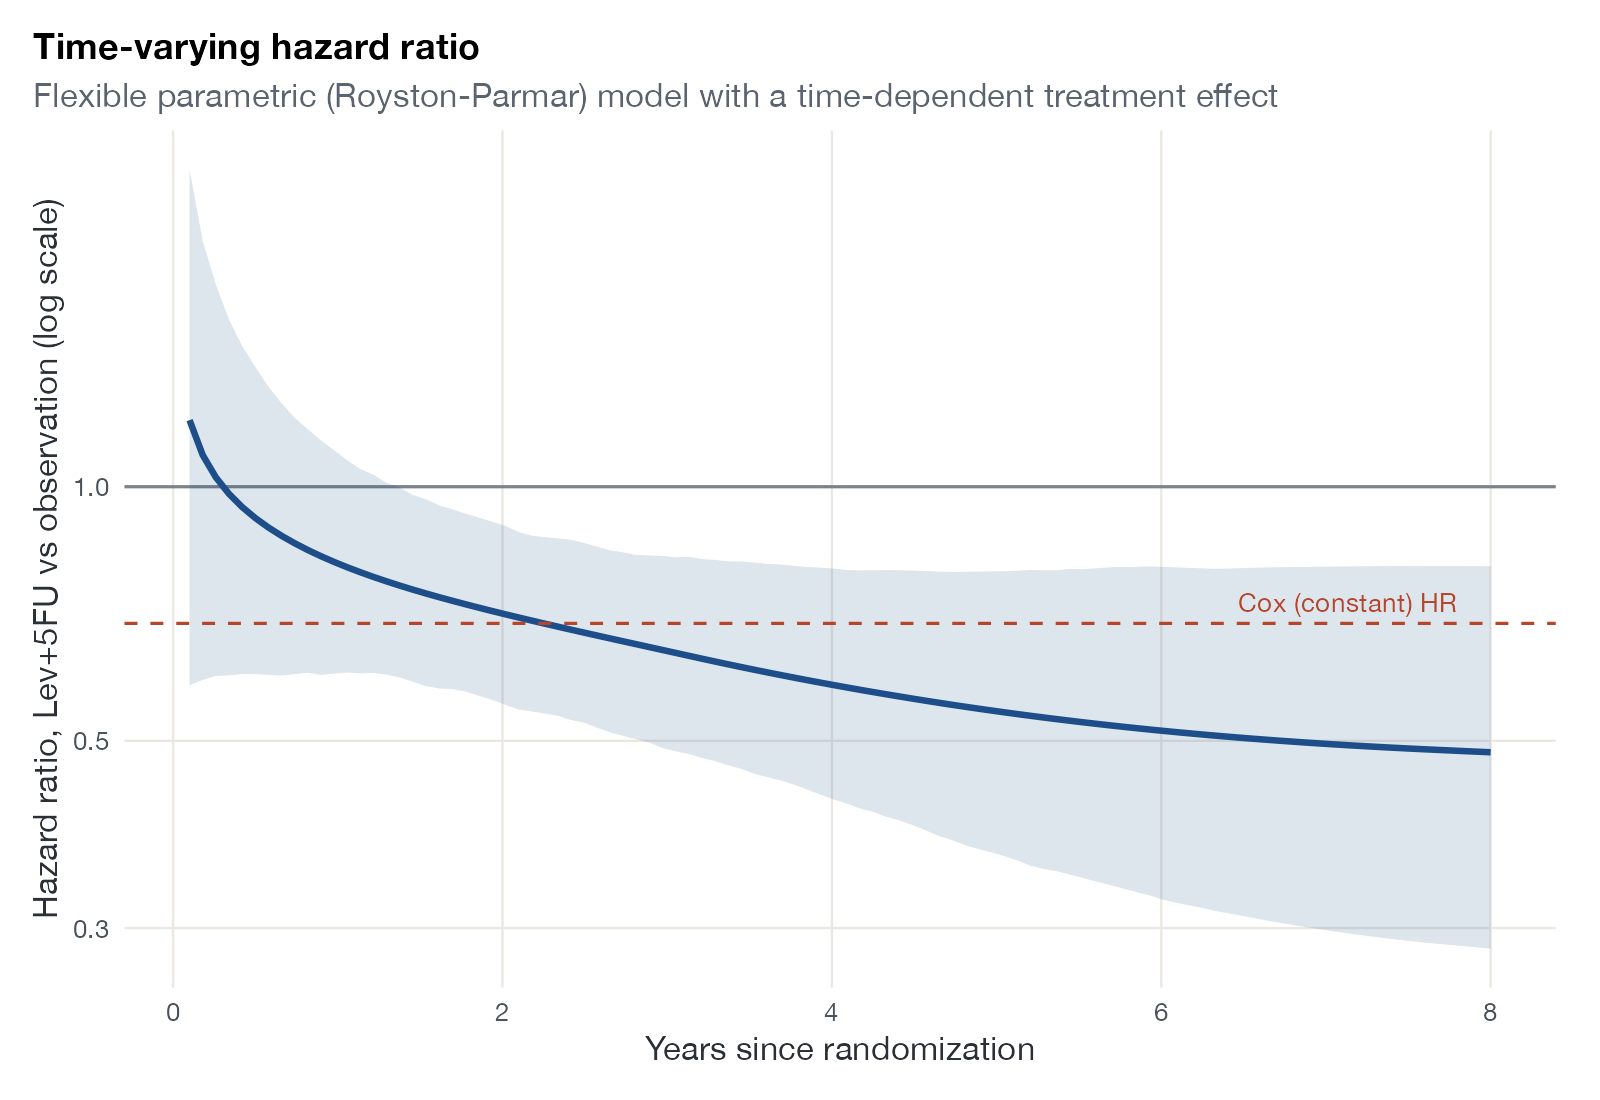
Kaplan-Meier displays, proportional hazards checks, and time-varying effects across ITC methods.
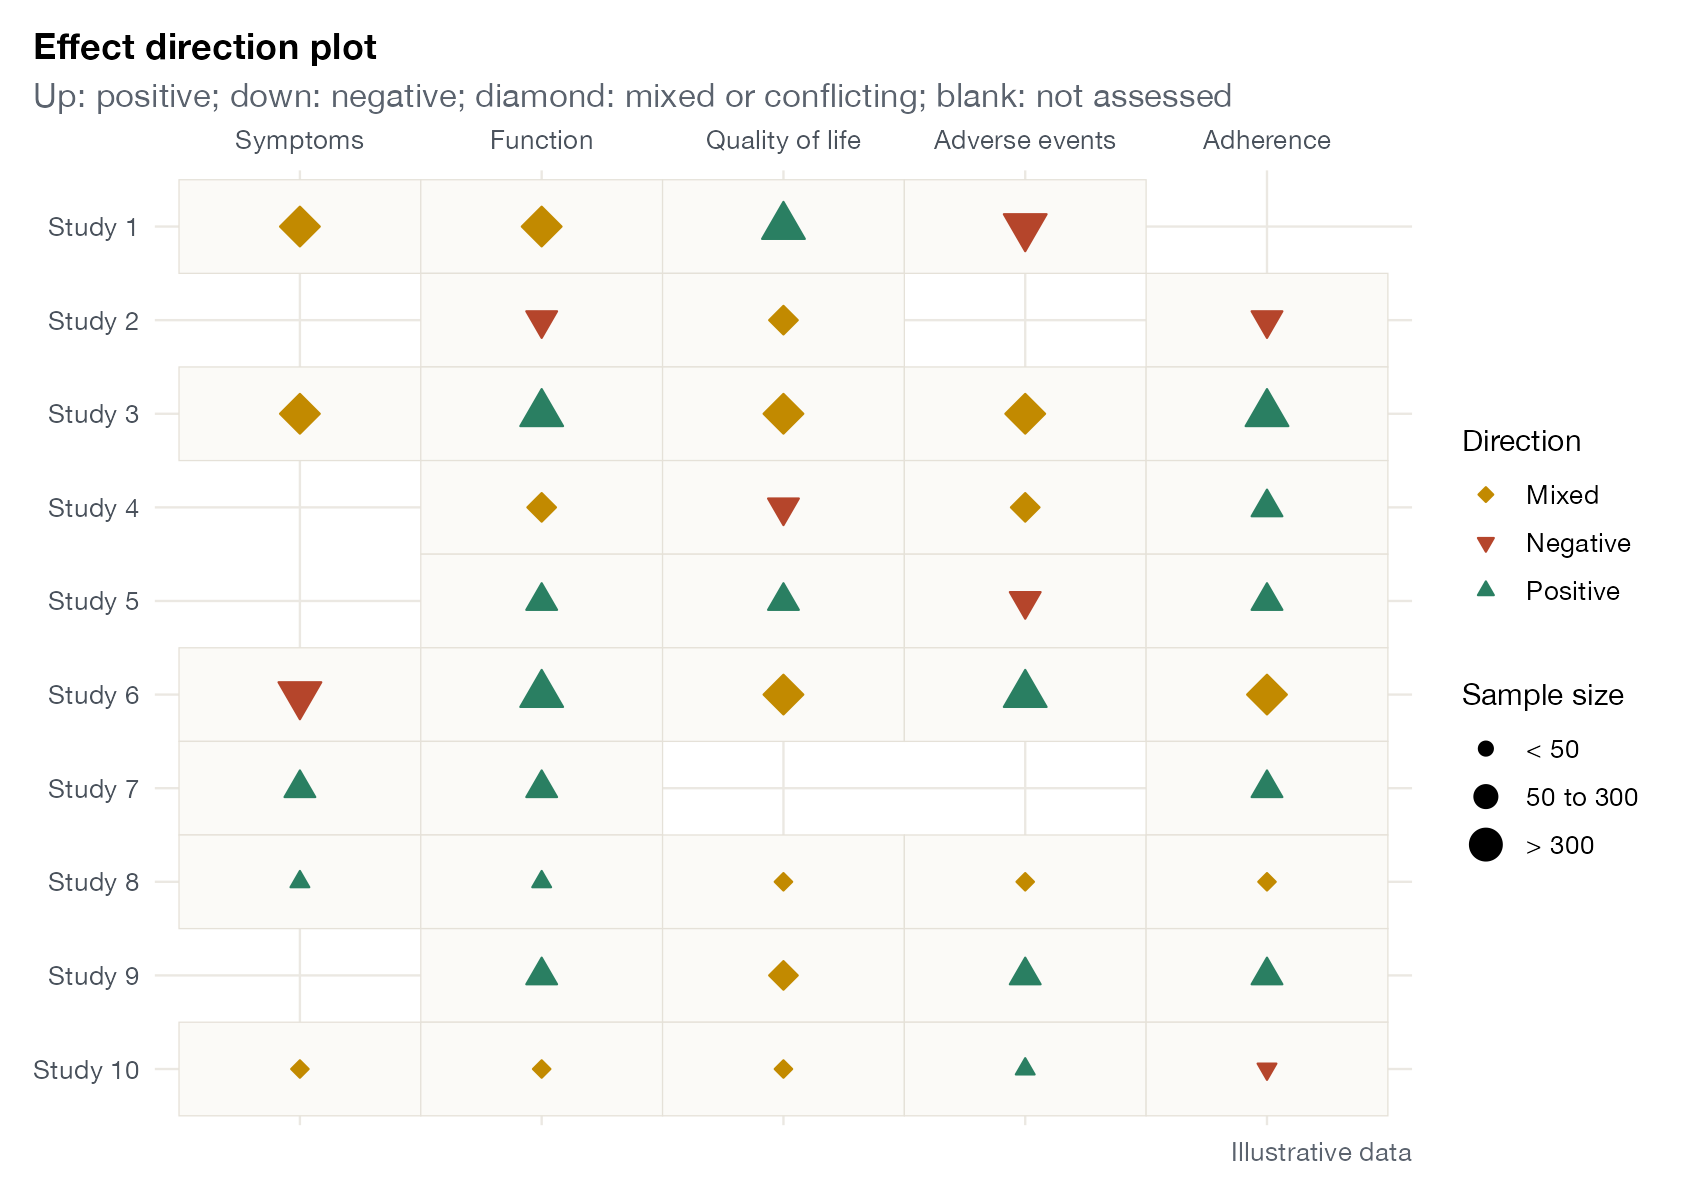
Synthesis without meta-analysis
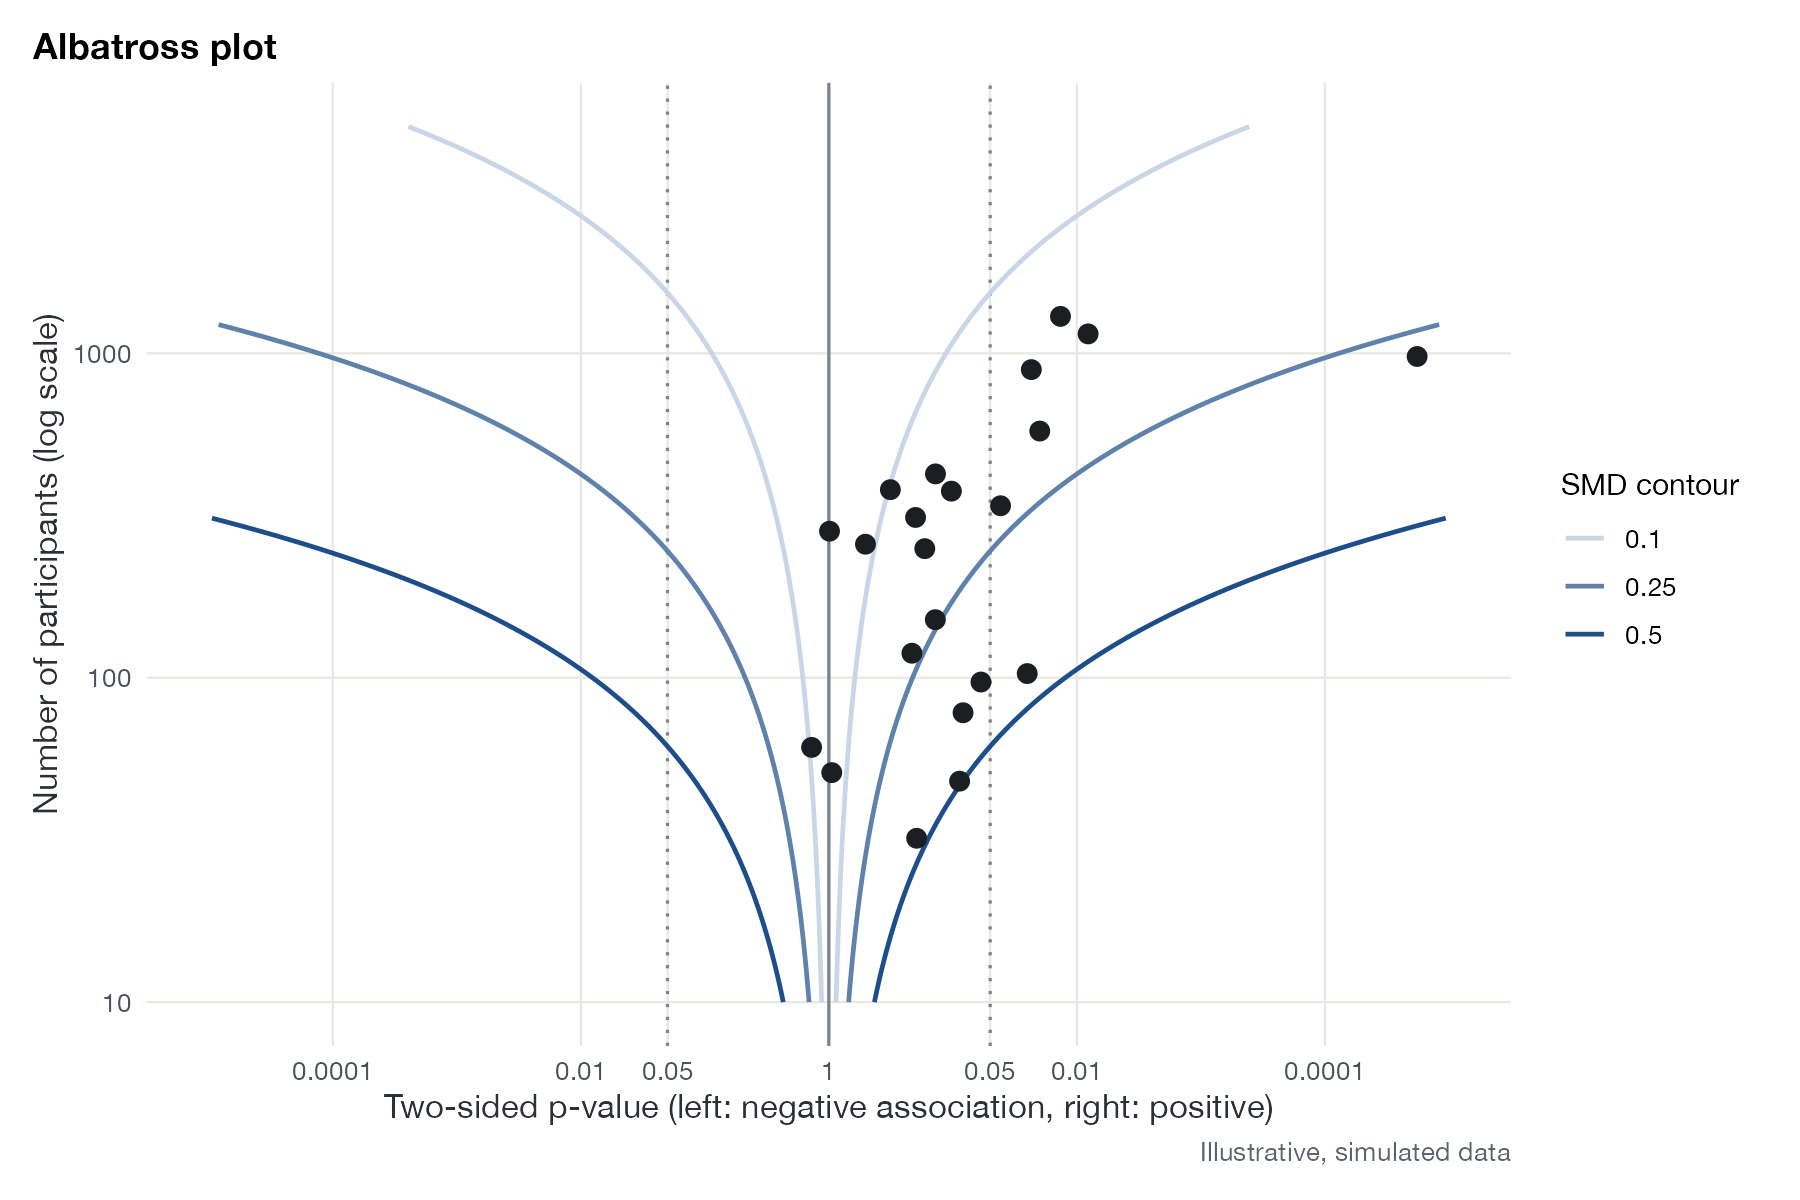
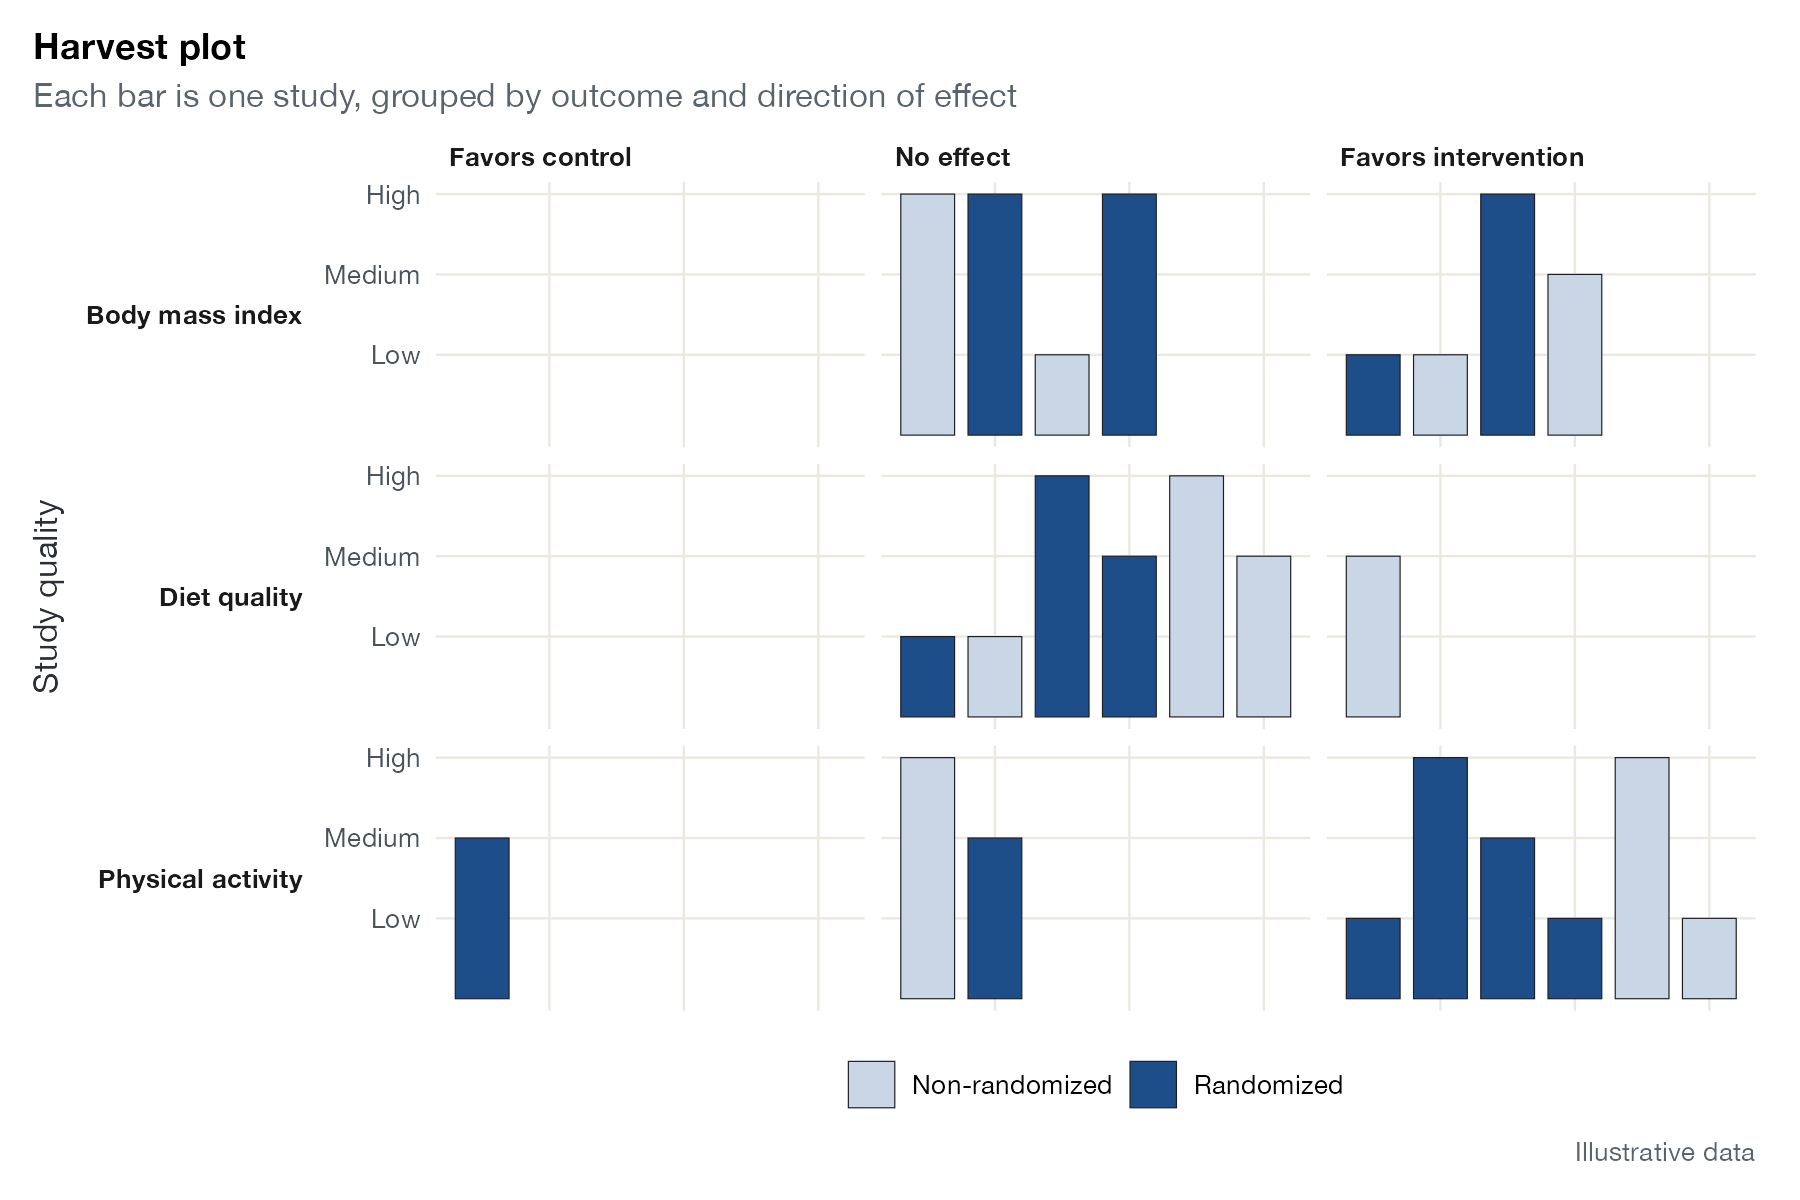
Graphics for reviews where effect sizes cannot be pooled.
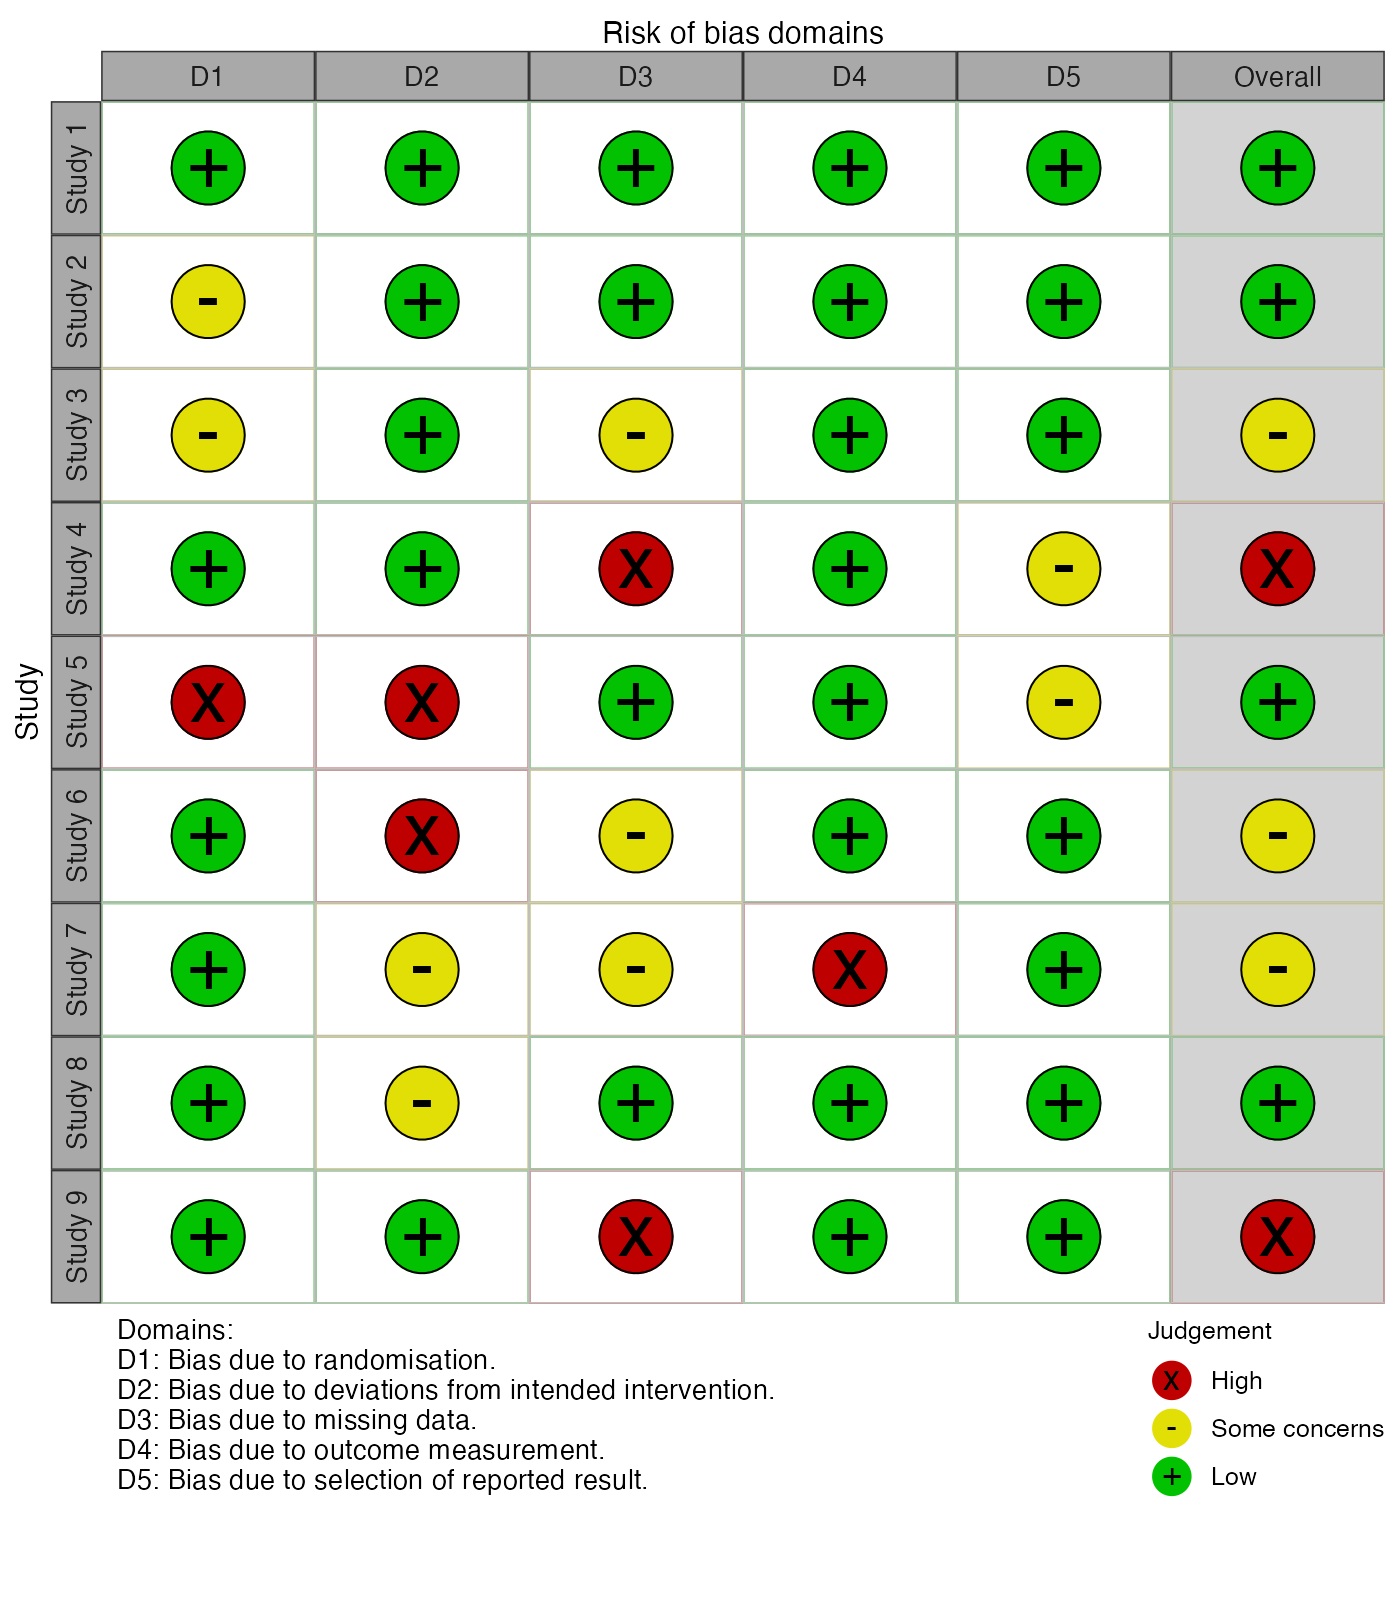
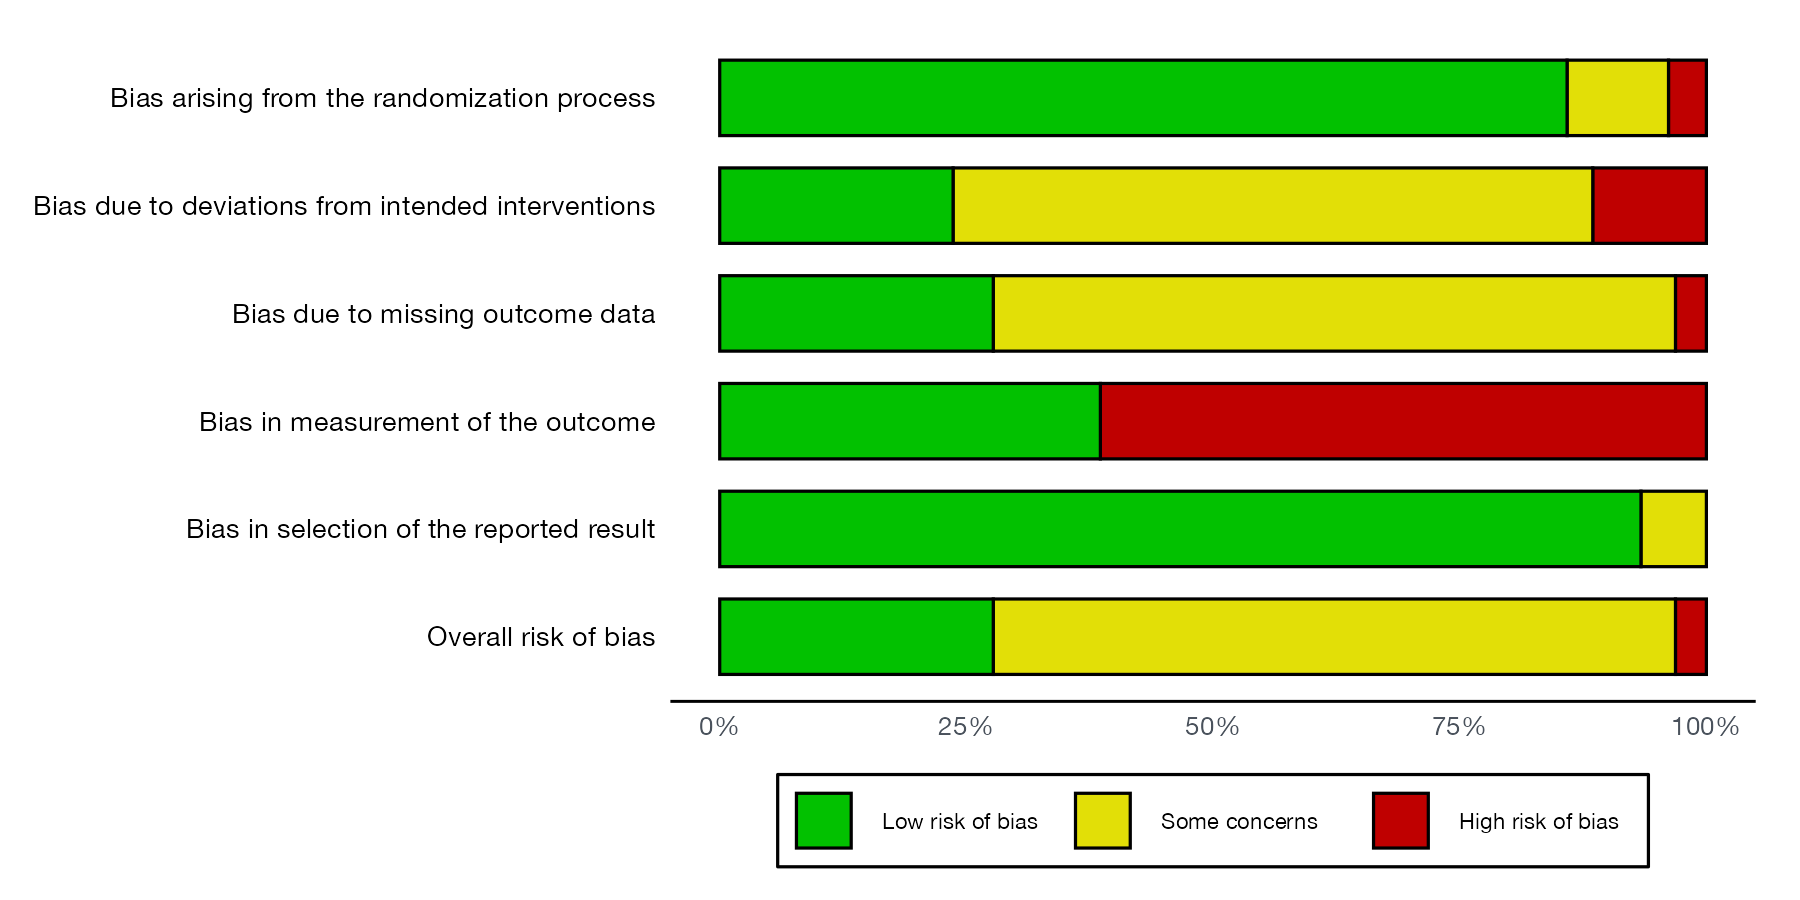
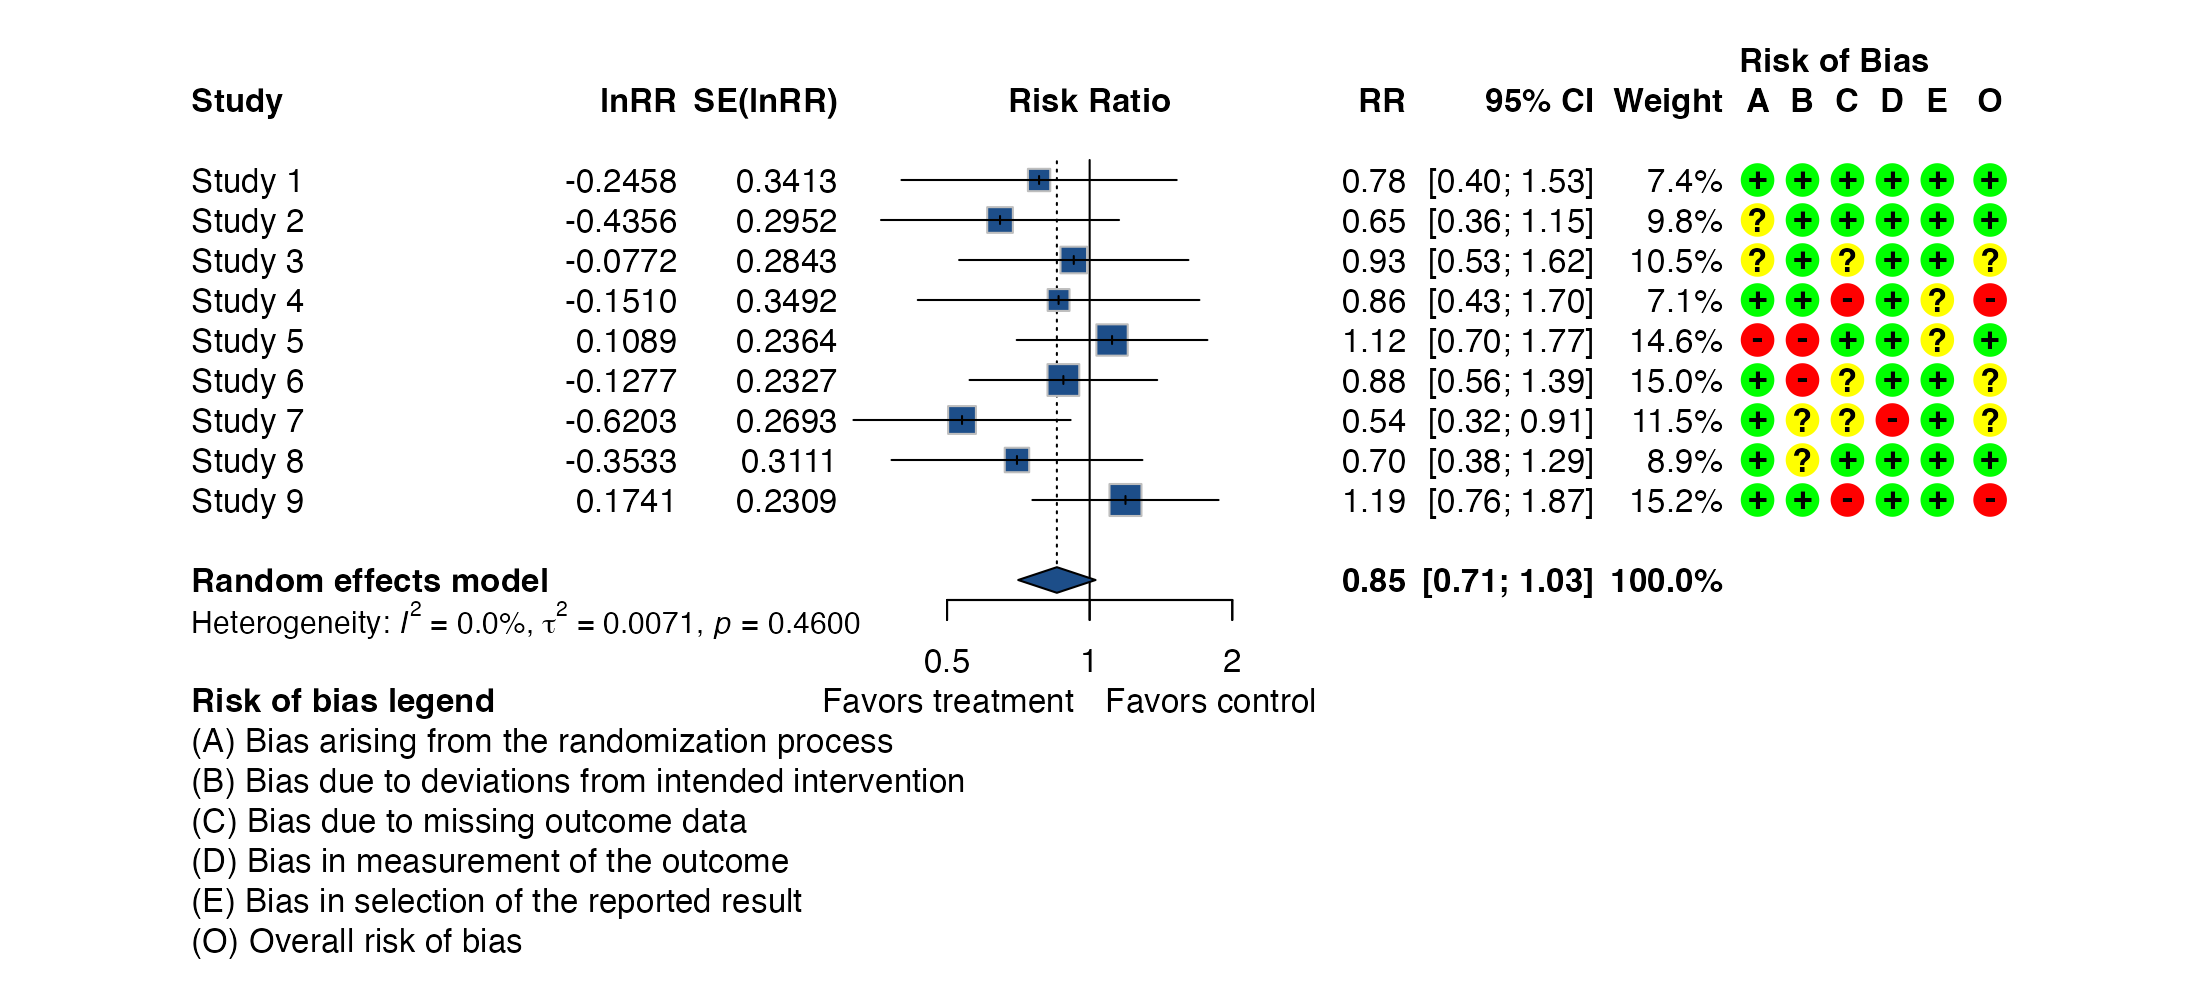
Risk of bias and reporting
Study-level quality displays that accompany the quantitative synthesis.
Simulation and method evaluation
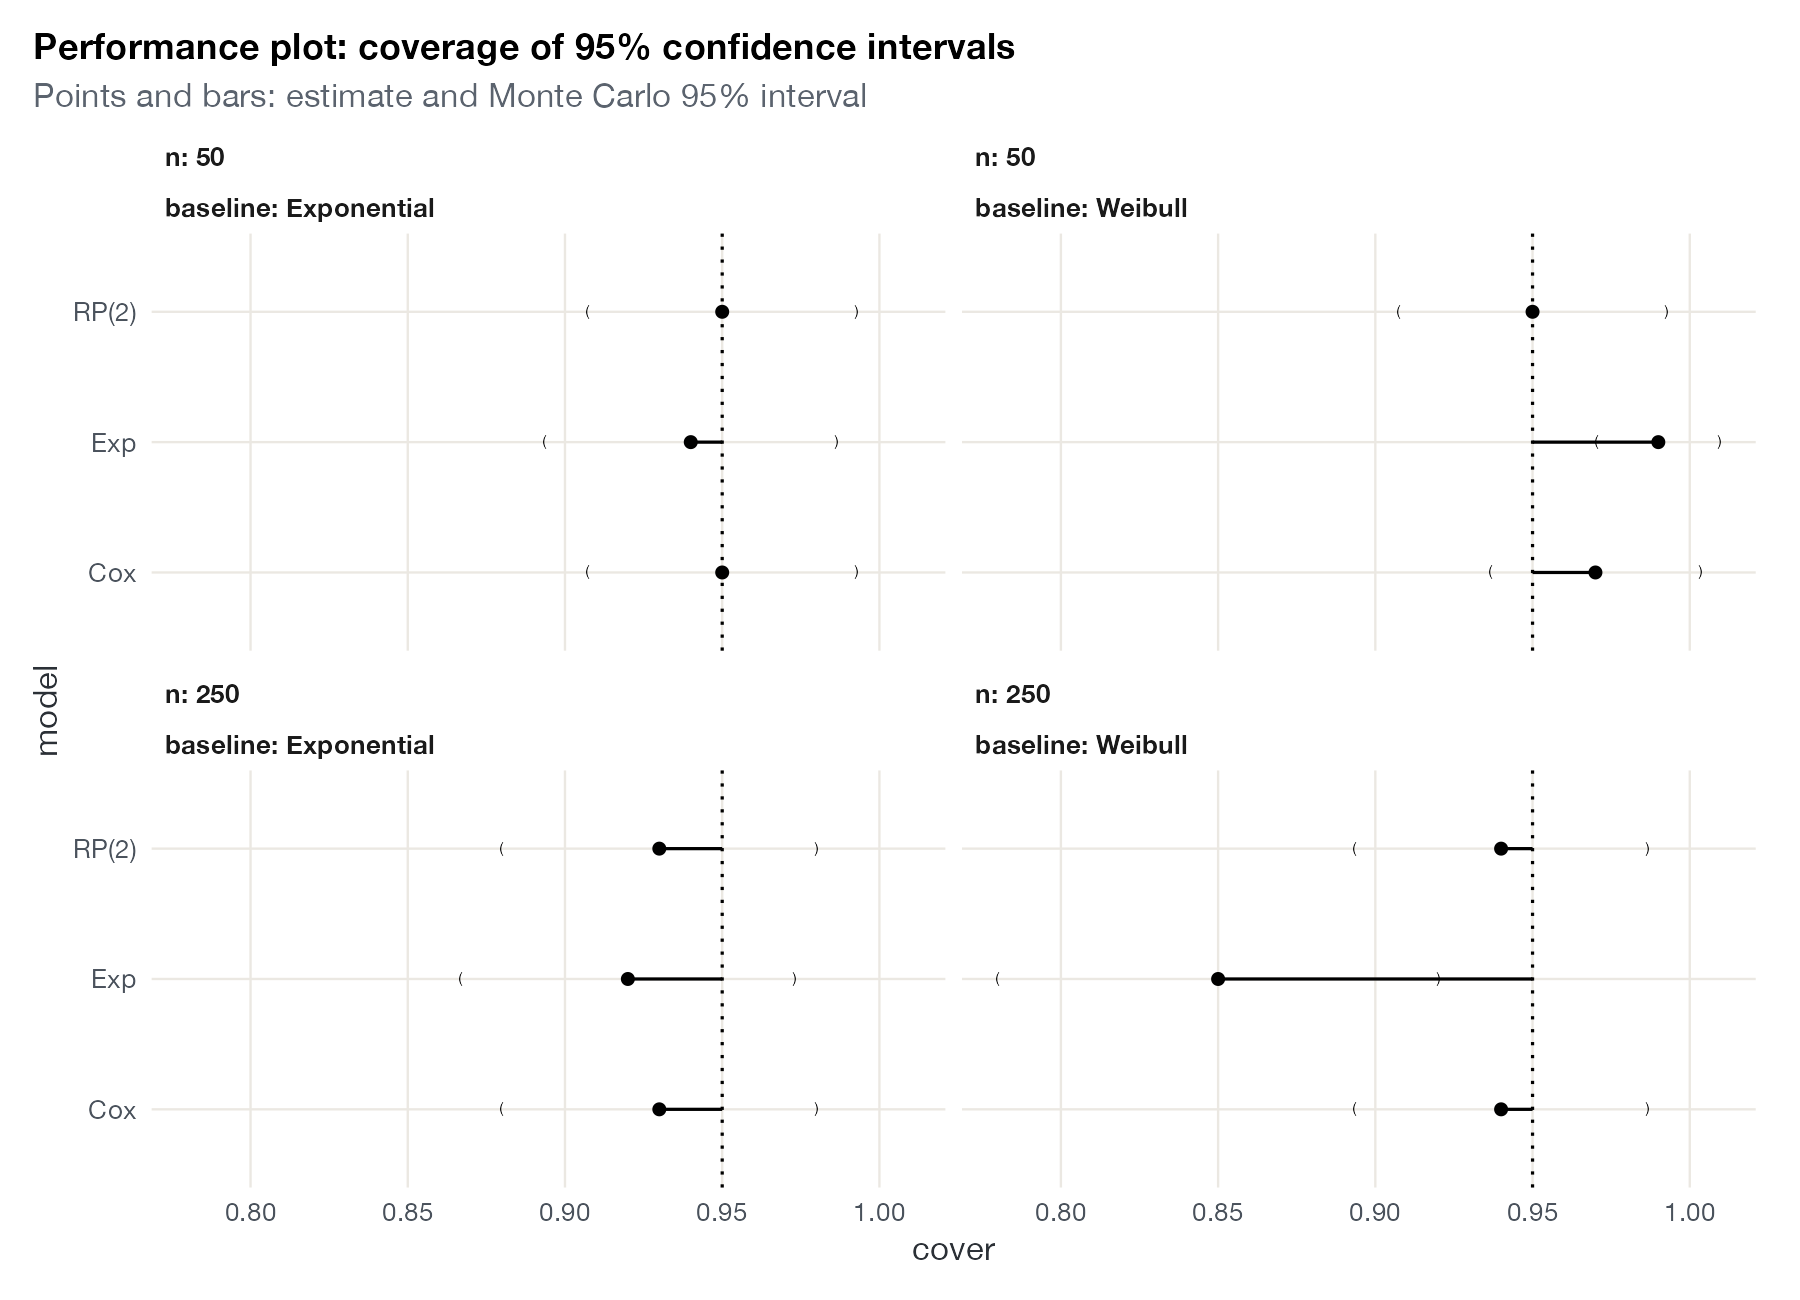
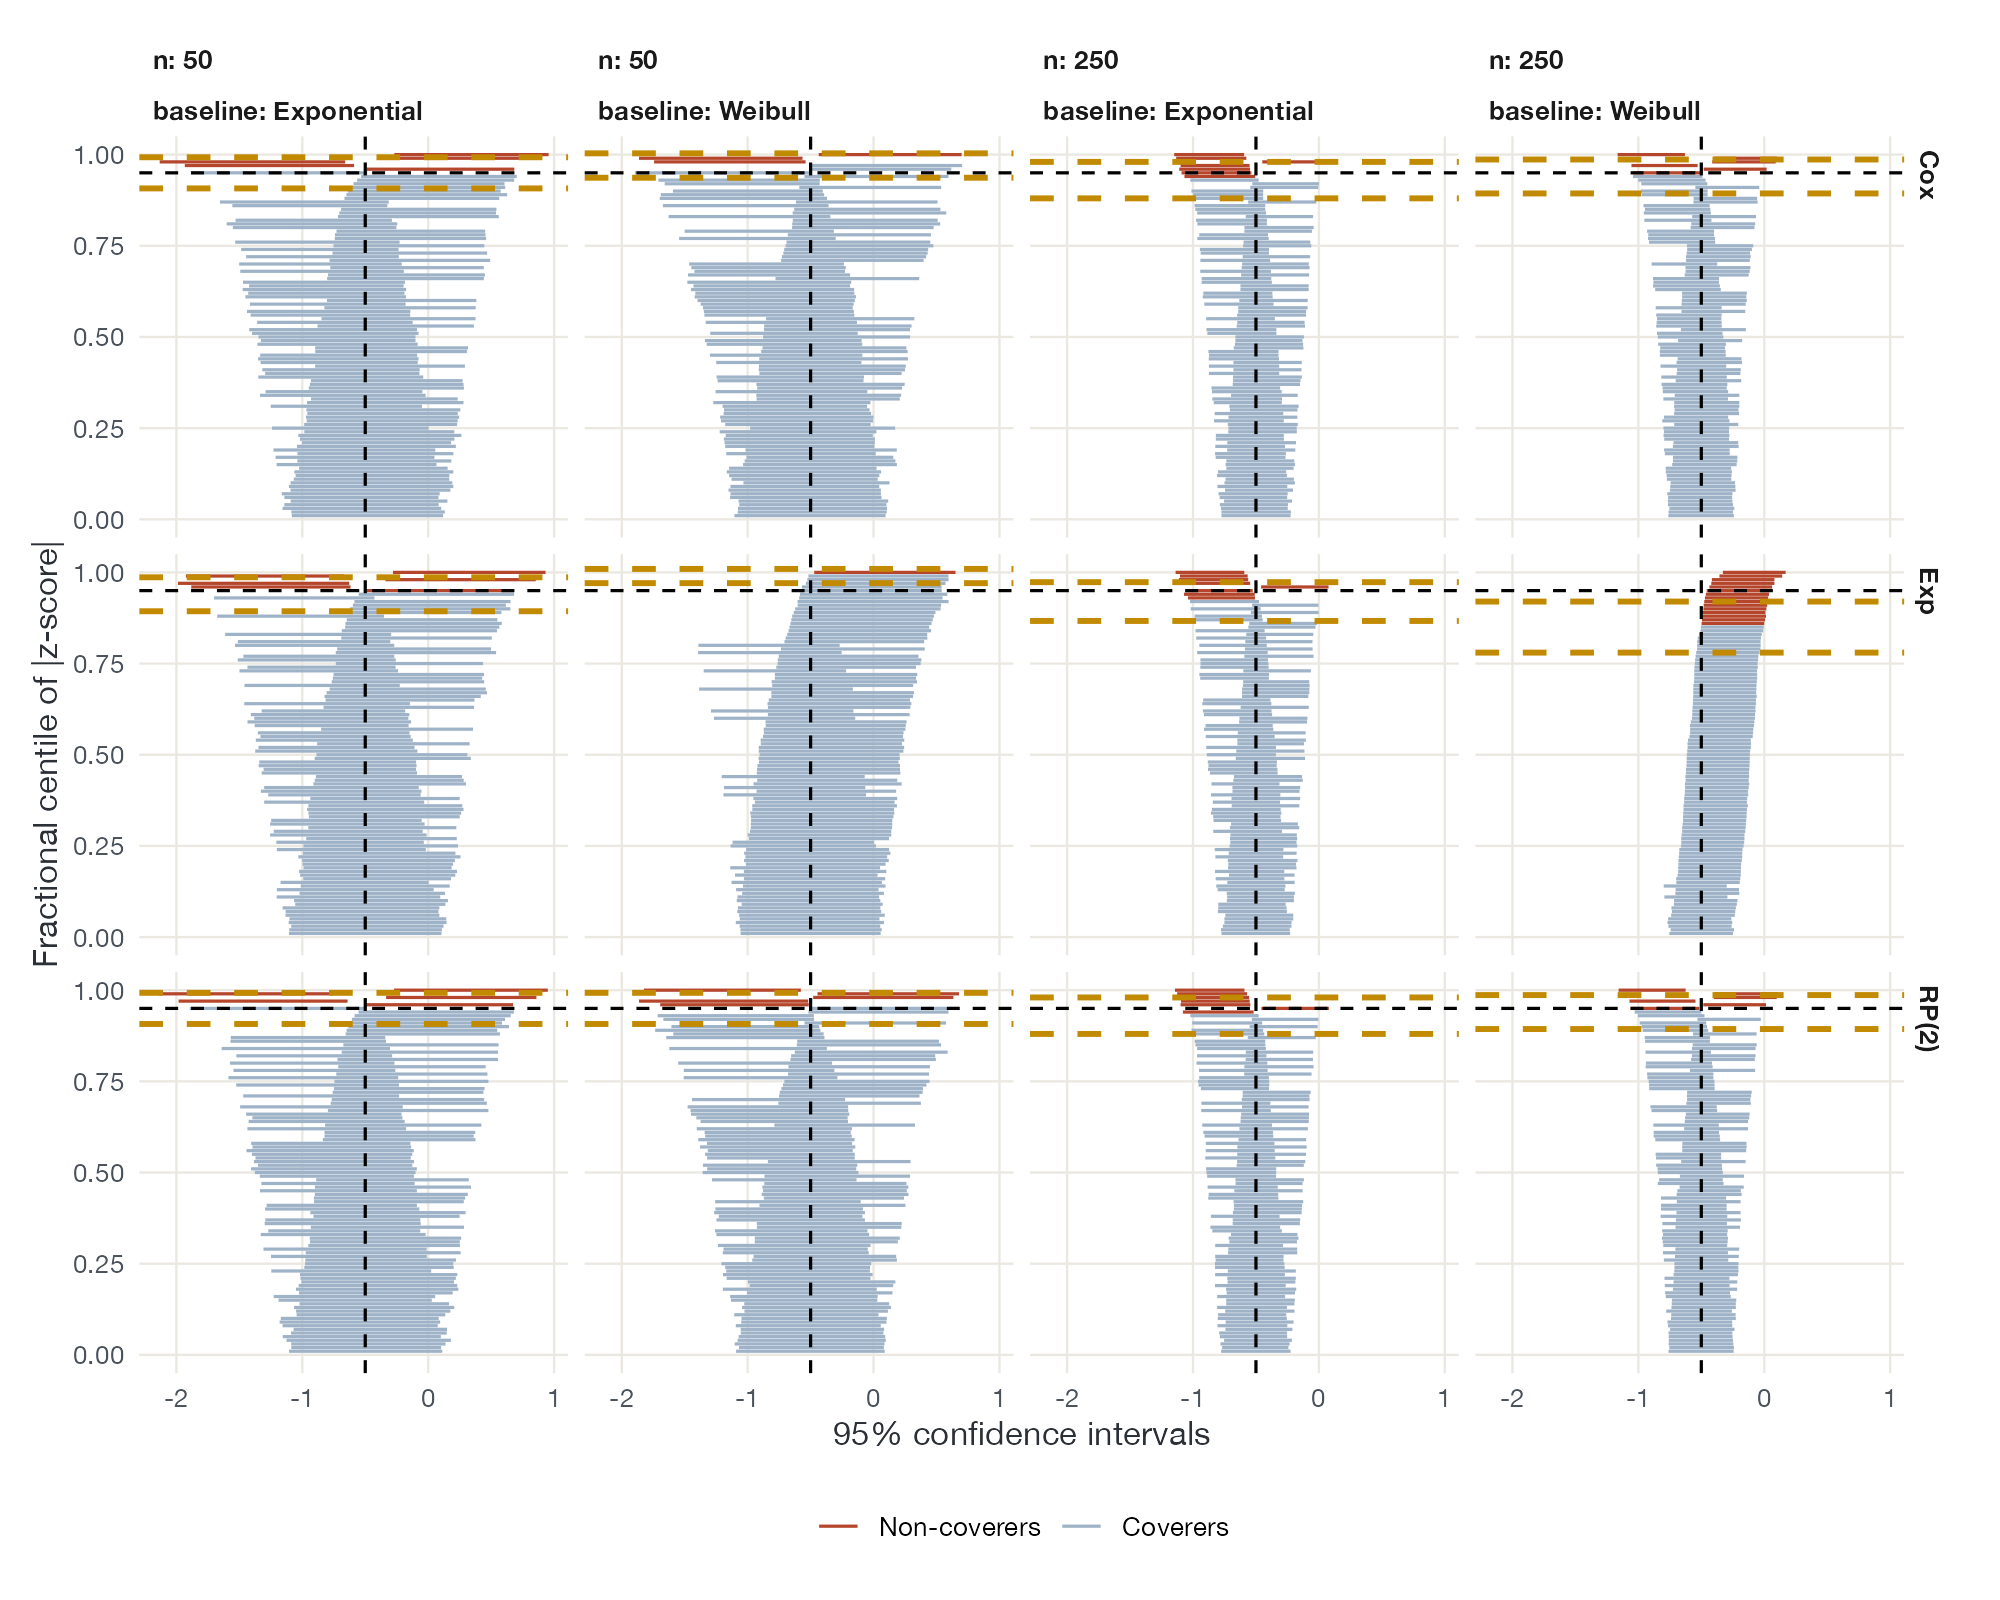
Graphics from the proof-of-concept literature that evaluates methods under known truth.
No plots match this filter. Try another method or search term.