Simulated treatment comparison and G-computation
Plots for outcome-regression population adjustment
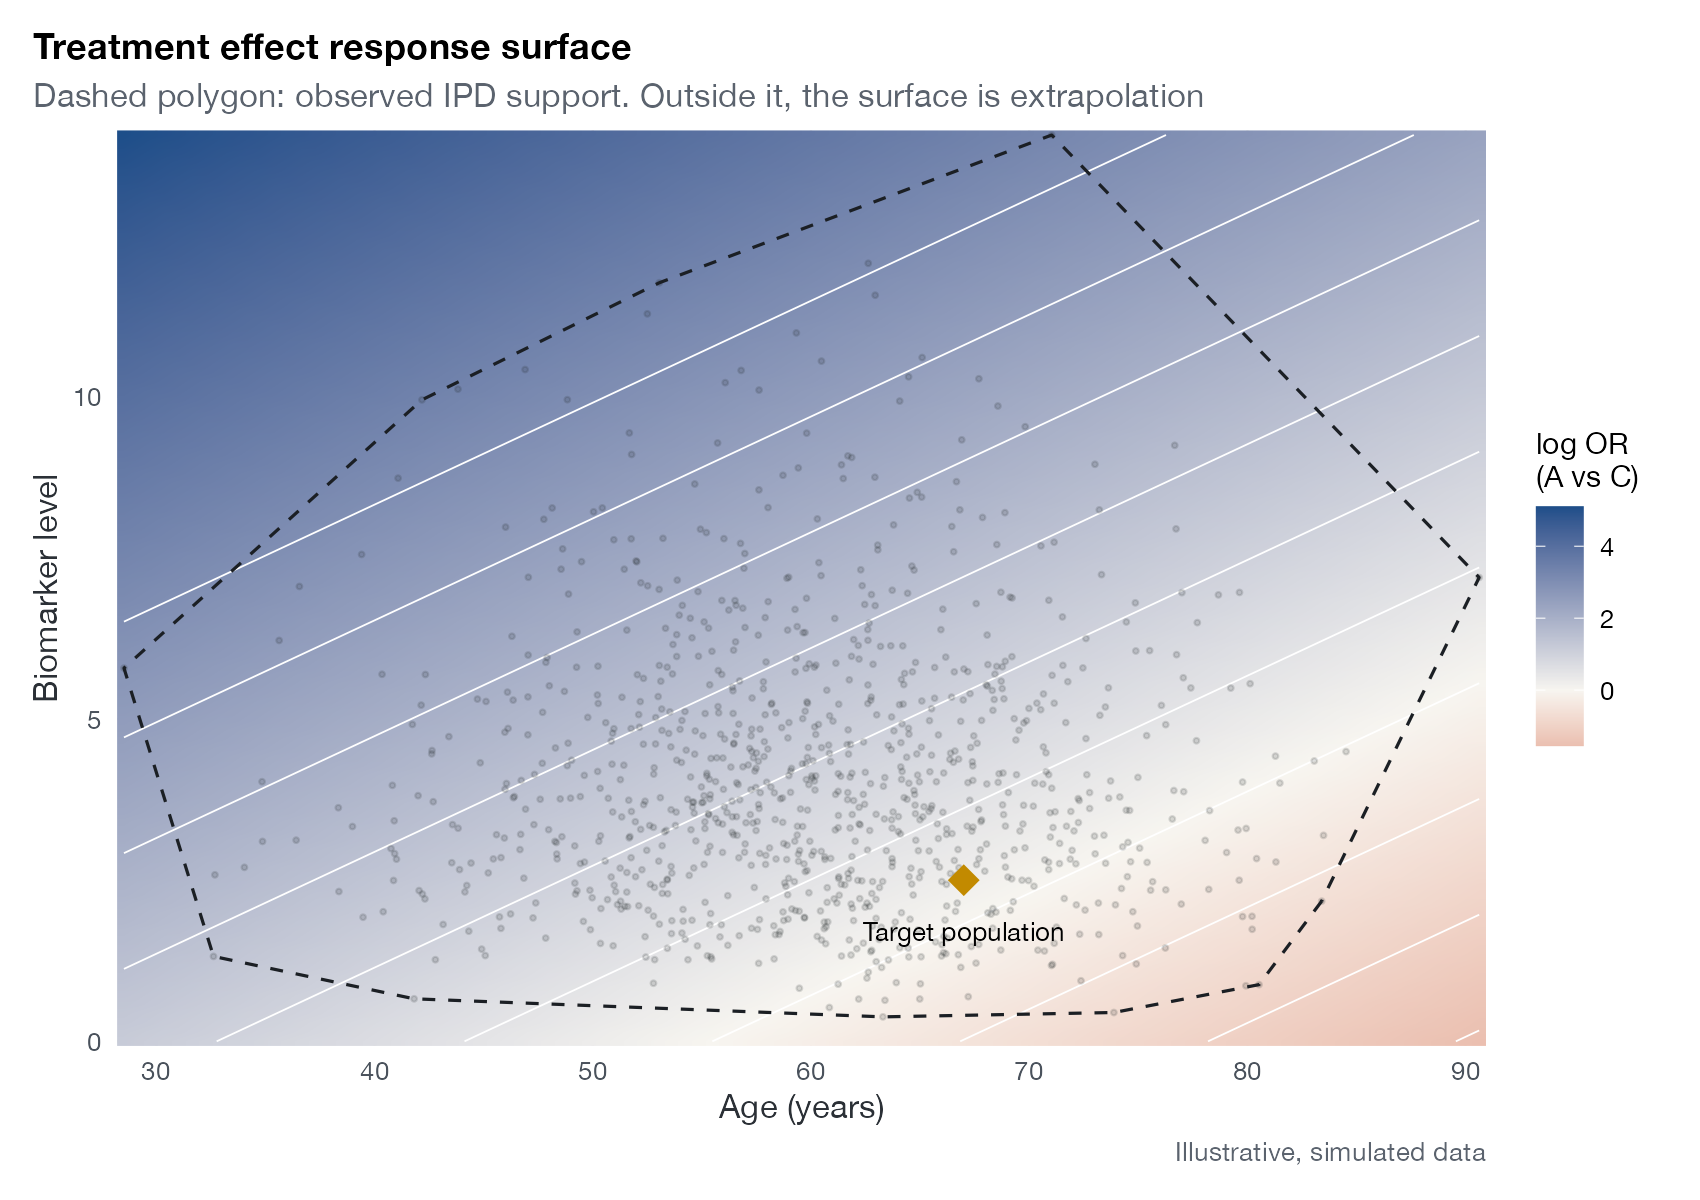
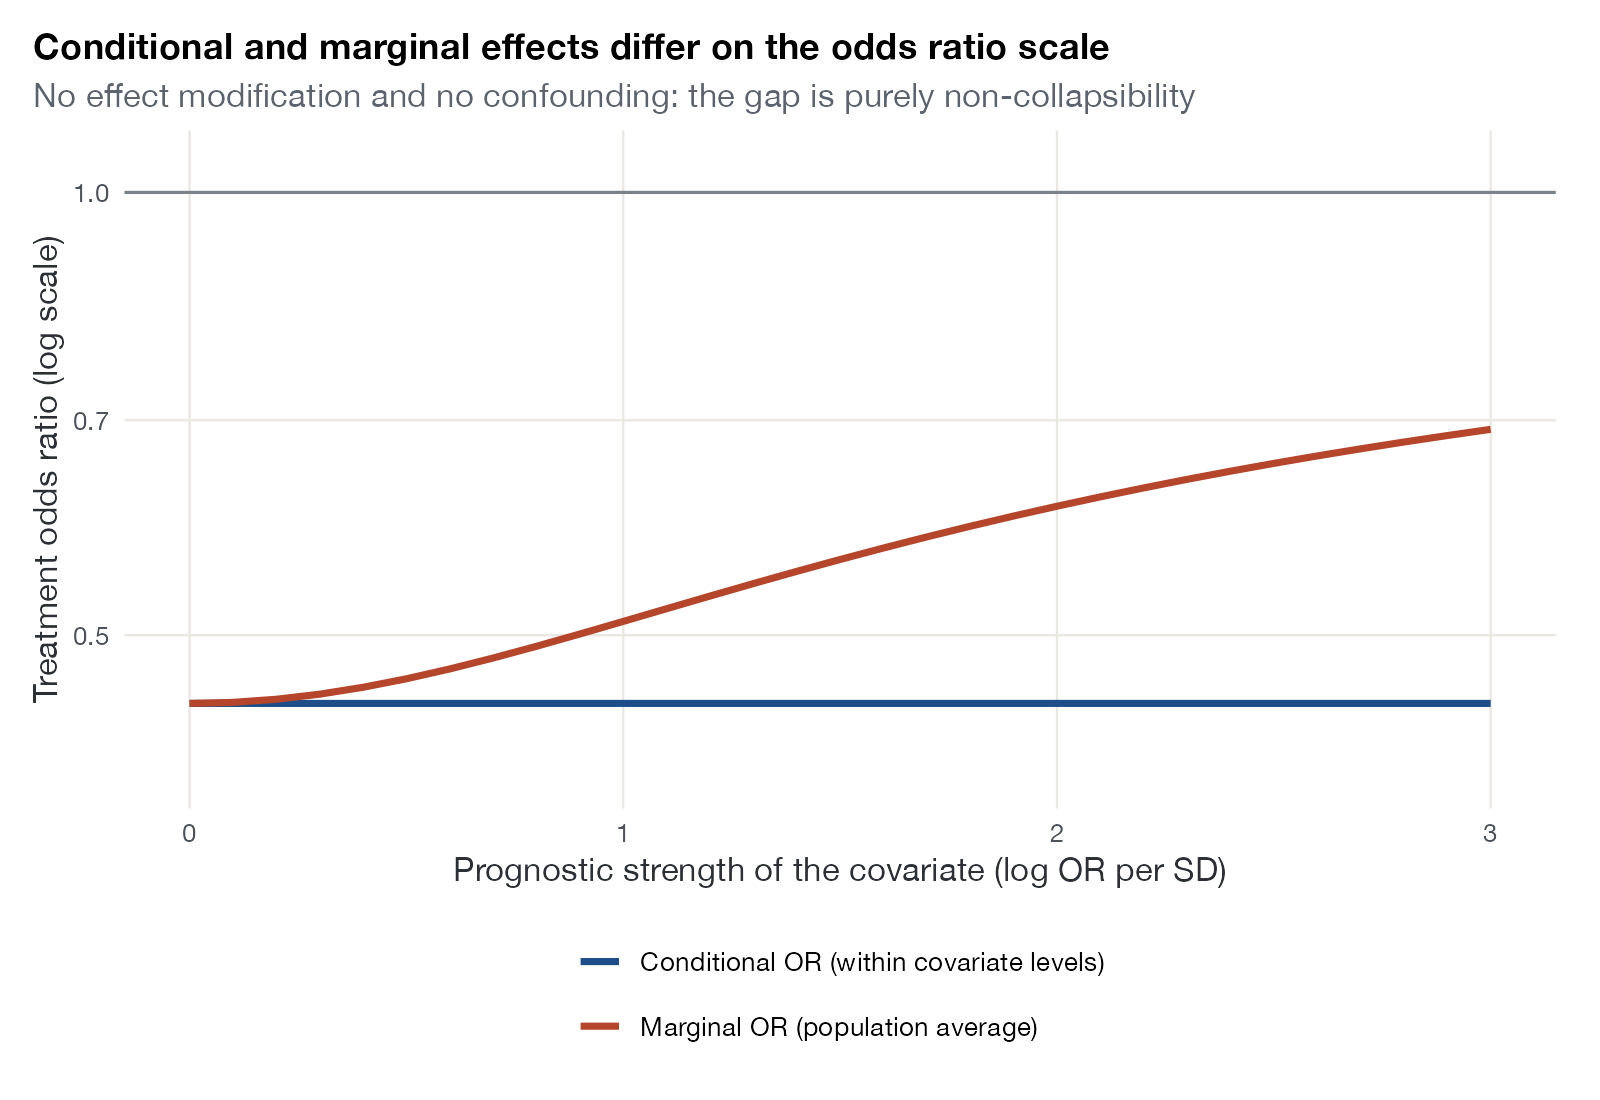
STC fits an outcome regression to individual patient data and uses it to predict outcomes in the comparator trial’s population. Conventional STC plugs the aggregate covariate means into a conditional model, which targets the wrong estimand on non-collapsible scales such as the odds or hazard ratio; G-computation integrates over the covariate distribution to produce a marginal effect. The key graphics therefore check the outcome model and show how much it extrapolates.
Minimum graphical set
- Covariate support: multivariate support plot.
- Outcome model checks: partial effect plot, residual plot, and calibration plot.
- The estimand: conditional versus marginal effect plot and marginal effects by target population.
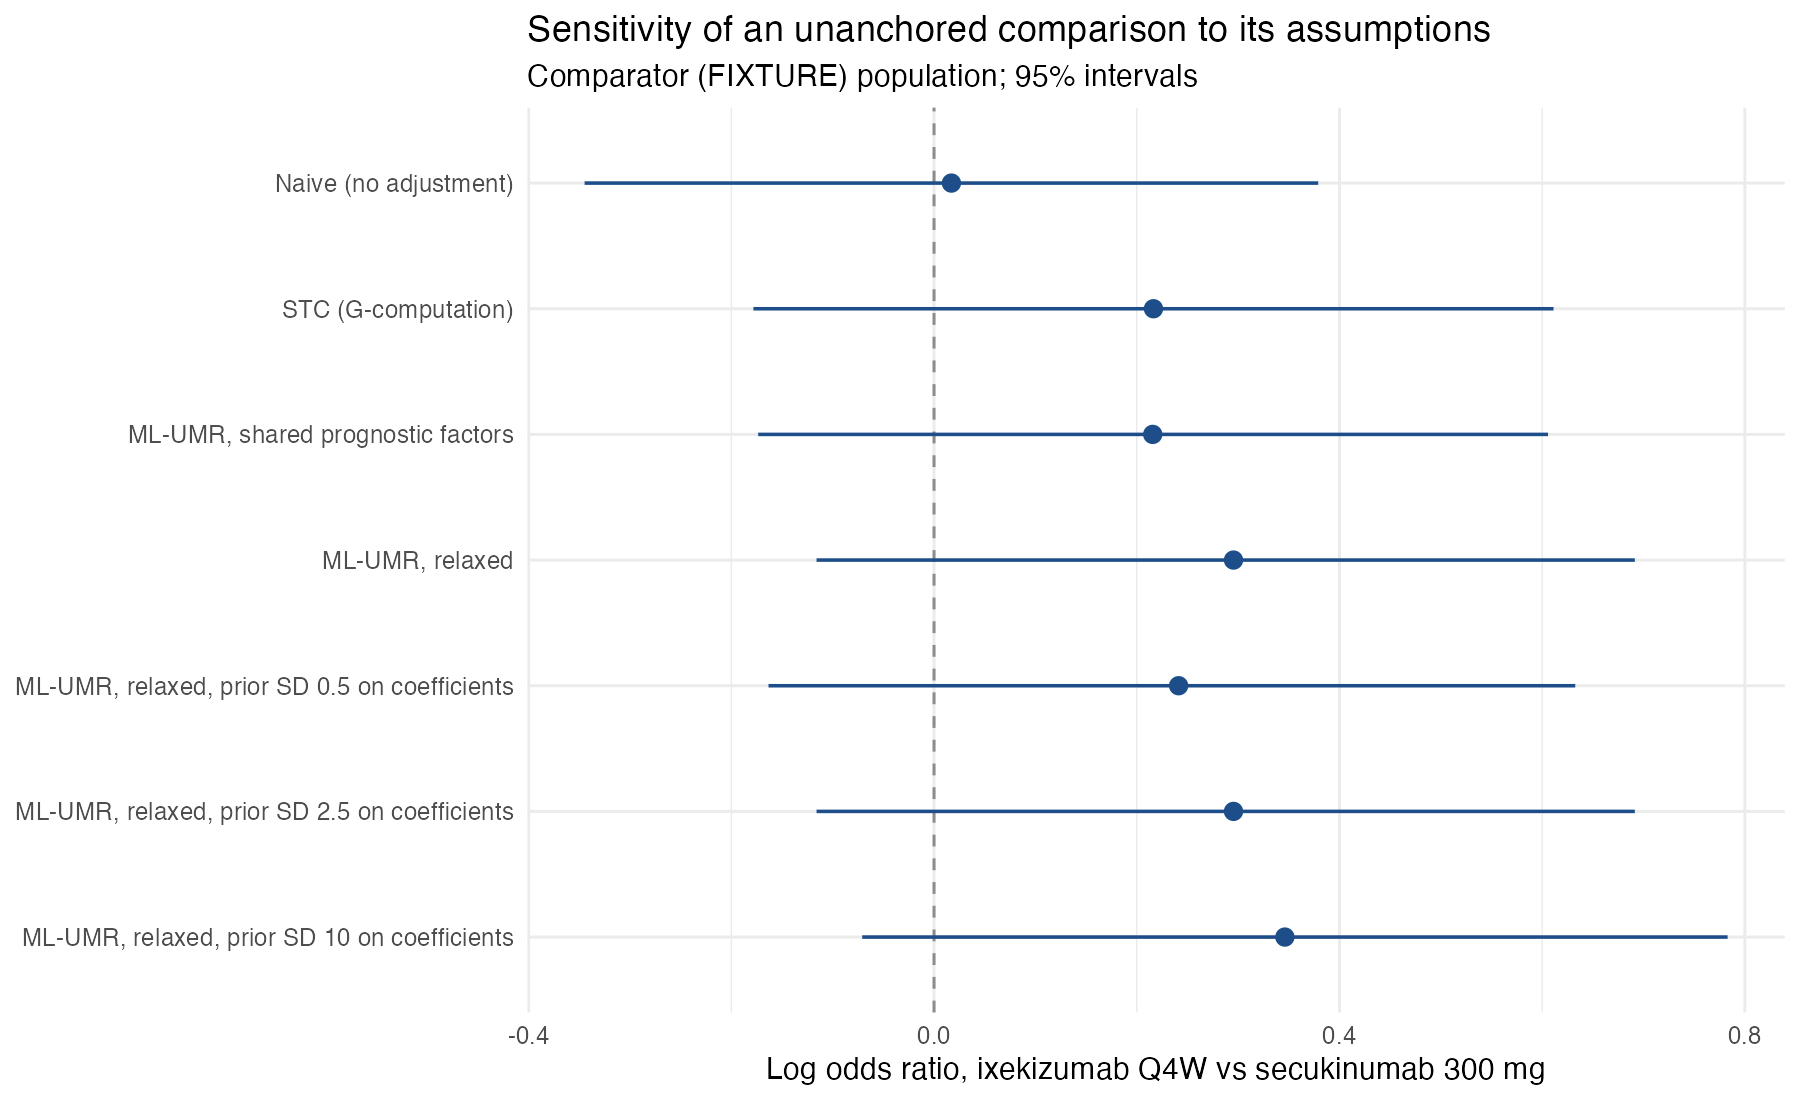
- For unanchored STC, an assumption sensitivity plot.
All plots for STC and G-computation
Effect display
Estimates, intervals, and pooled summaries: the forest plot and its many descendants.
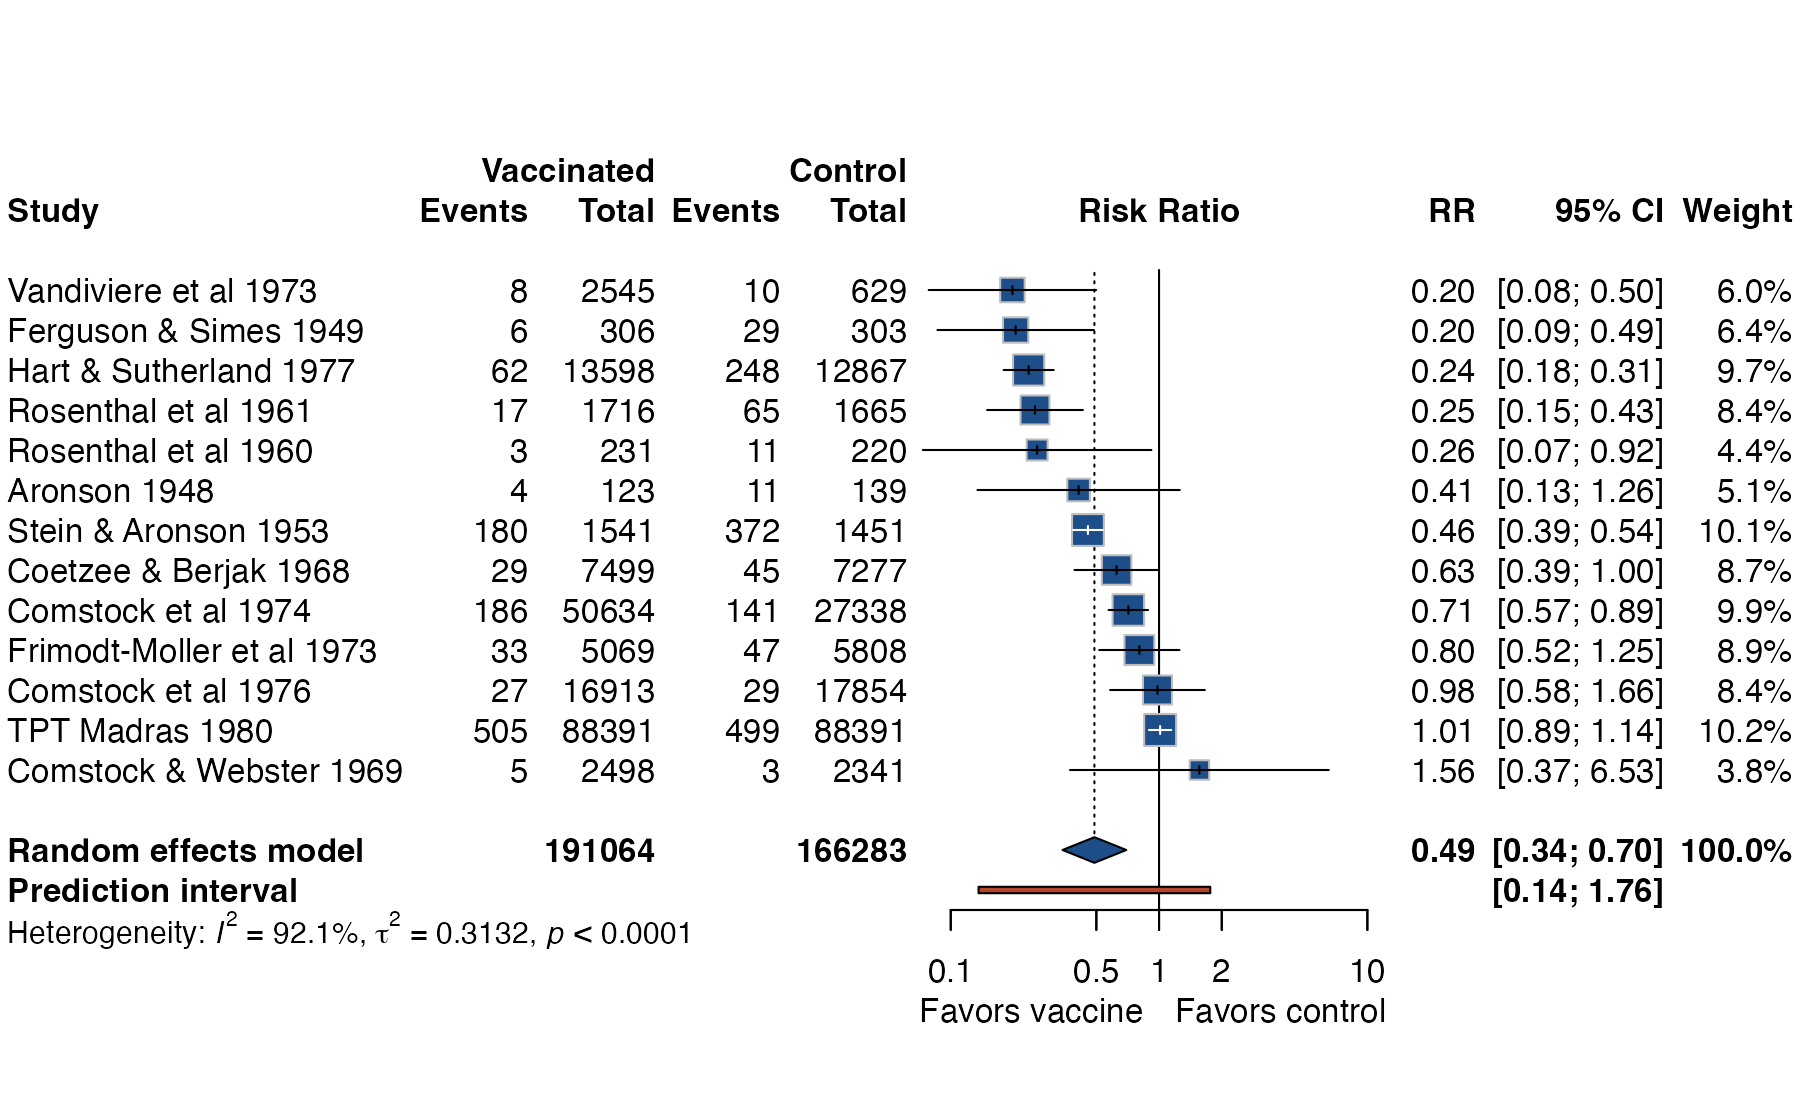
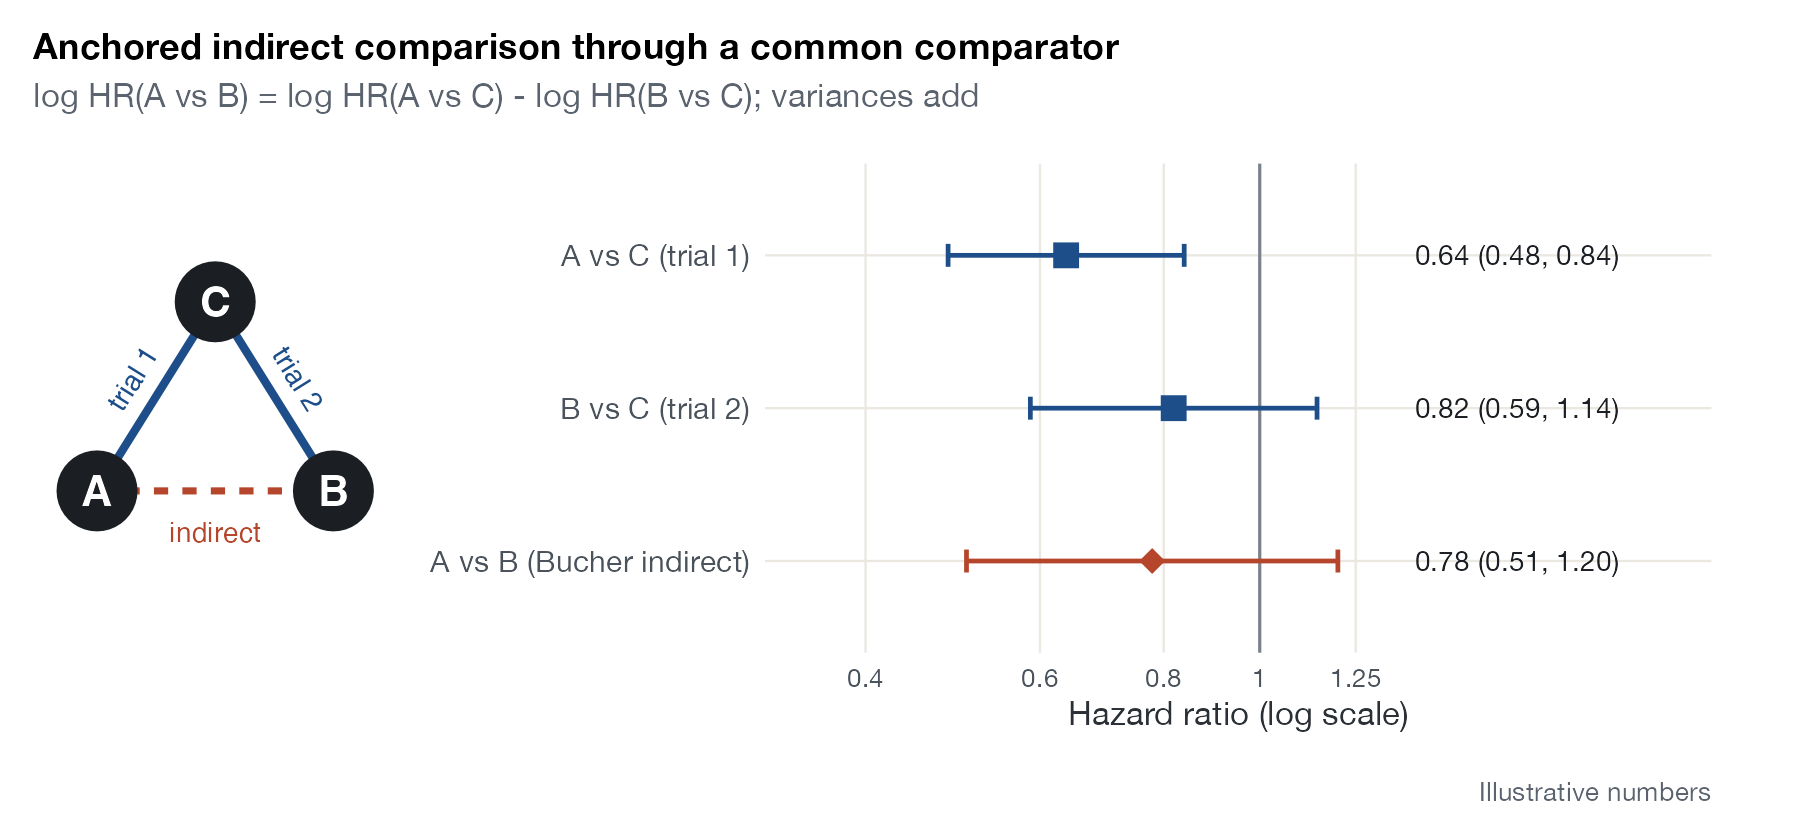
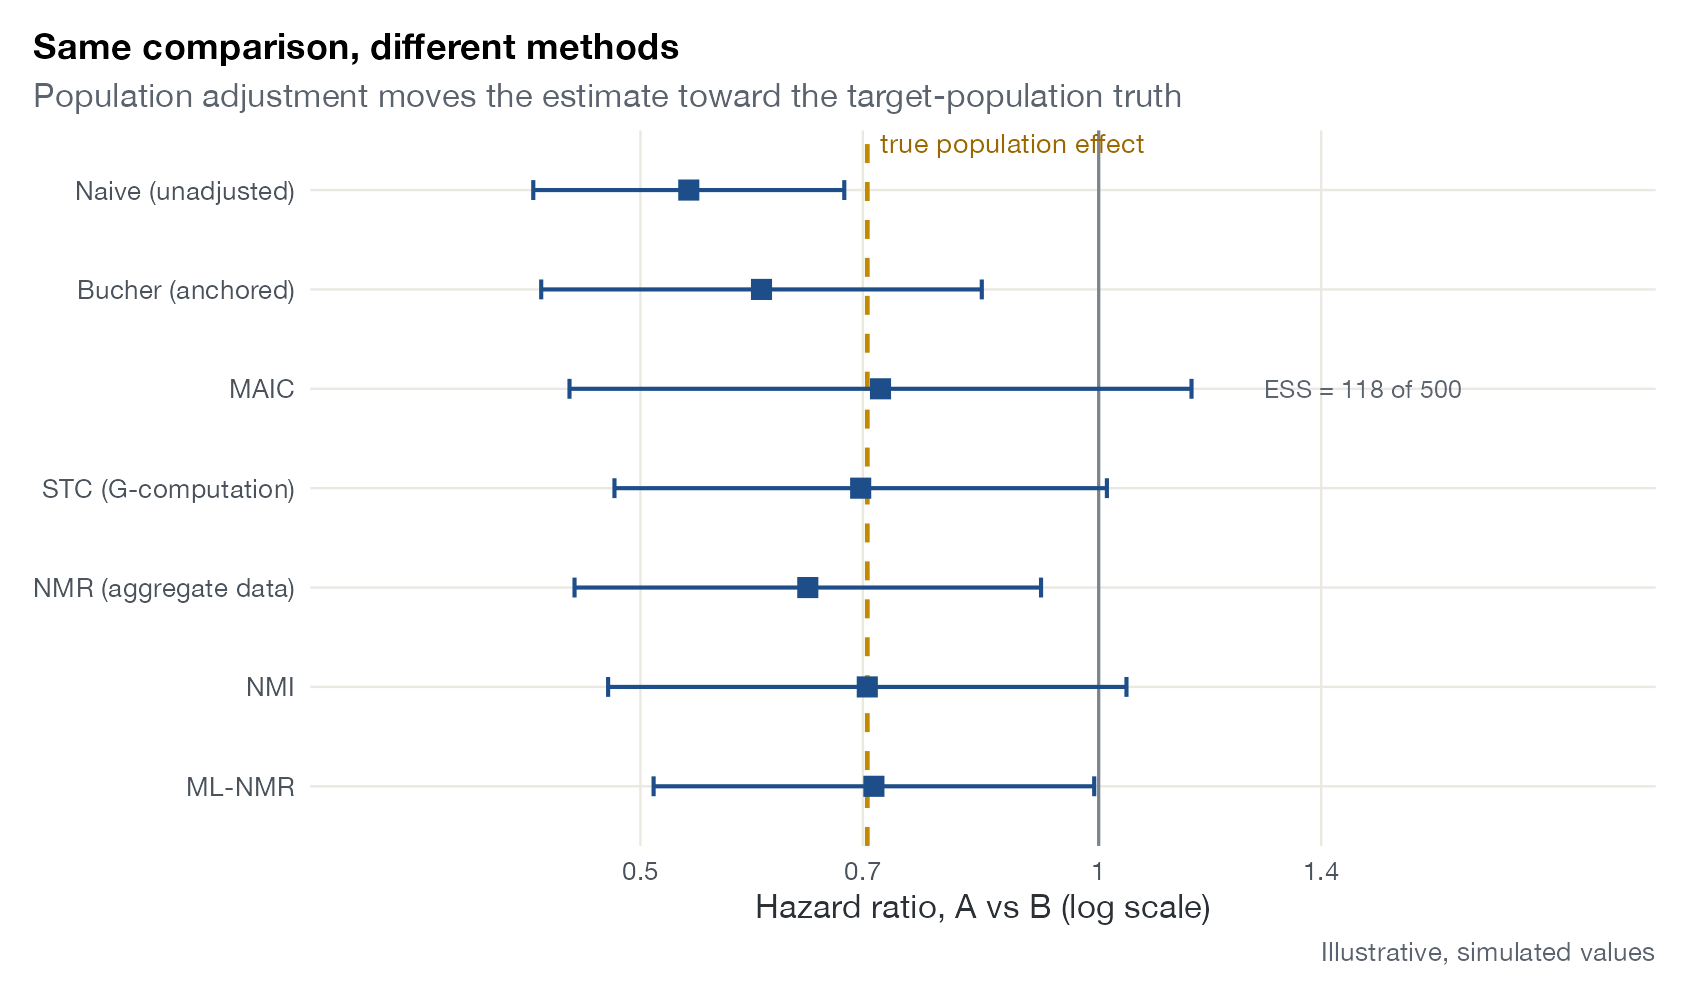
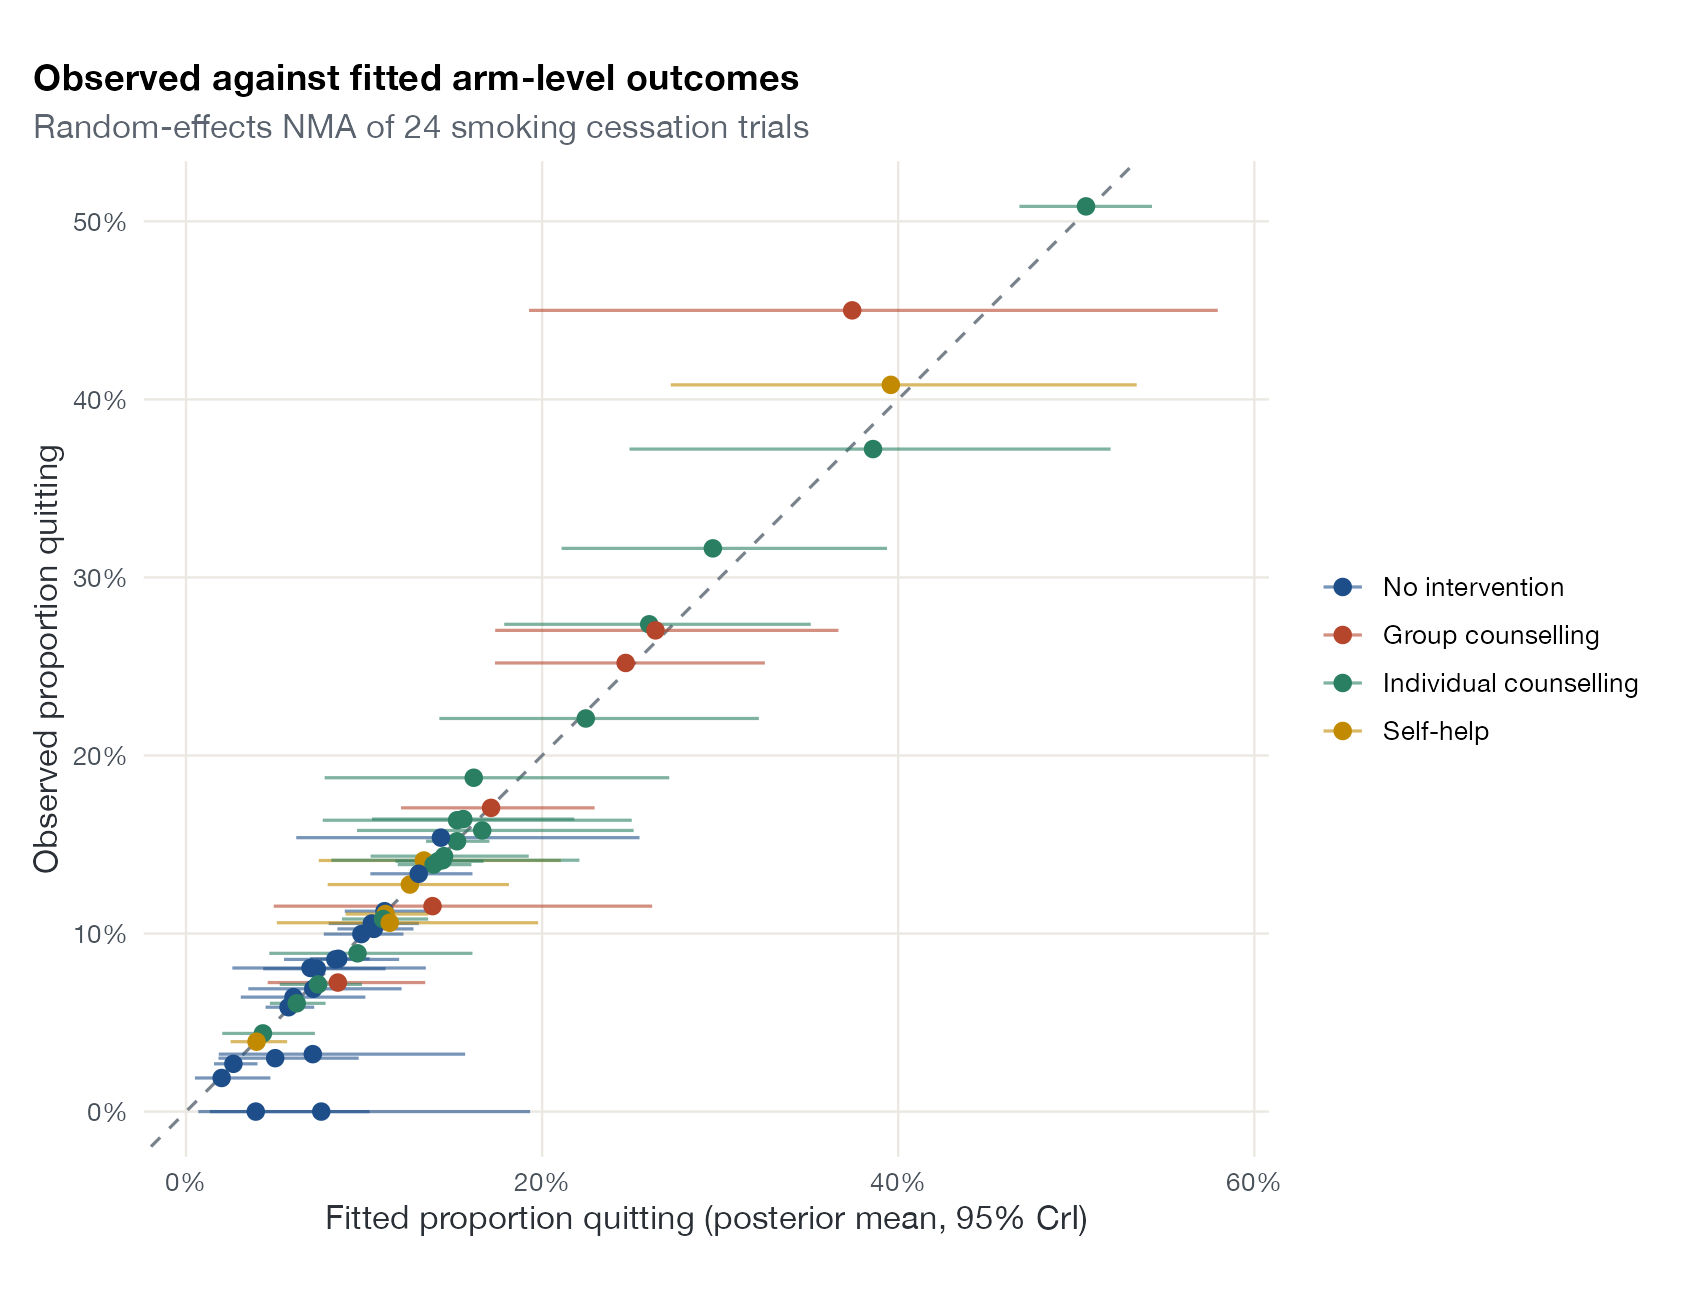
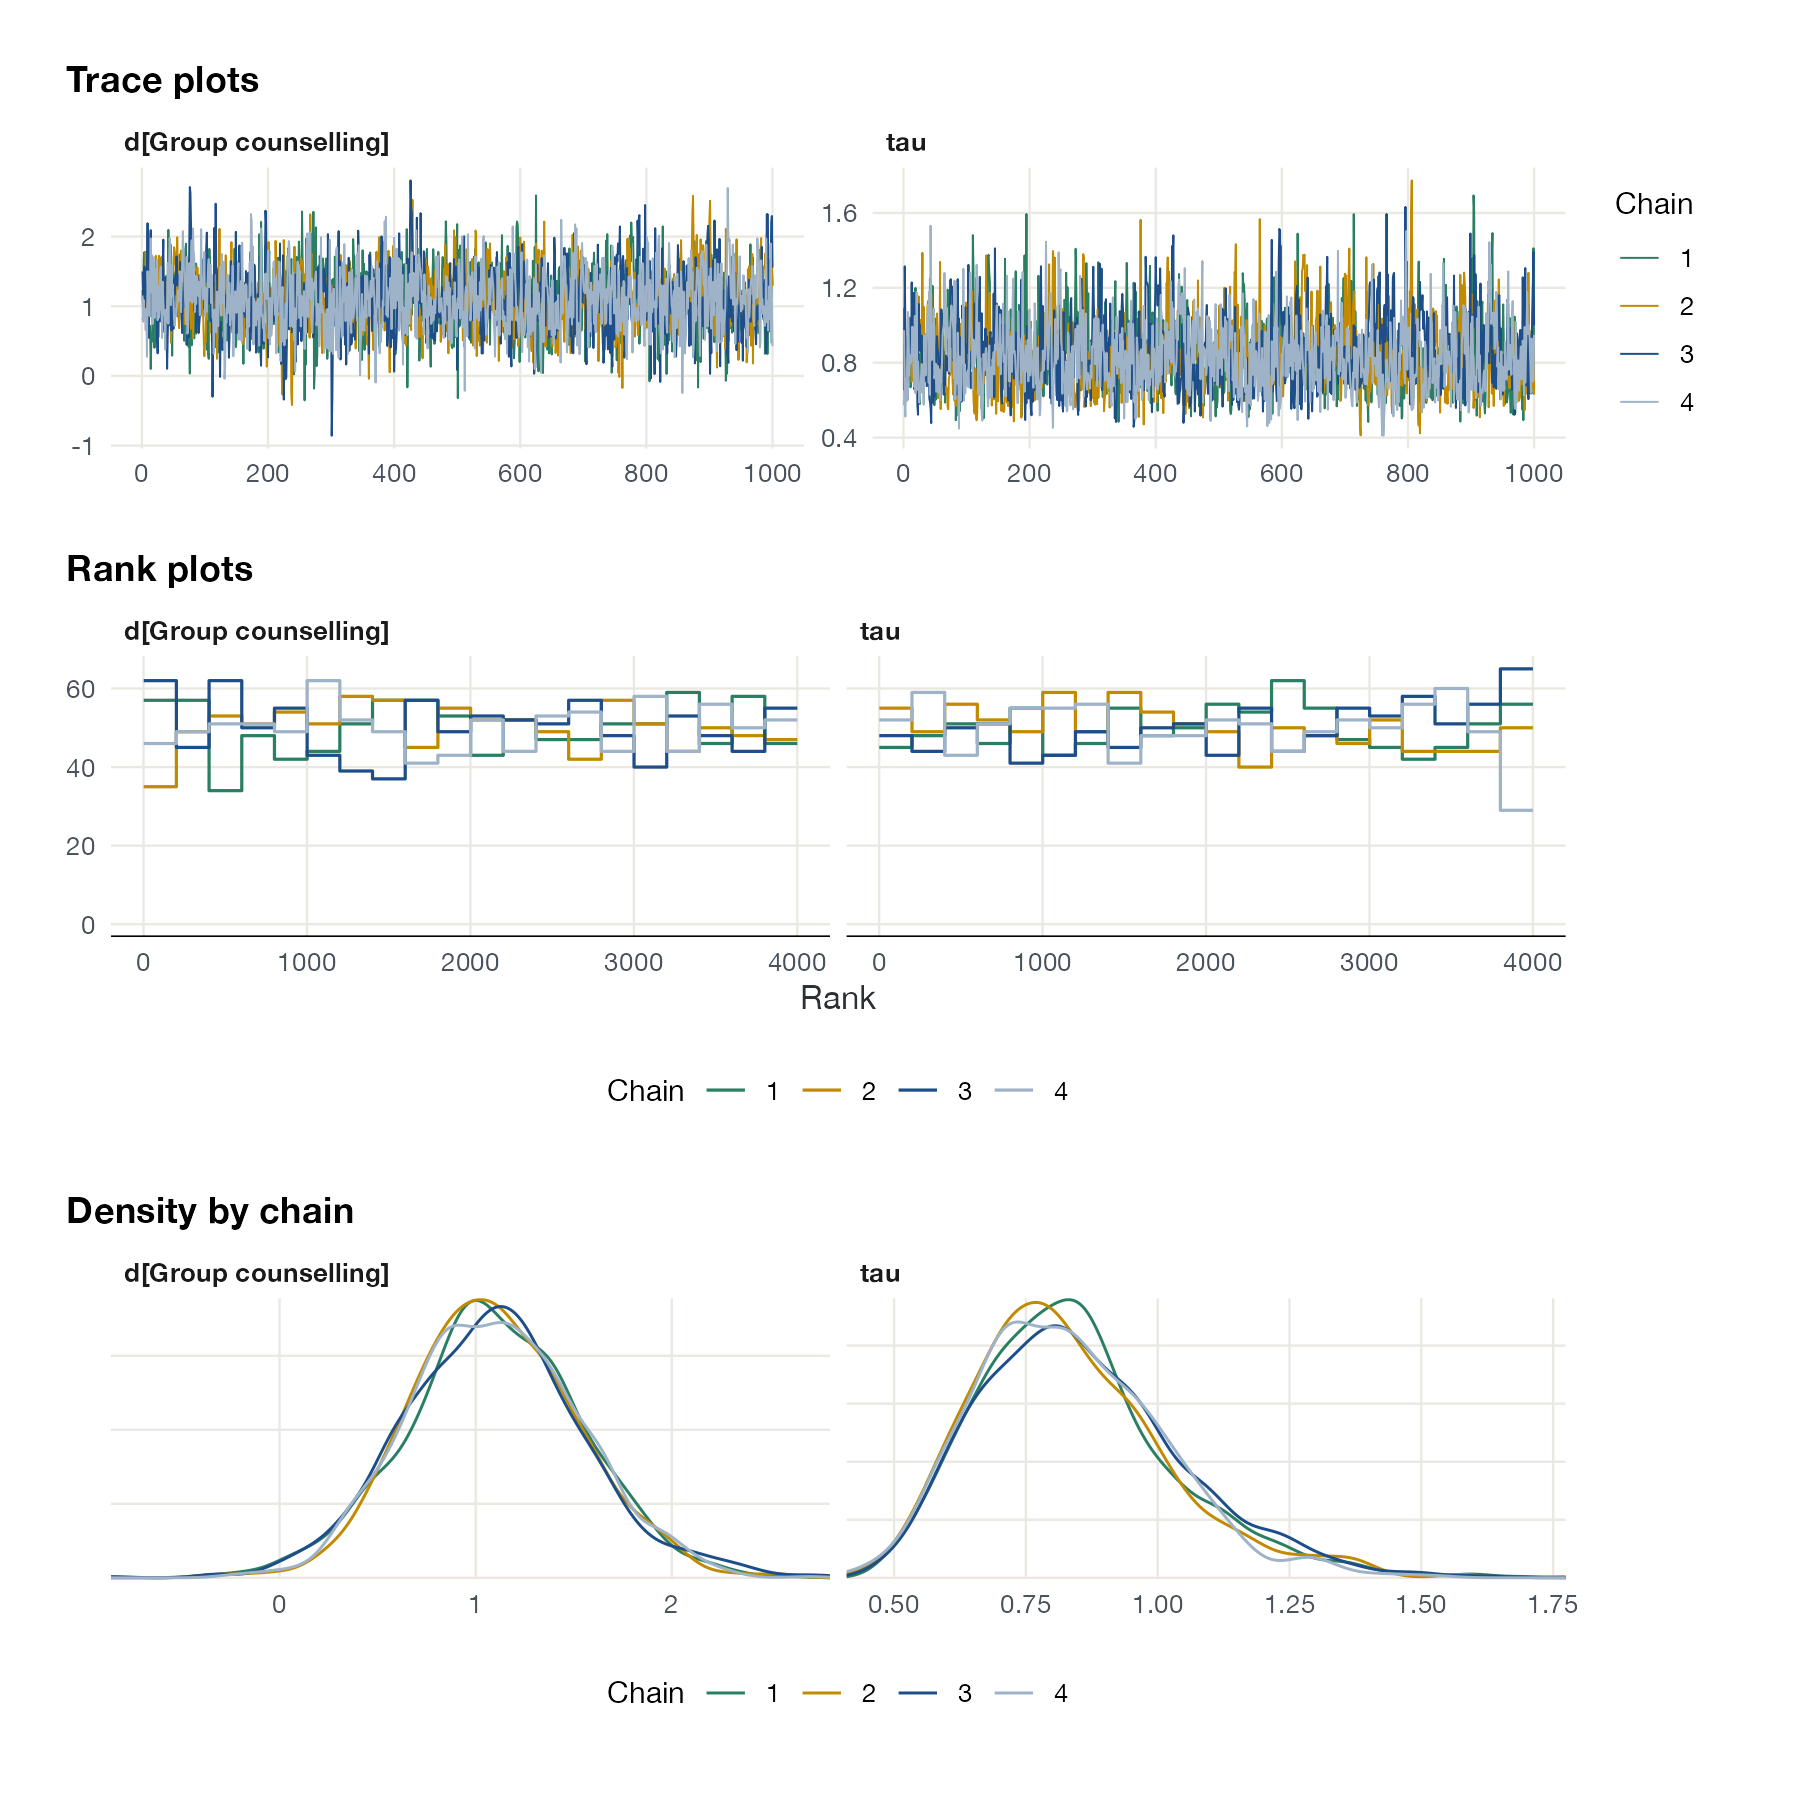
Model checking and Bayesian diagnostics
Residuals, fit, predictive checks, and the computational health of Bayesian models.
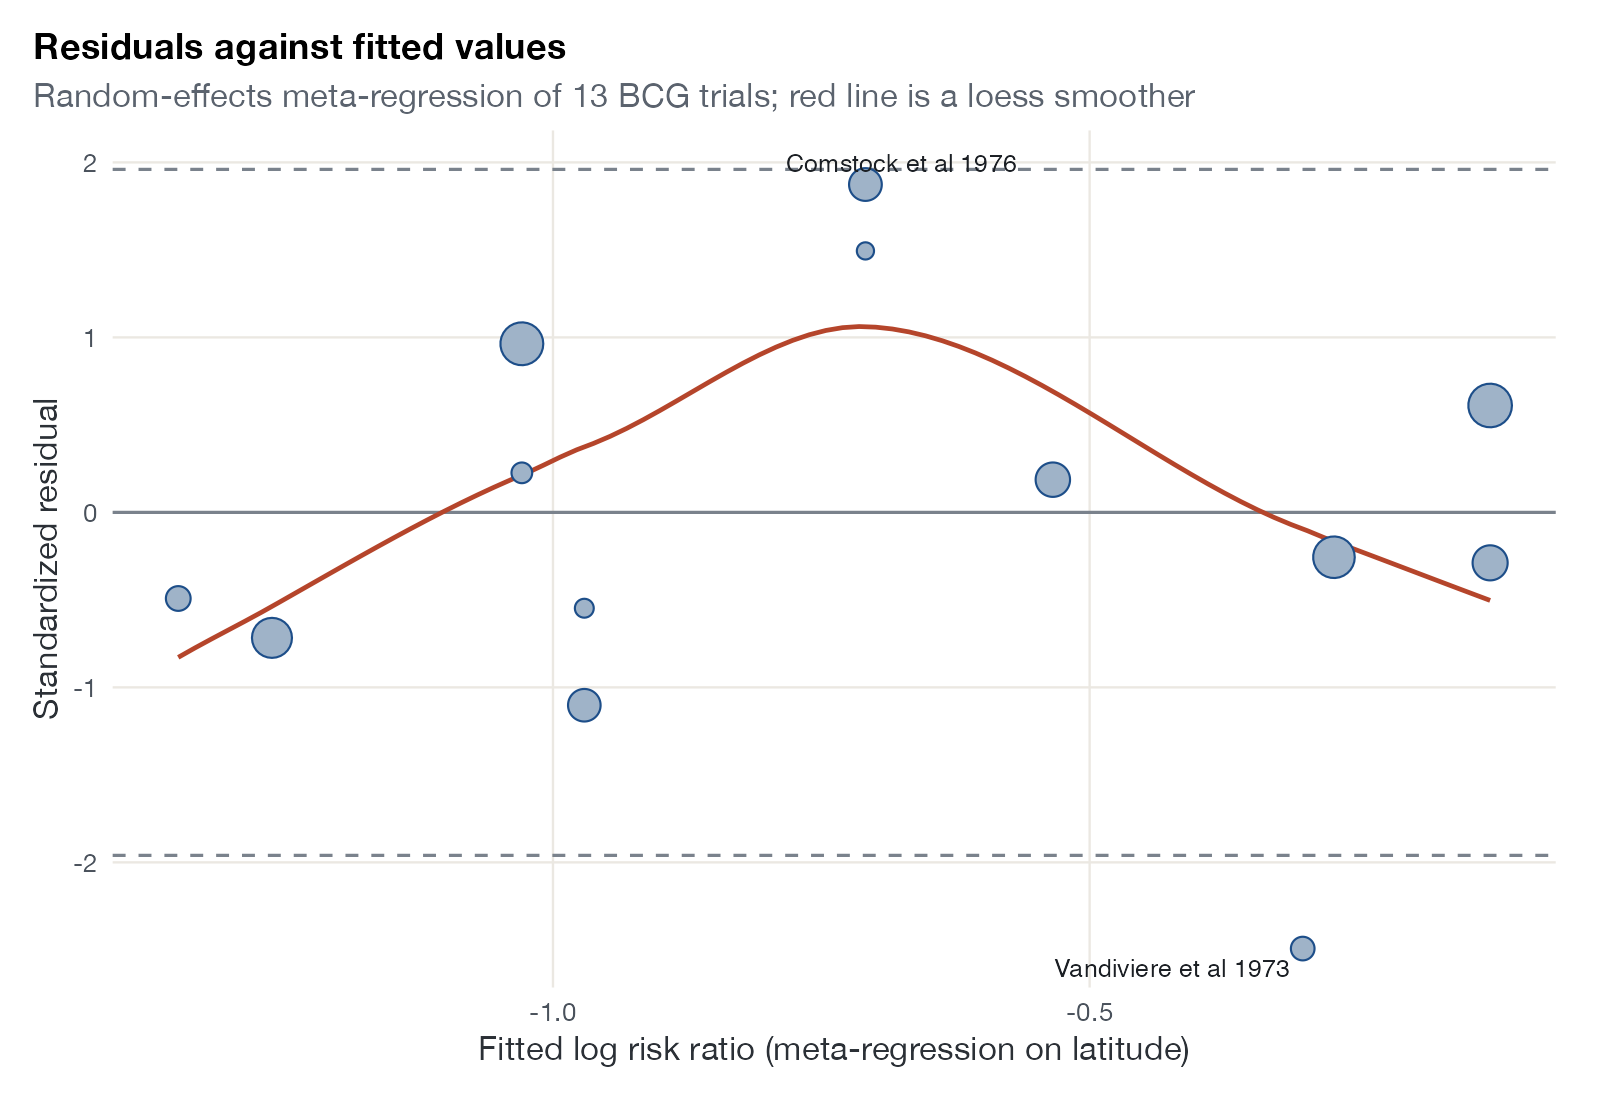
Weighting, balance, and overlap
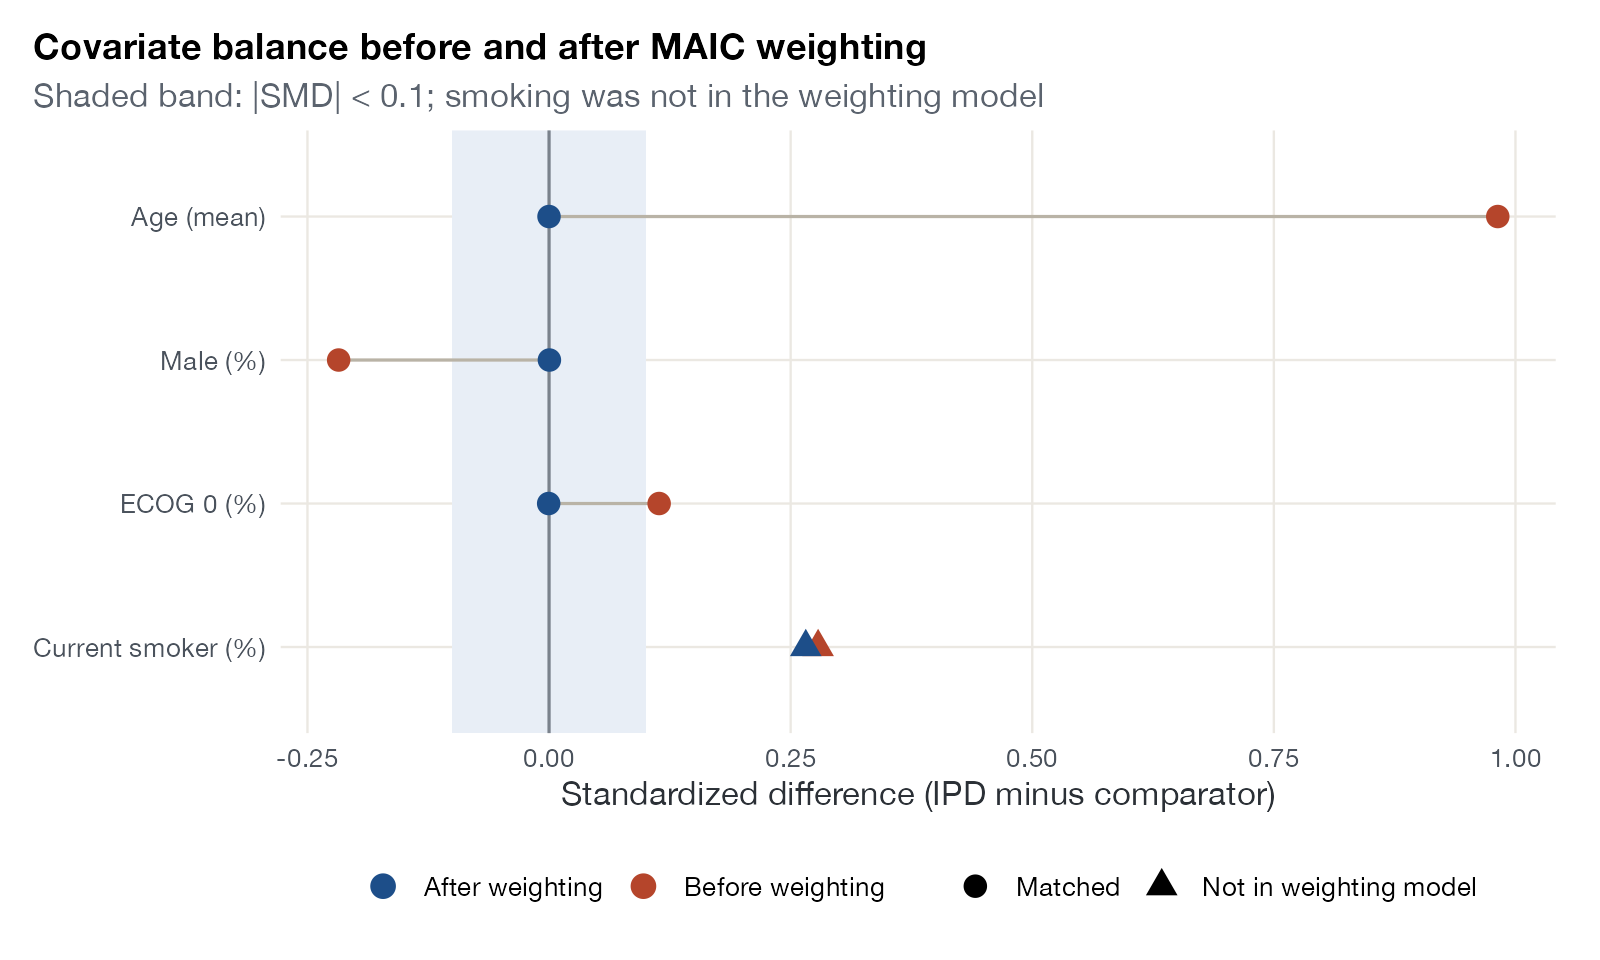
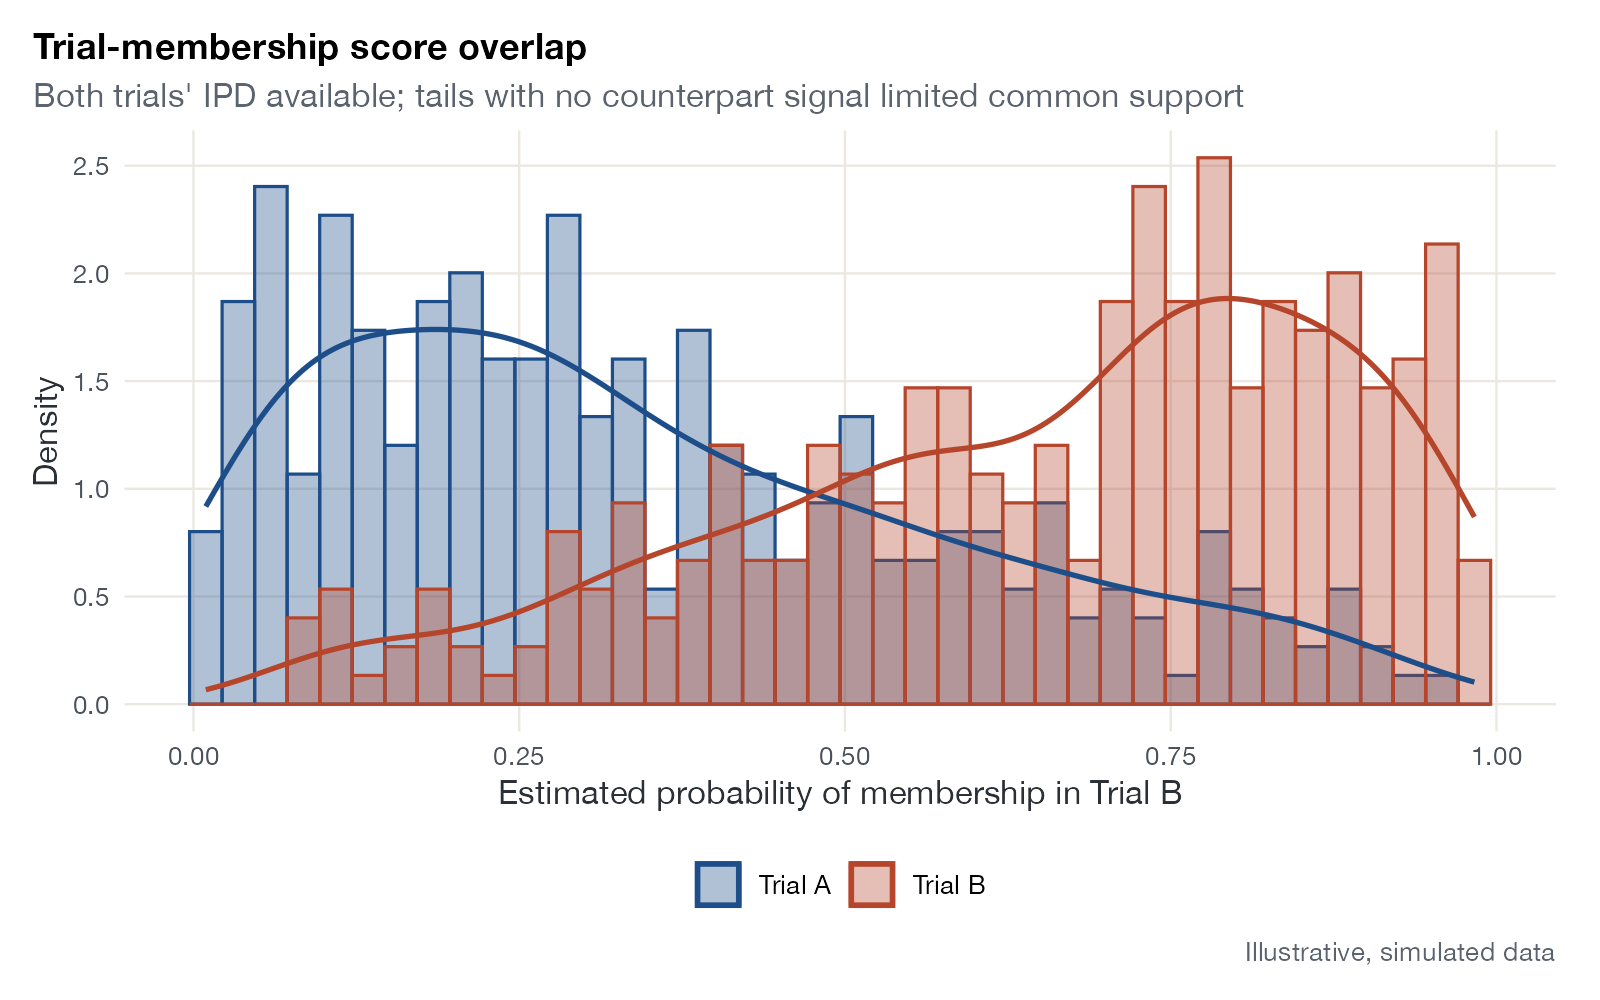
MAIC diagnostics: what the weights did, how much information survived, and whether populations overlap.
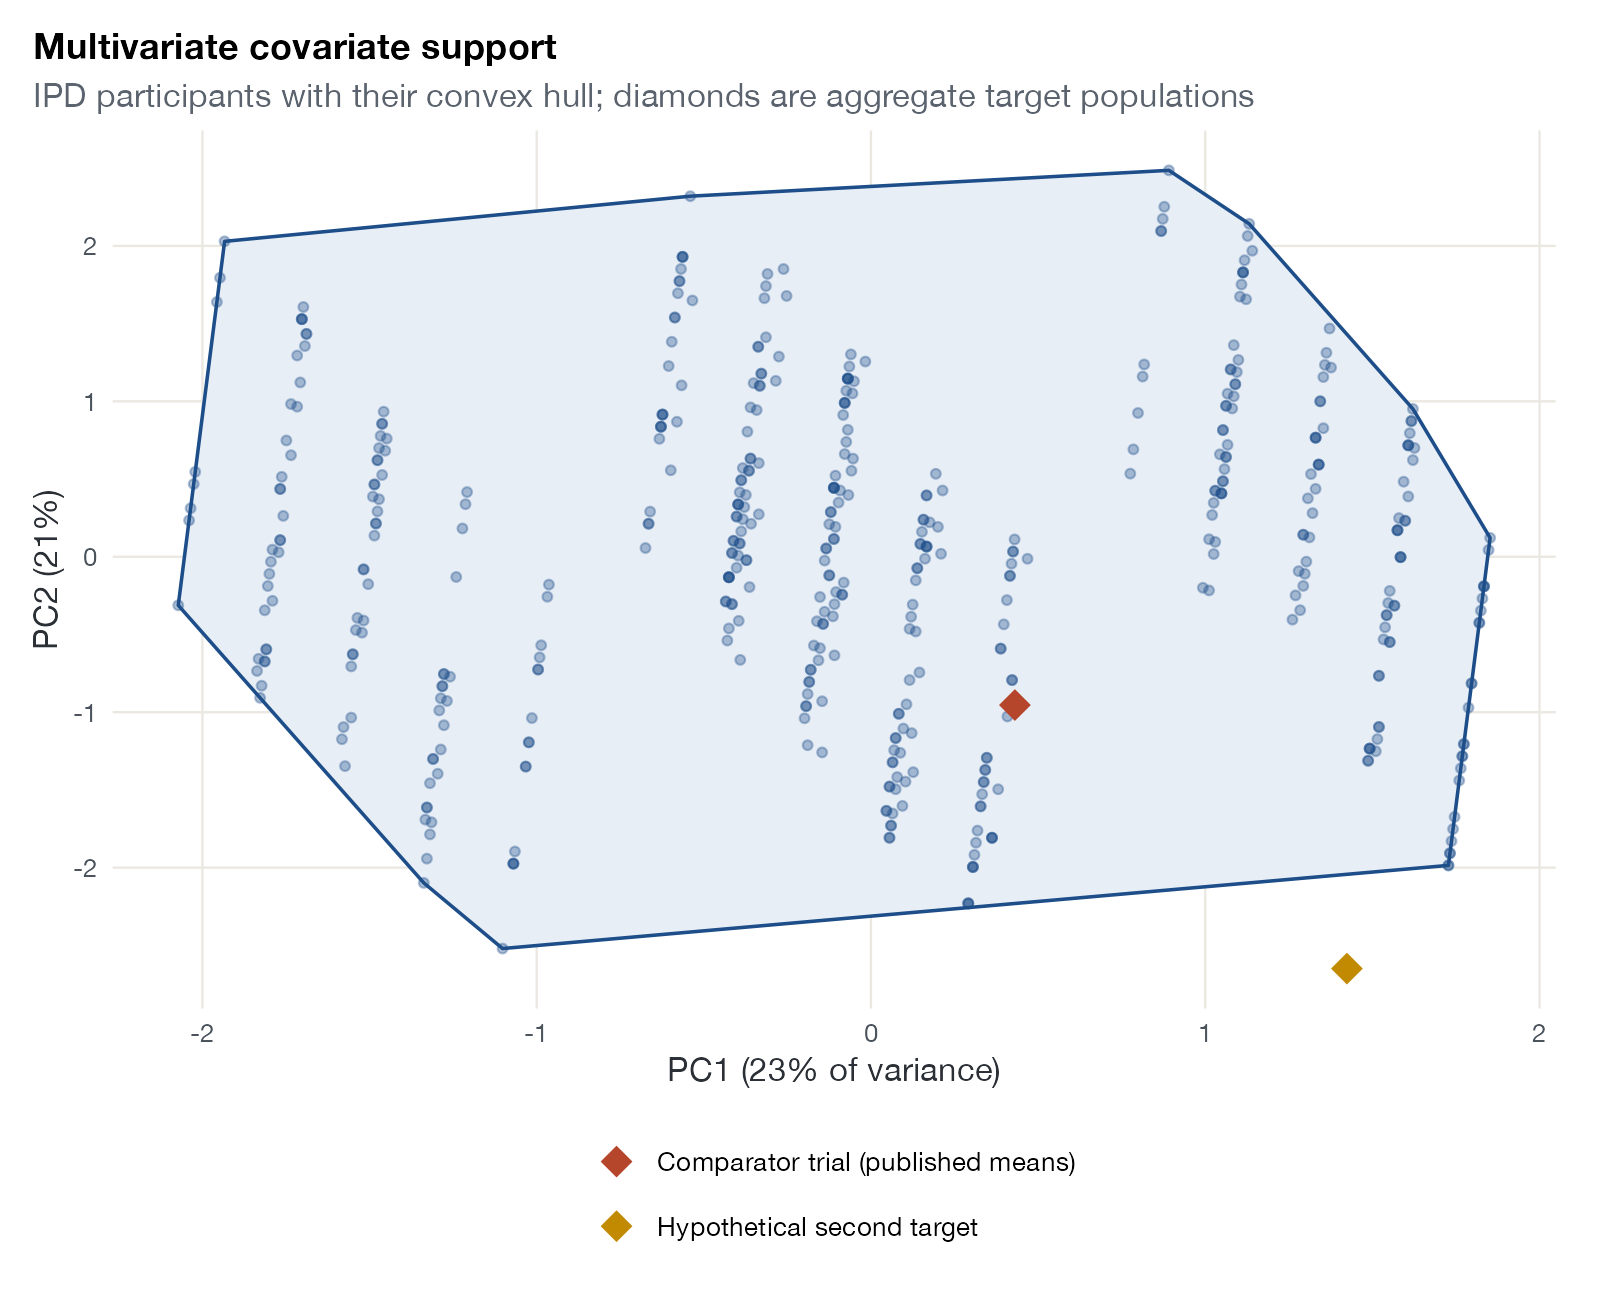
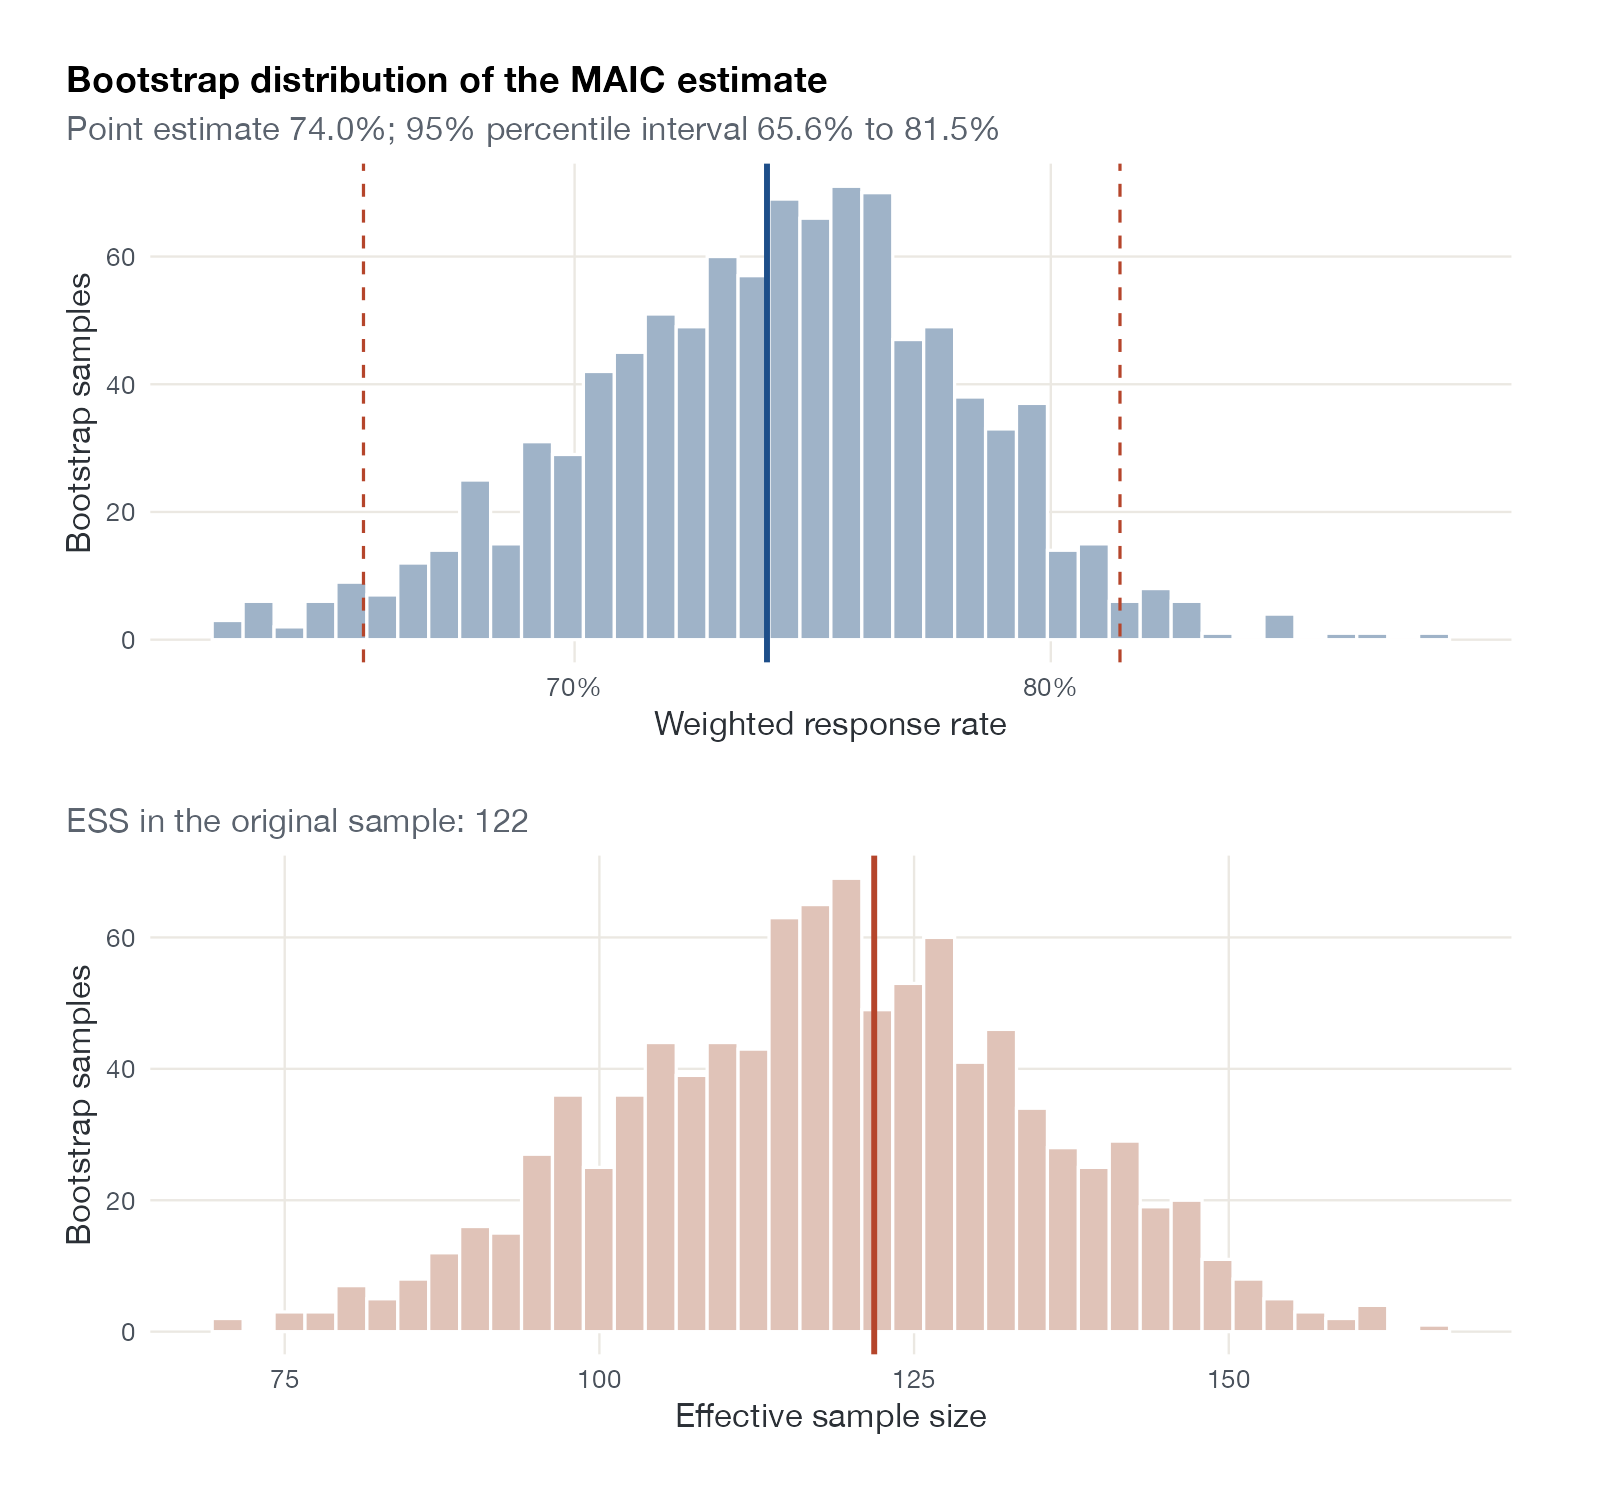
Outcome regression and transportability
STC and G-computation diagnostics: functional form, extrapolation, and effects in a target population.
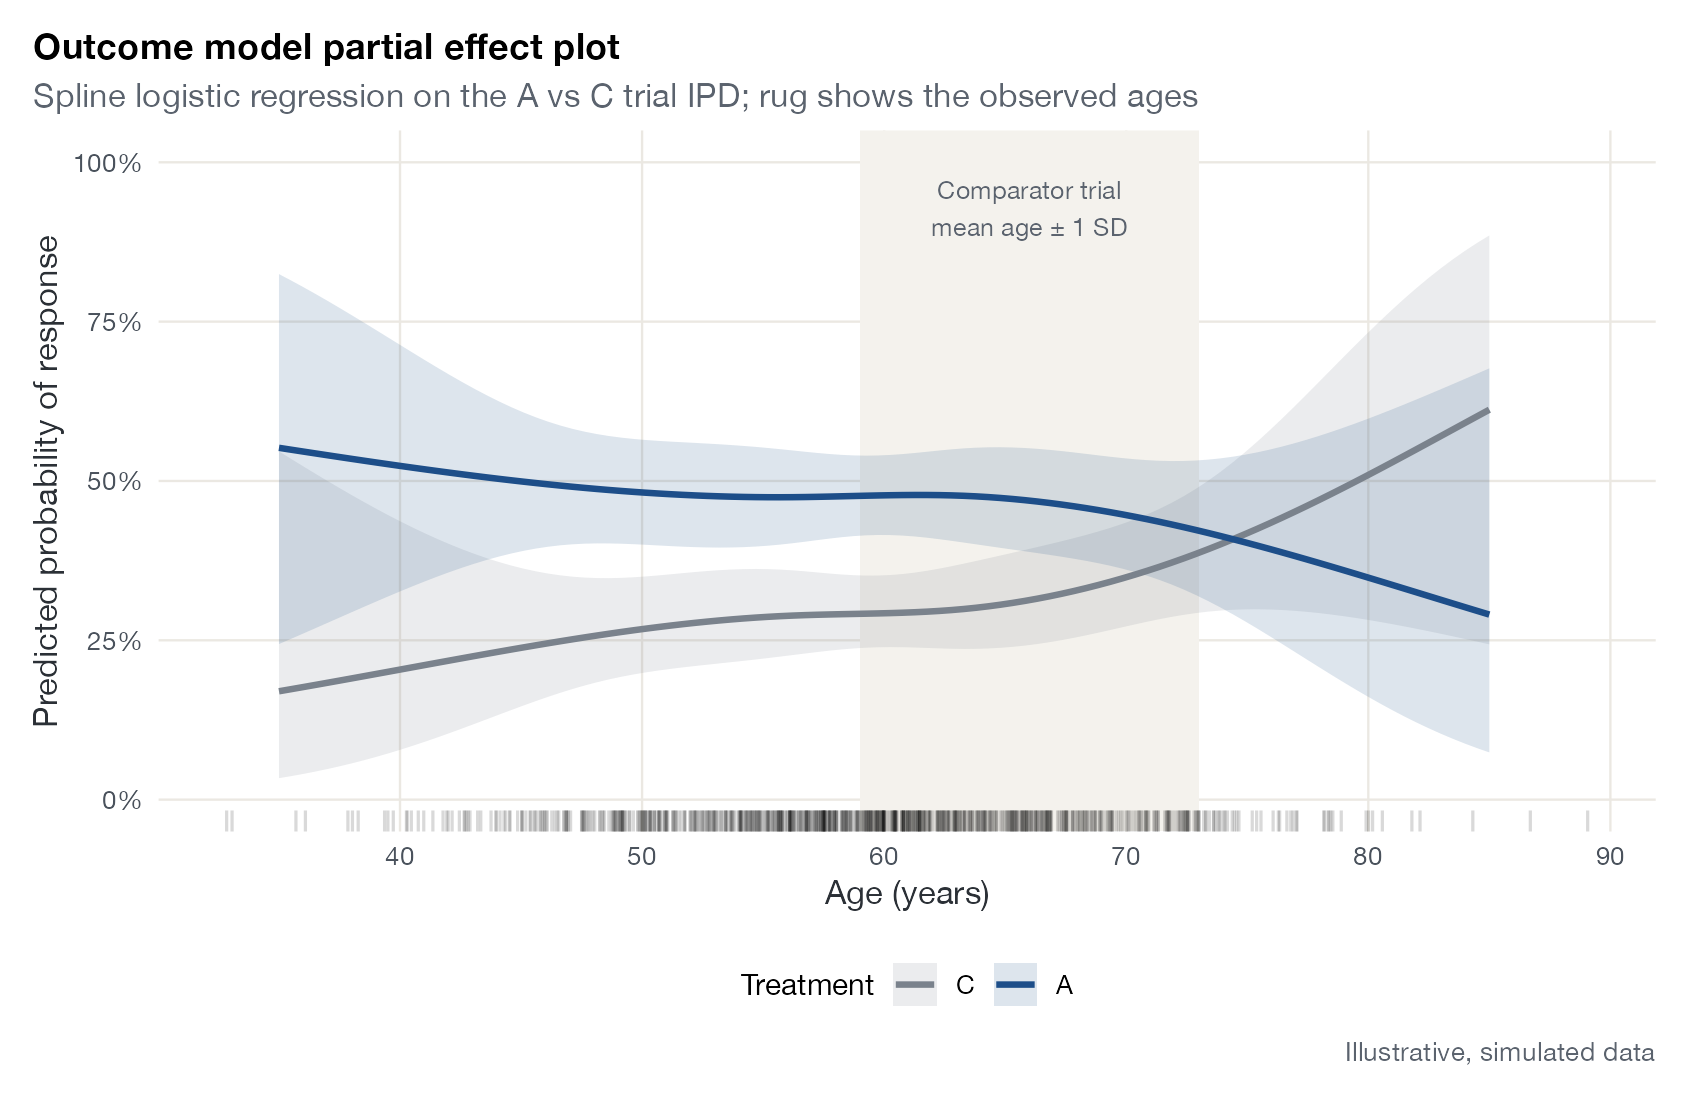
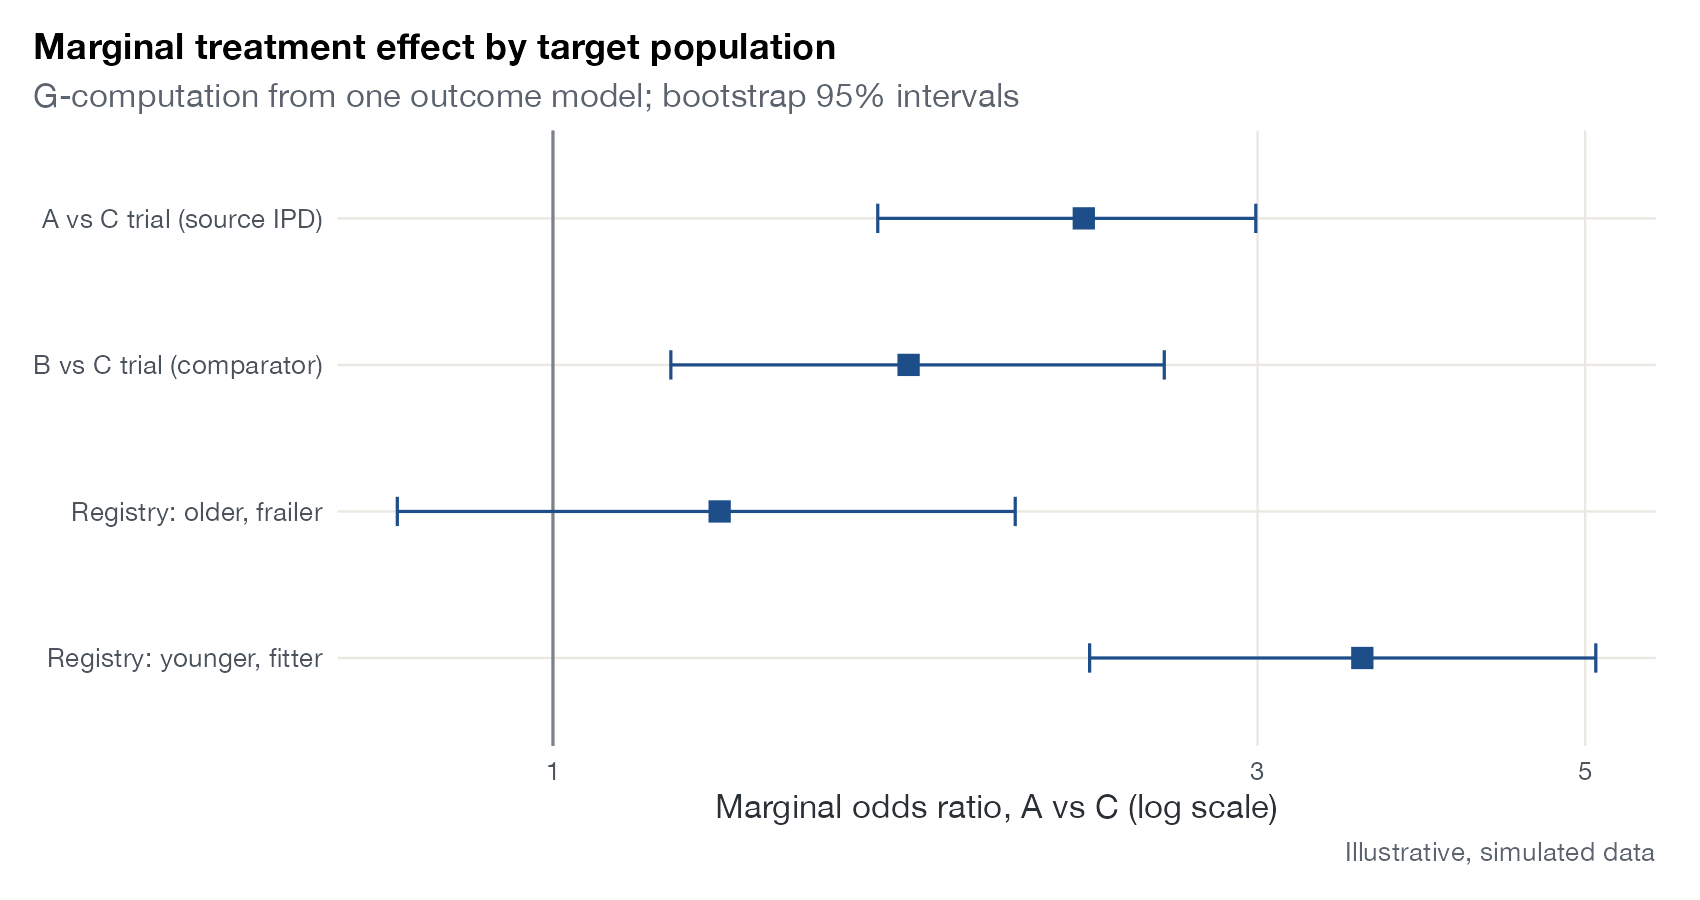
Multilevel network meta-regression
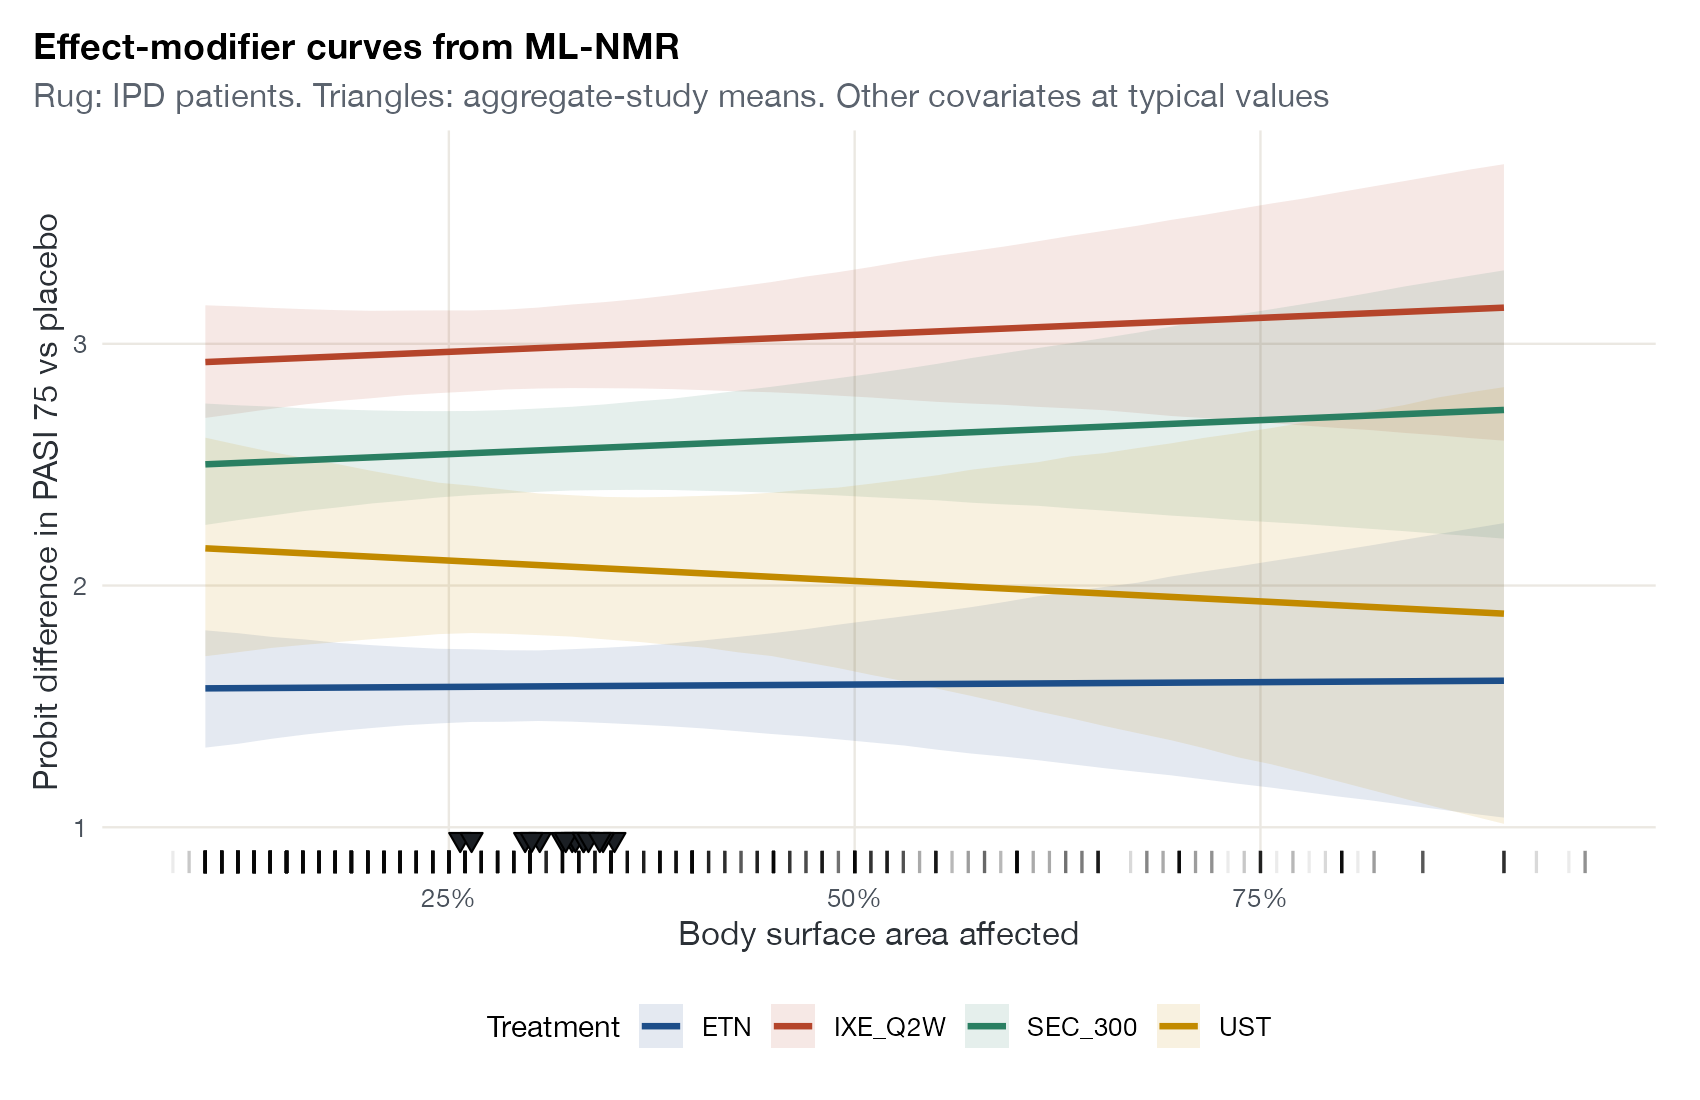
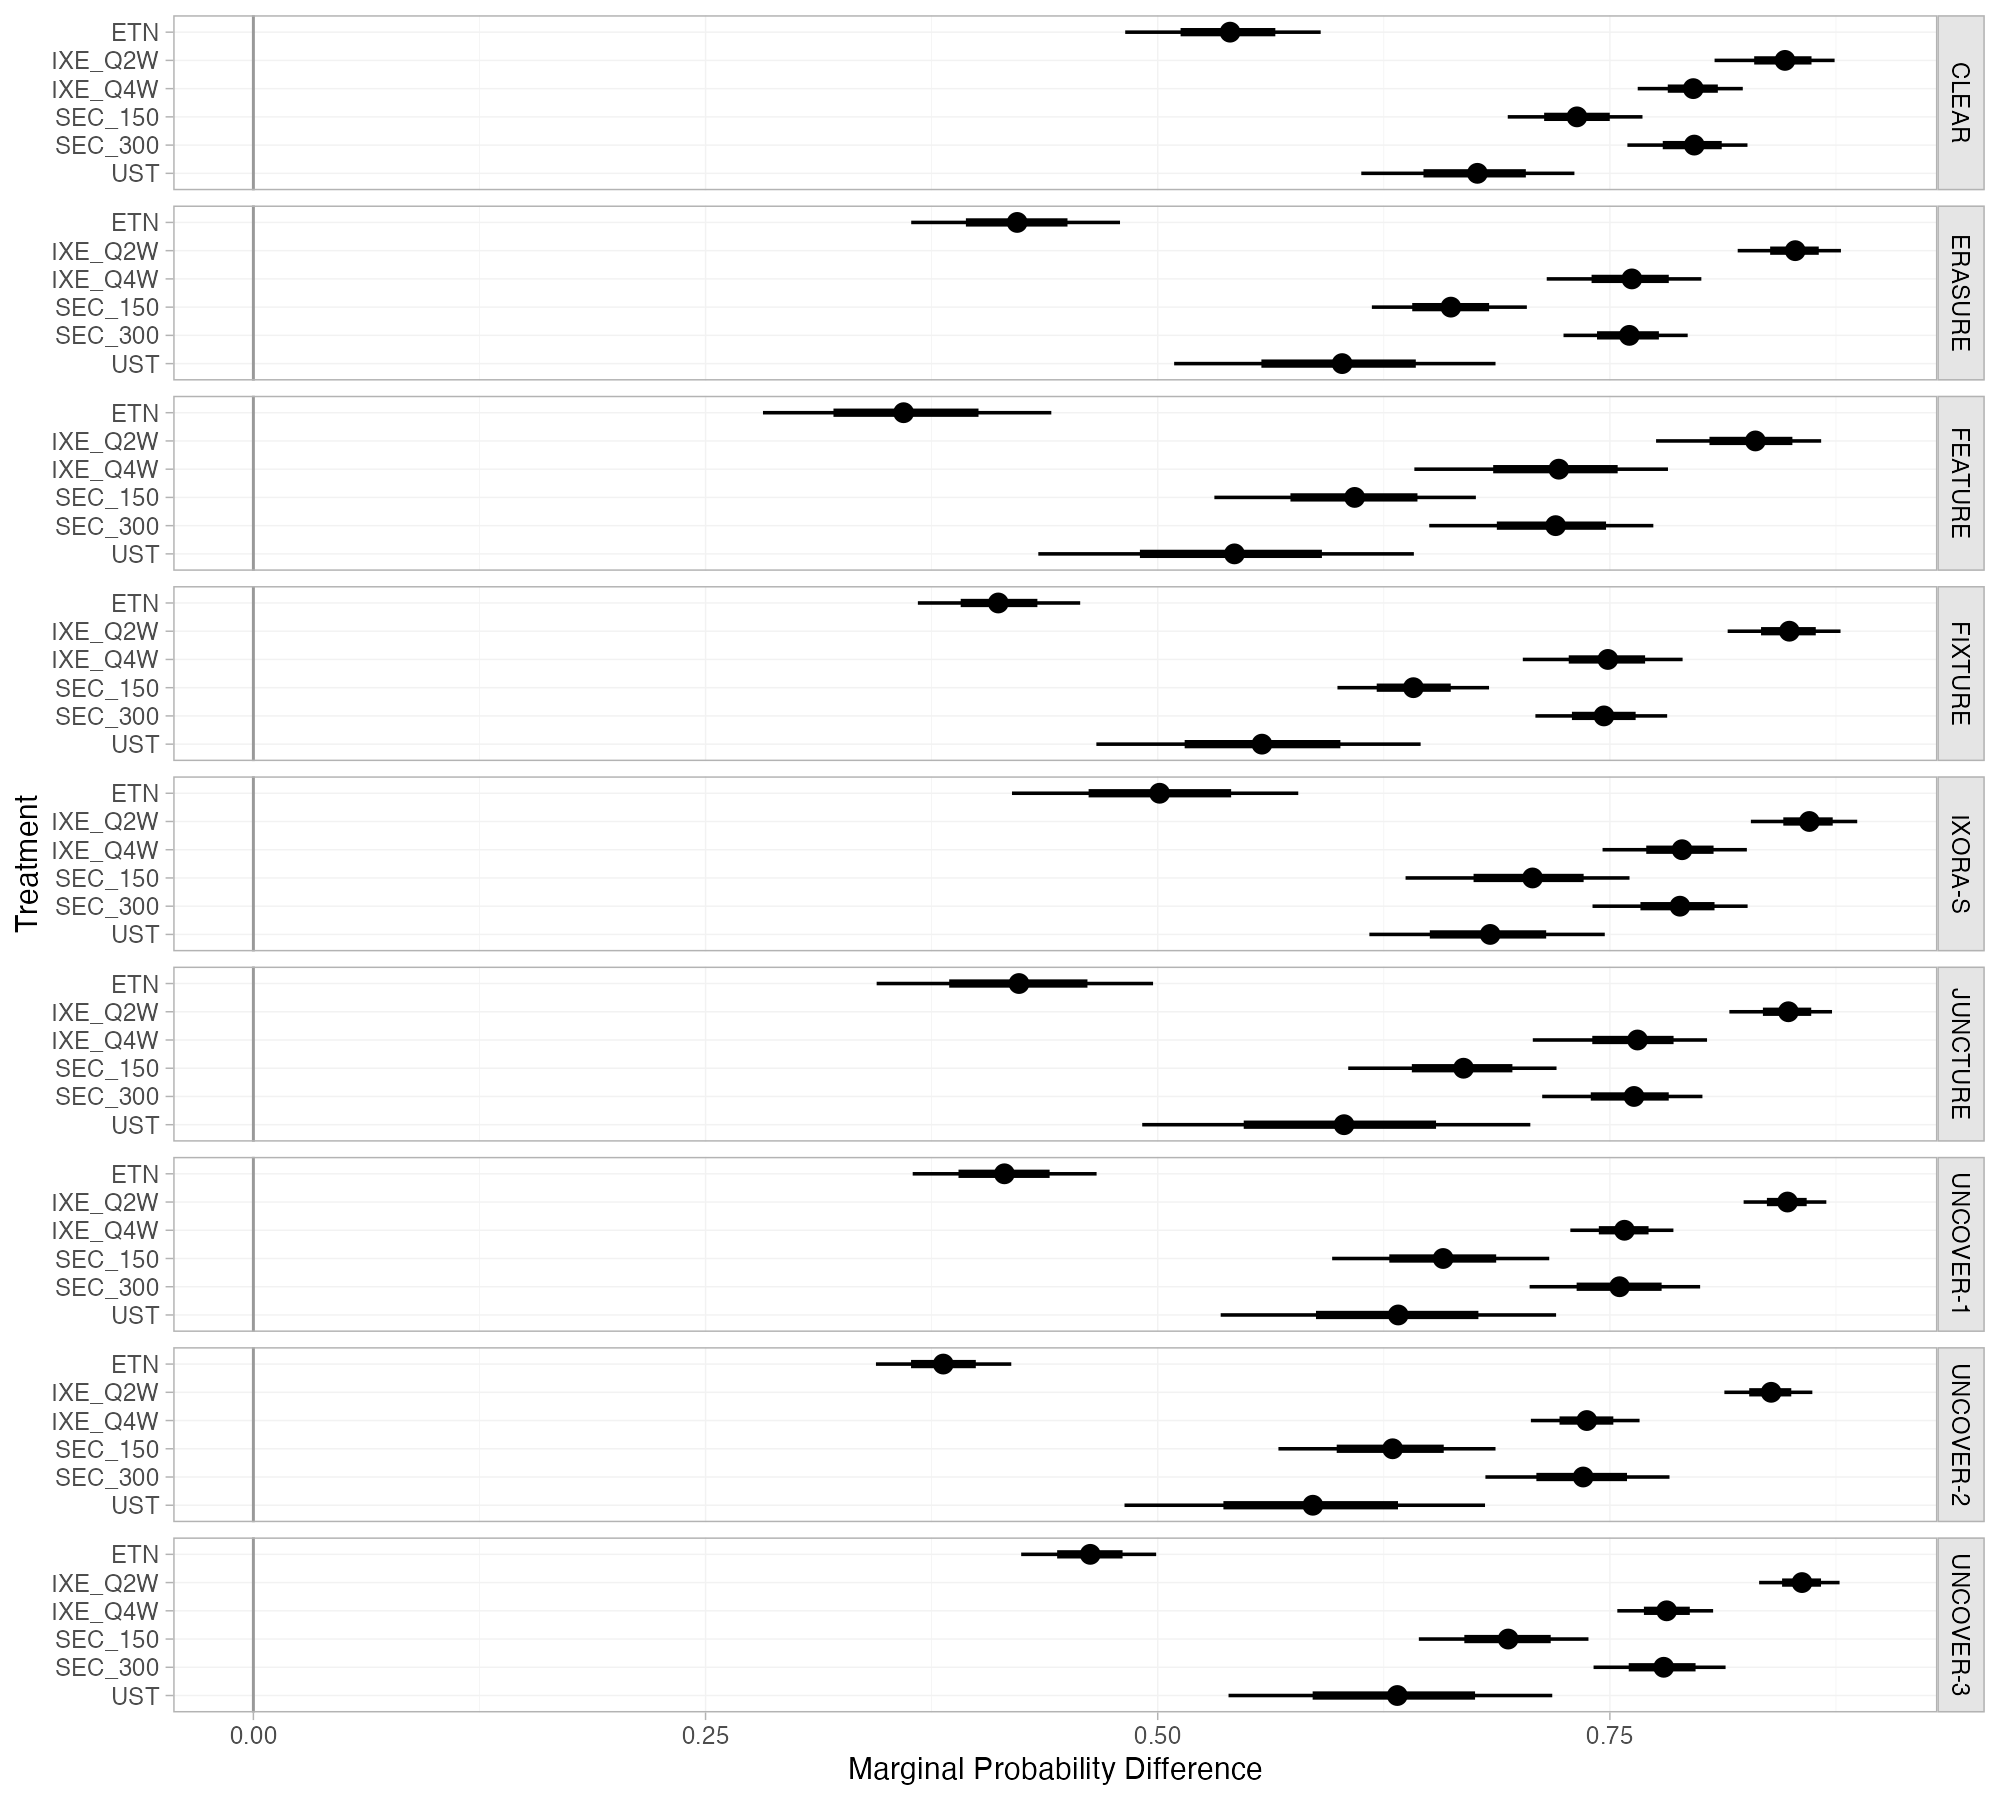
ML-NMR graphics for mixed IPD and aggregate networks, numerical integration, and population-specific effects.
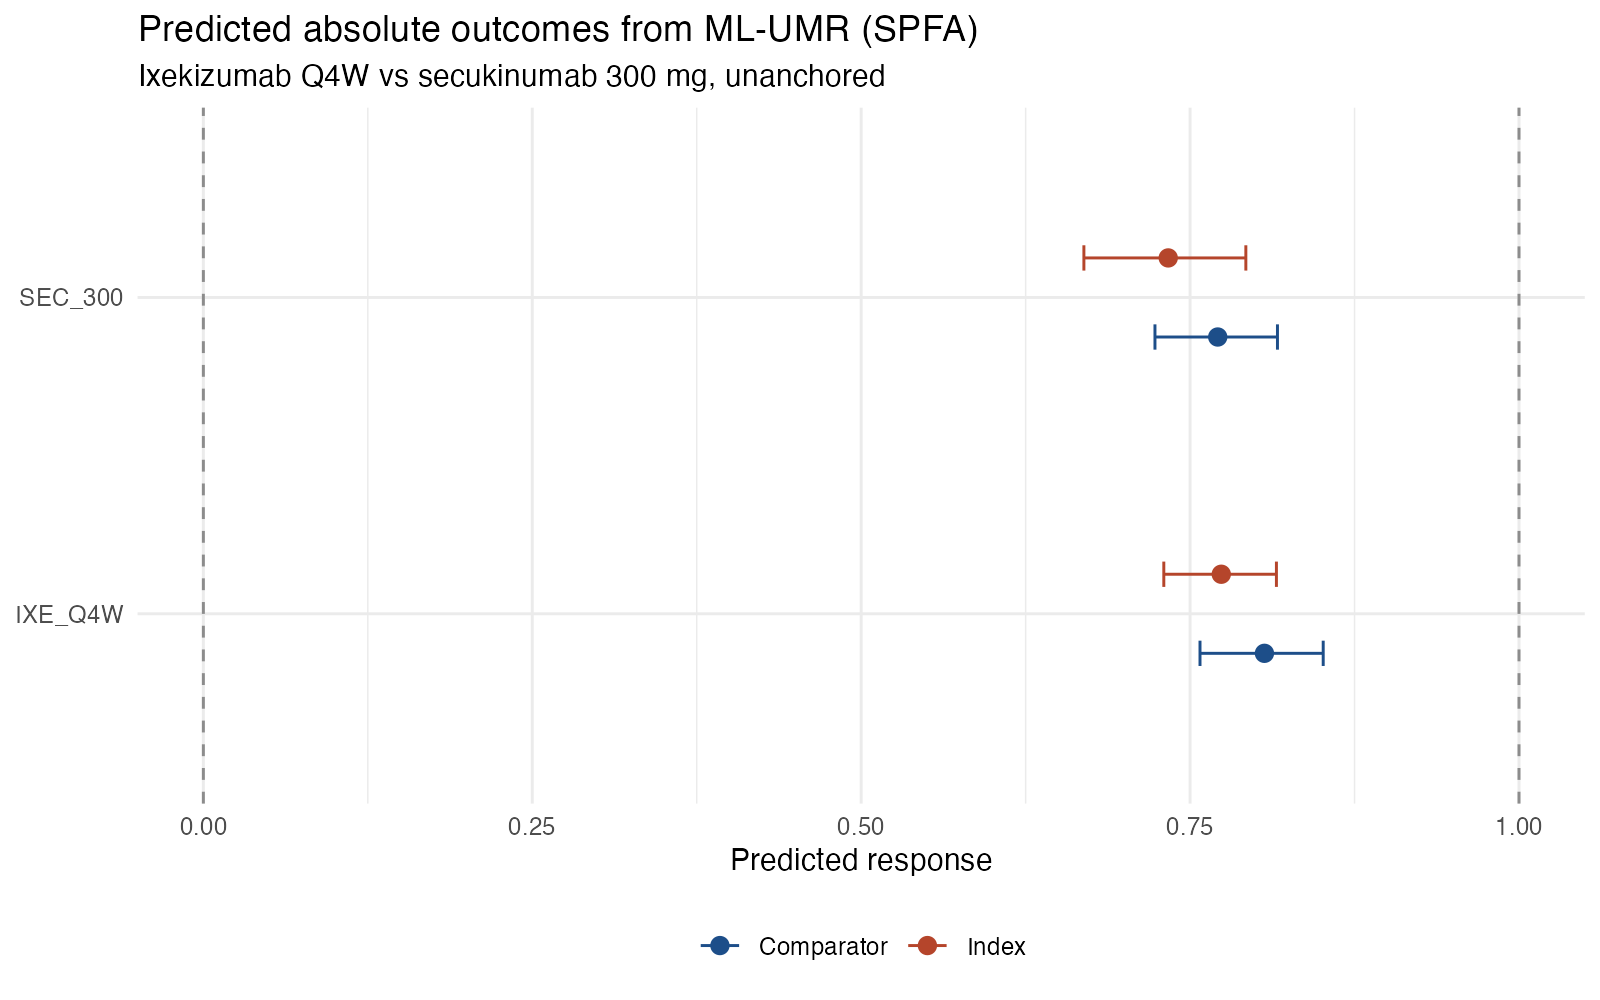
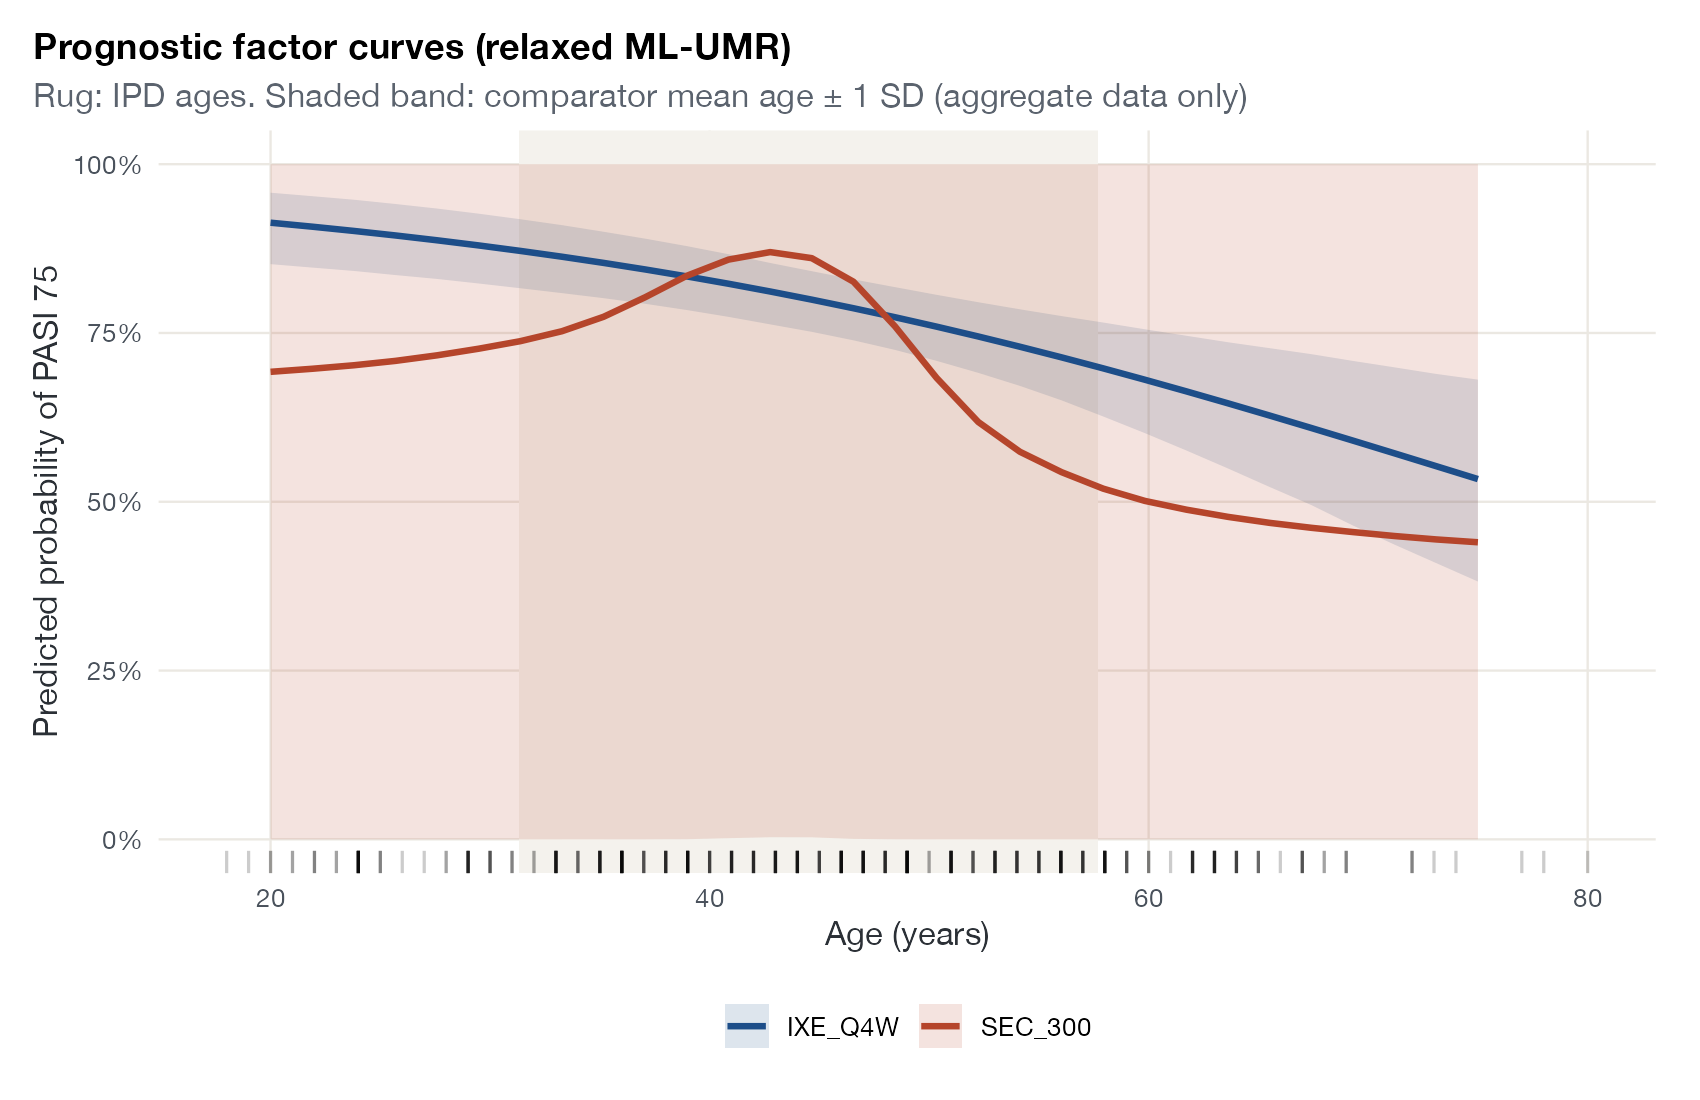
Unanchored multilevel meta-regression
ML-UMR graphics for disconnected evidence, where prognostic modeling carries the whole comparison.
Survival and time-to-event
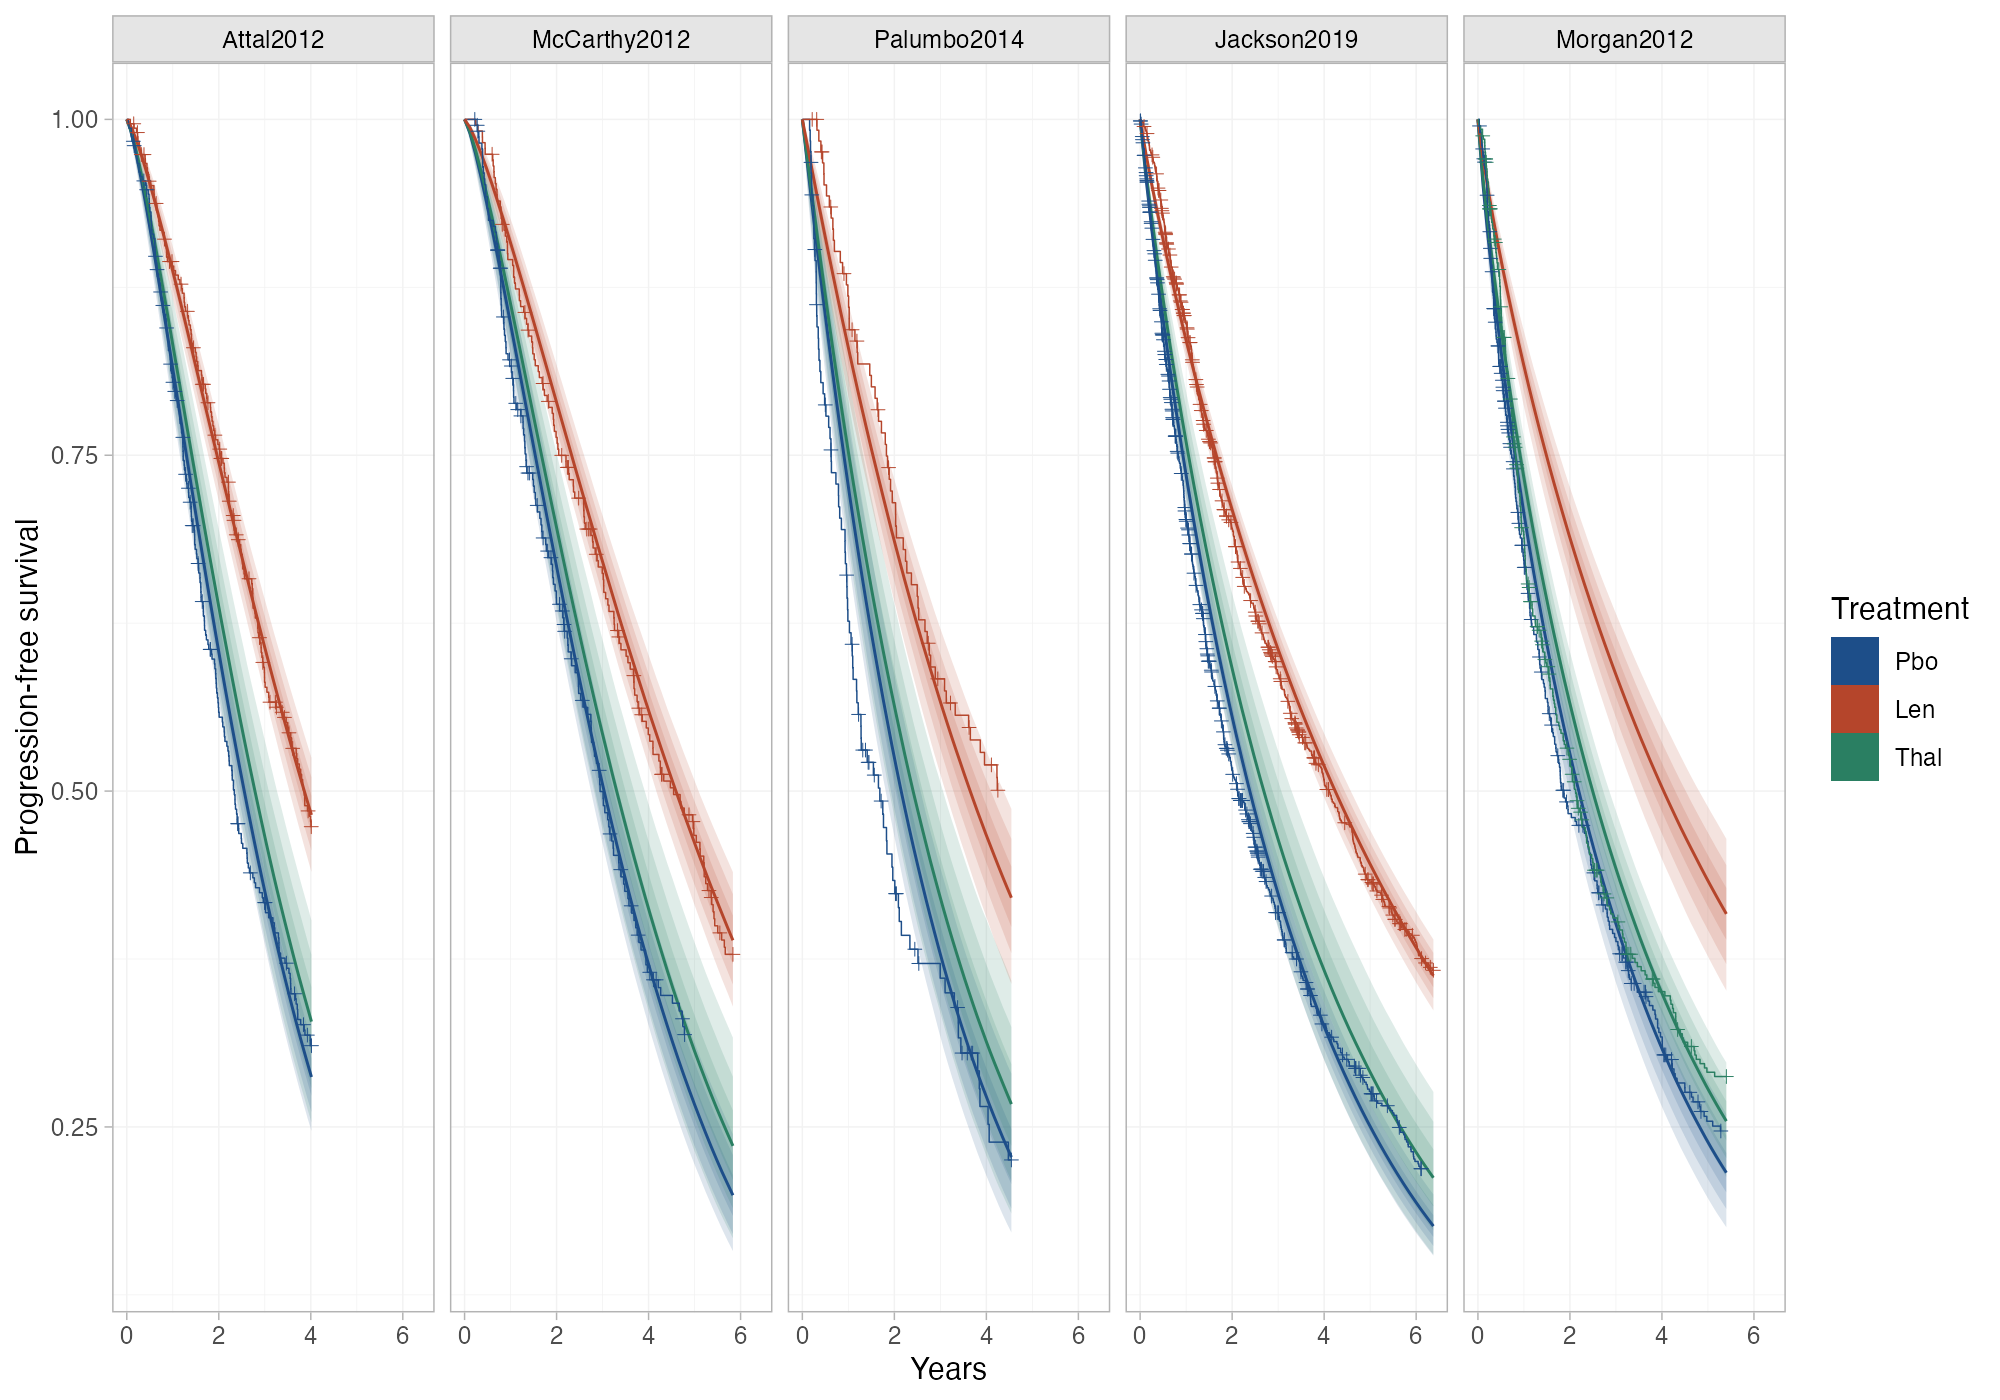
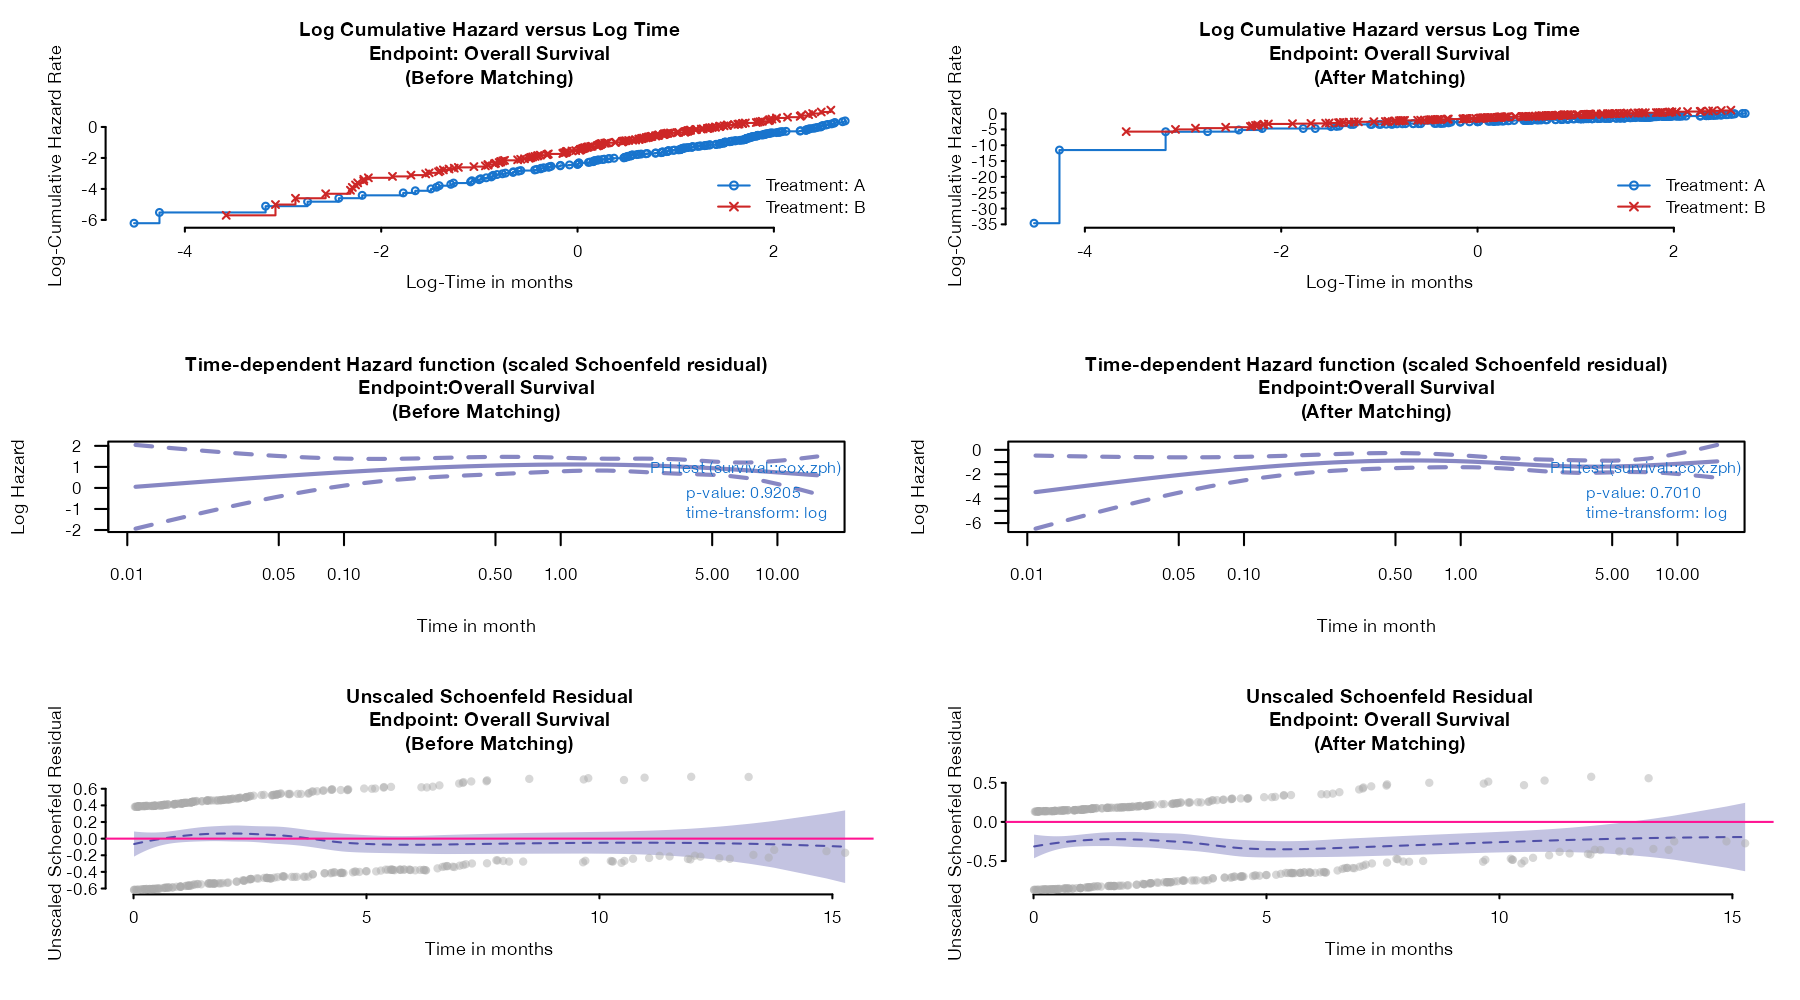
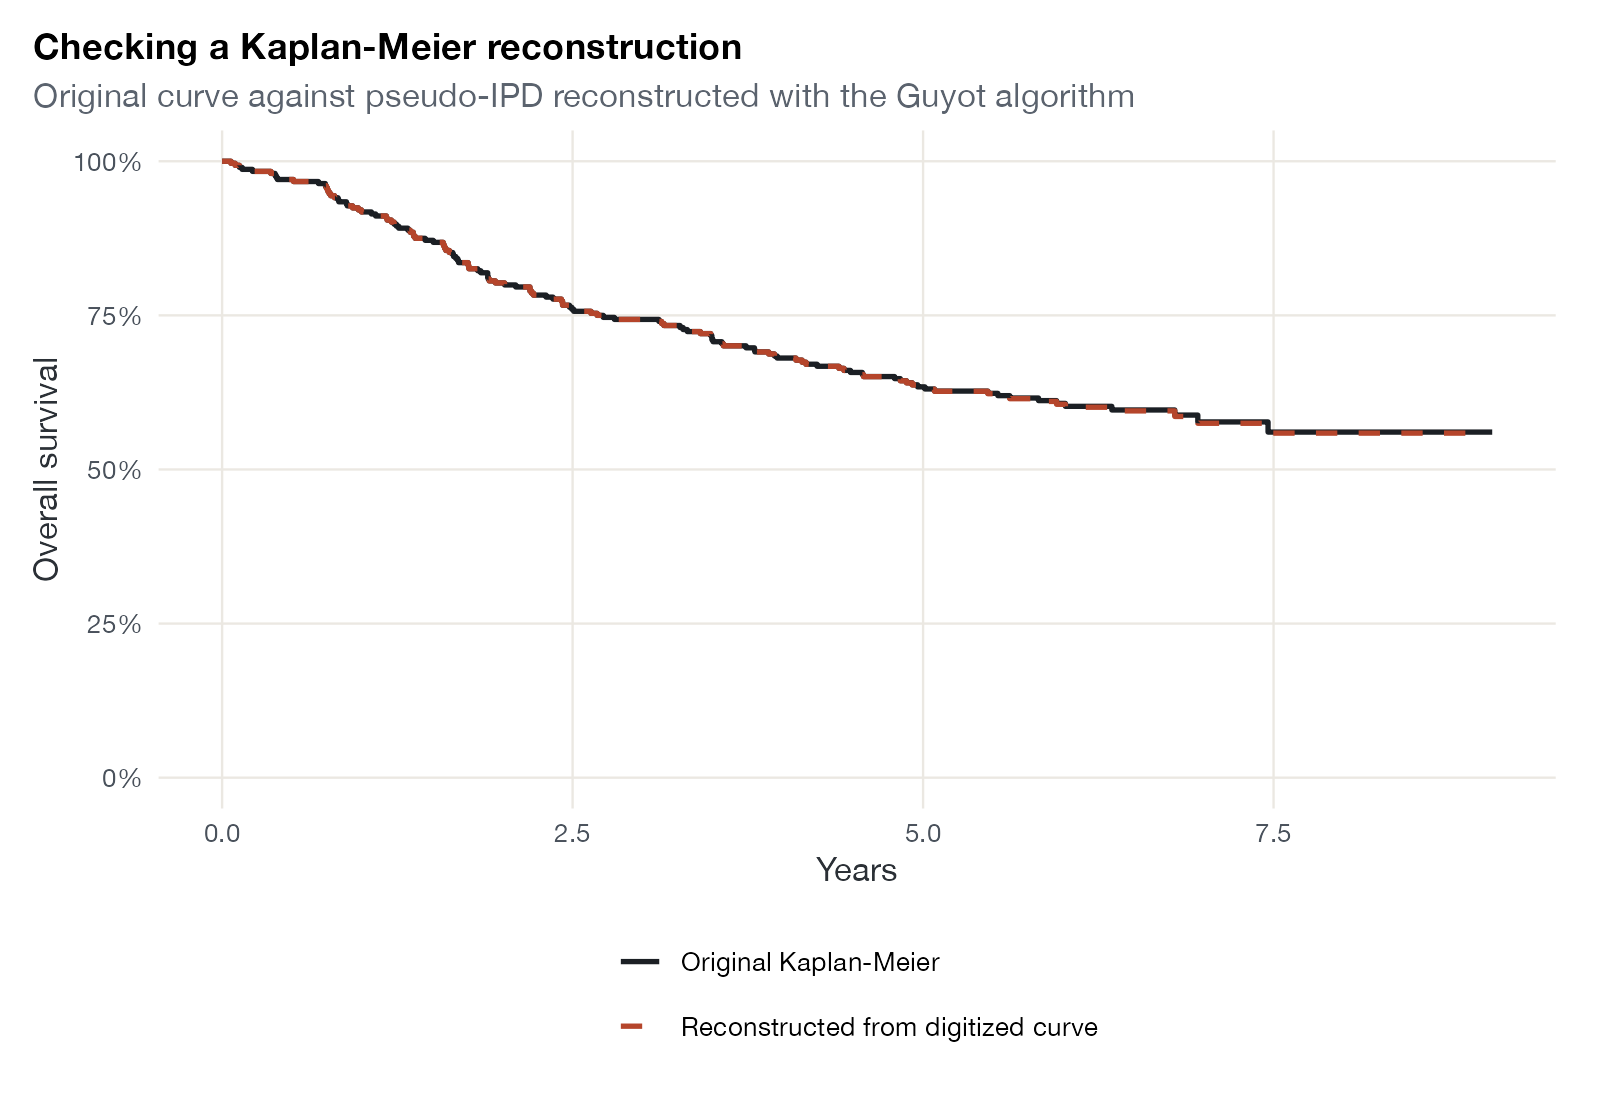
Kaplan-Meier displays, proportional hazards checks, and time-varying effects across ITC methods.
Simulation and method evaluation
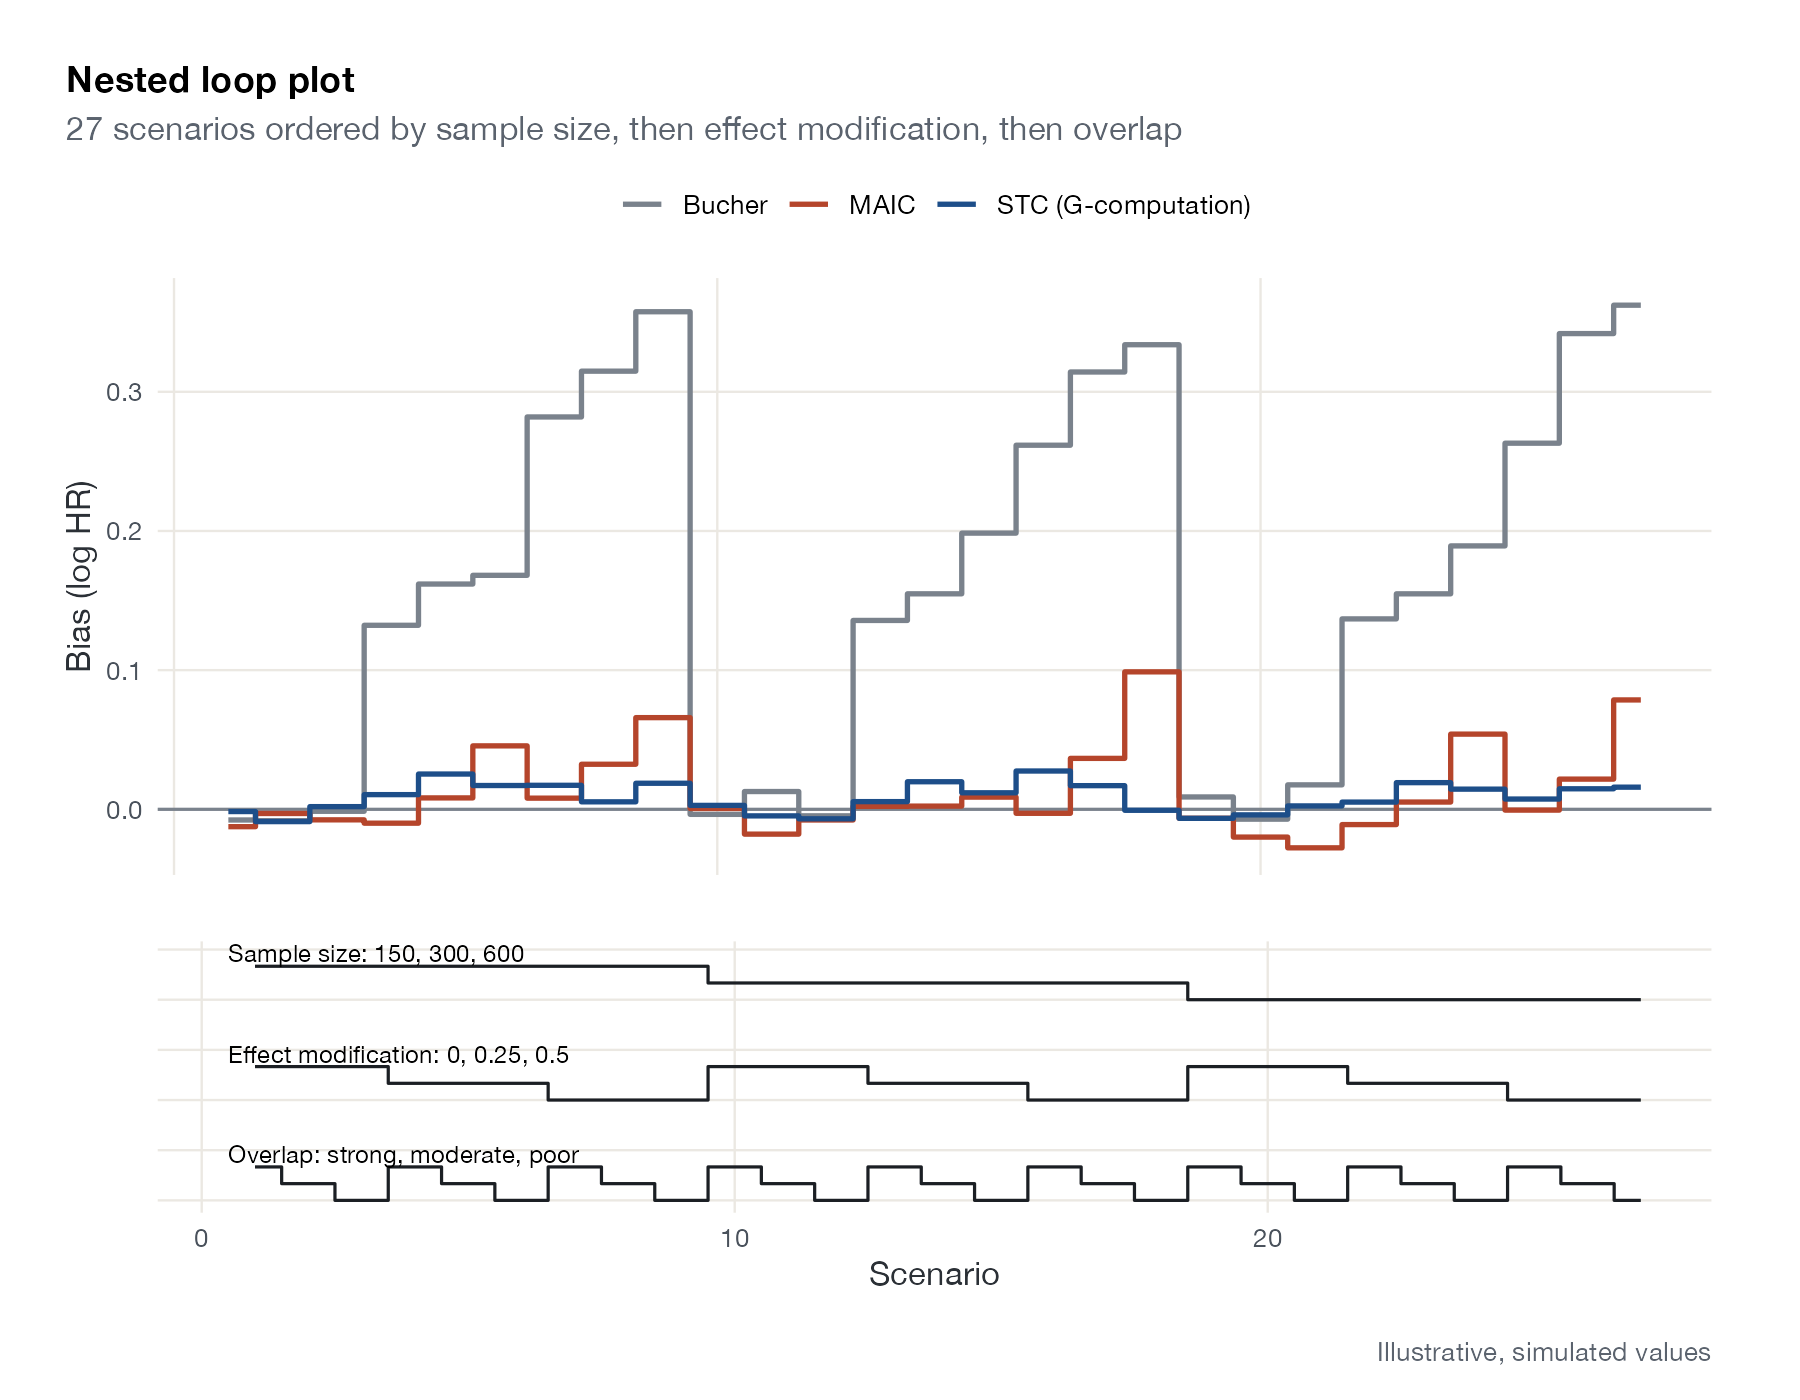
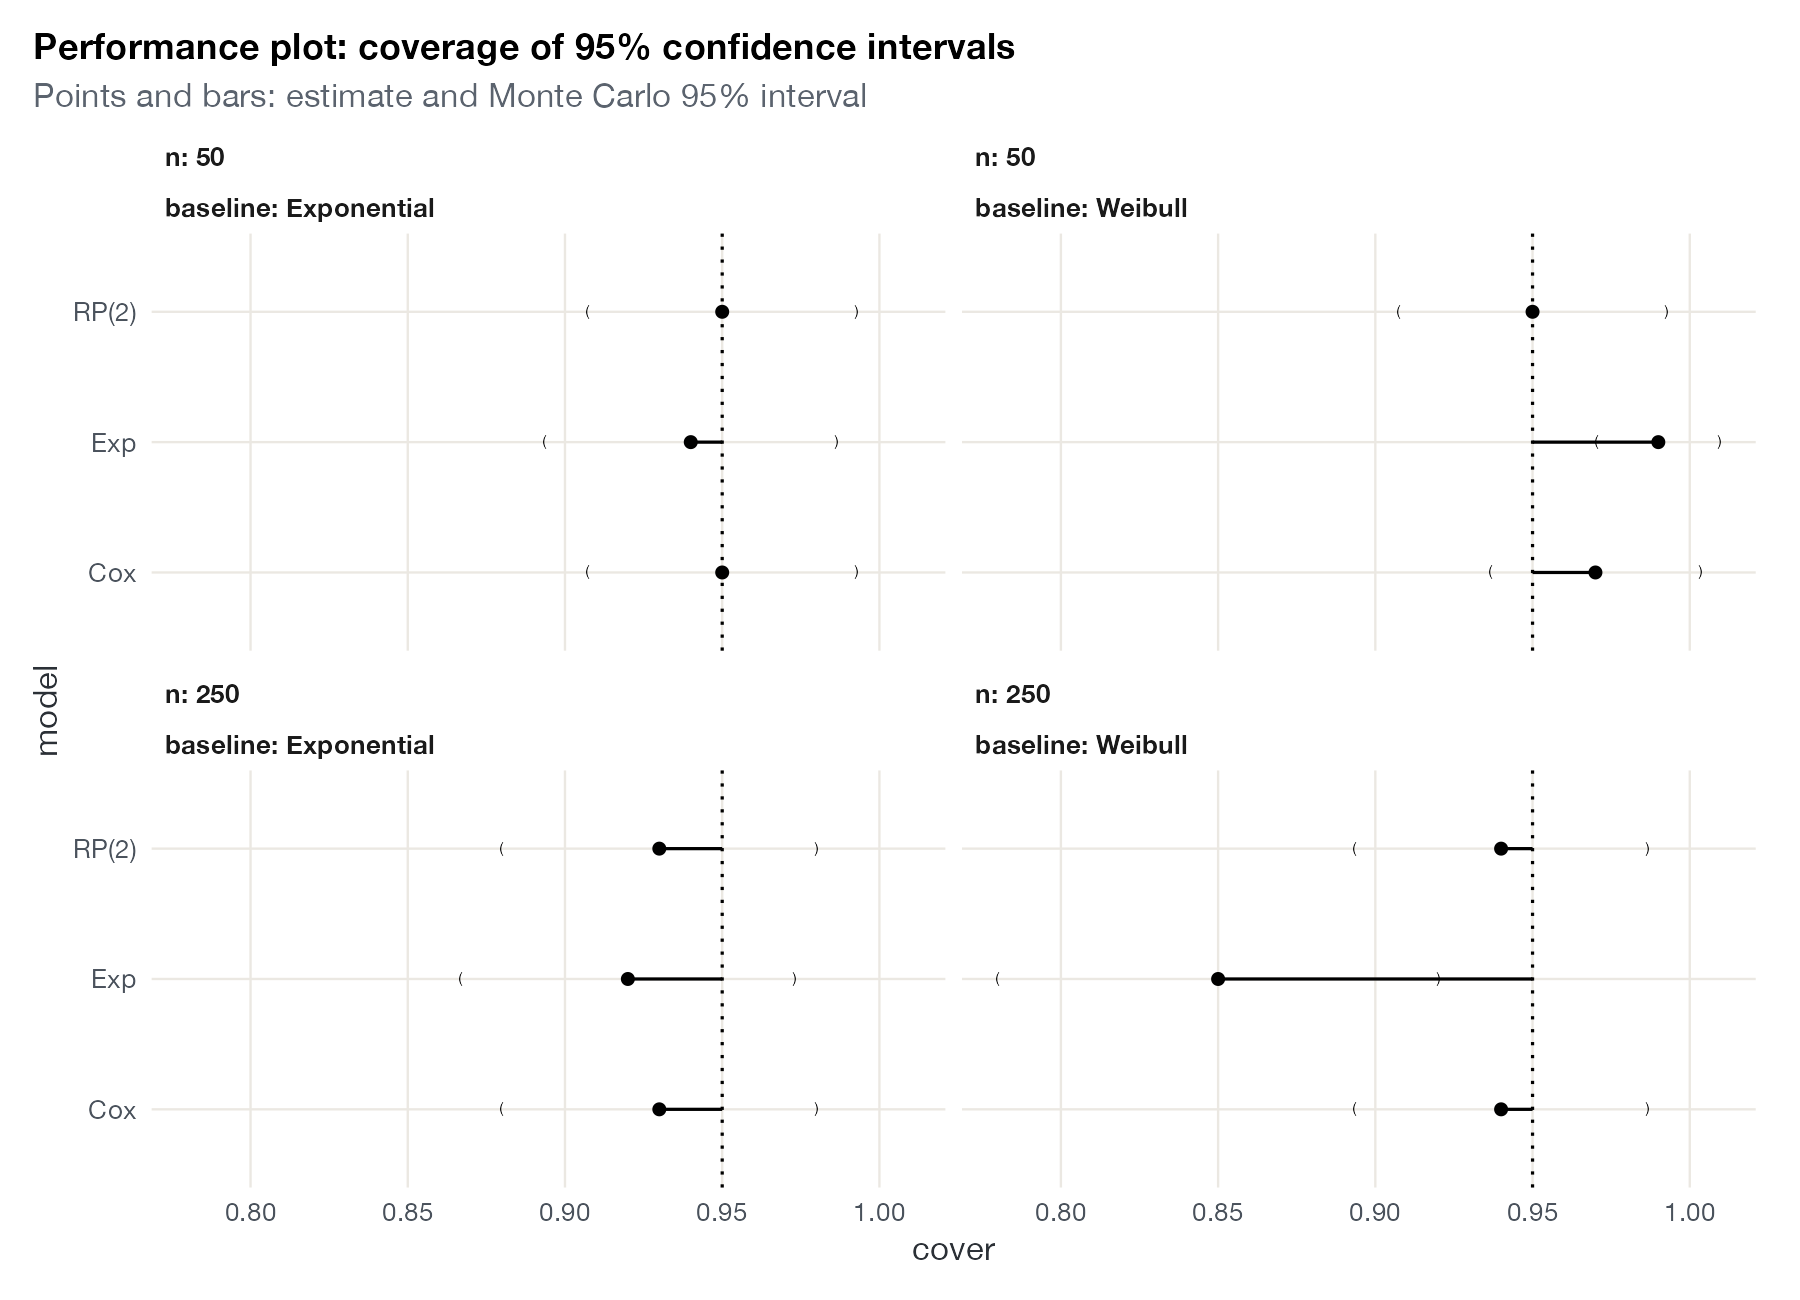
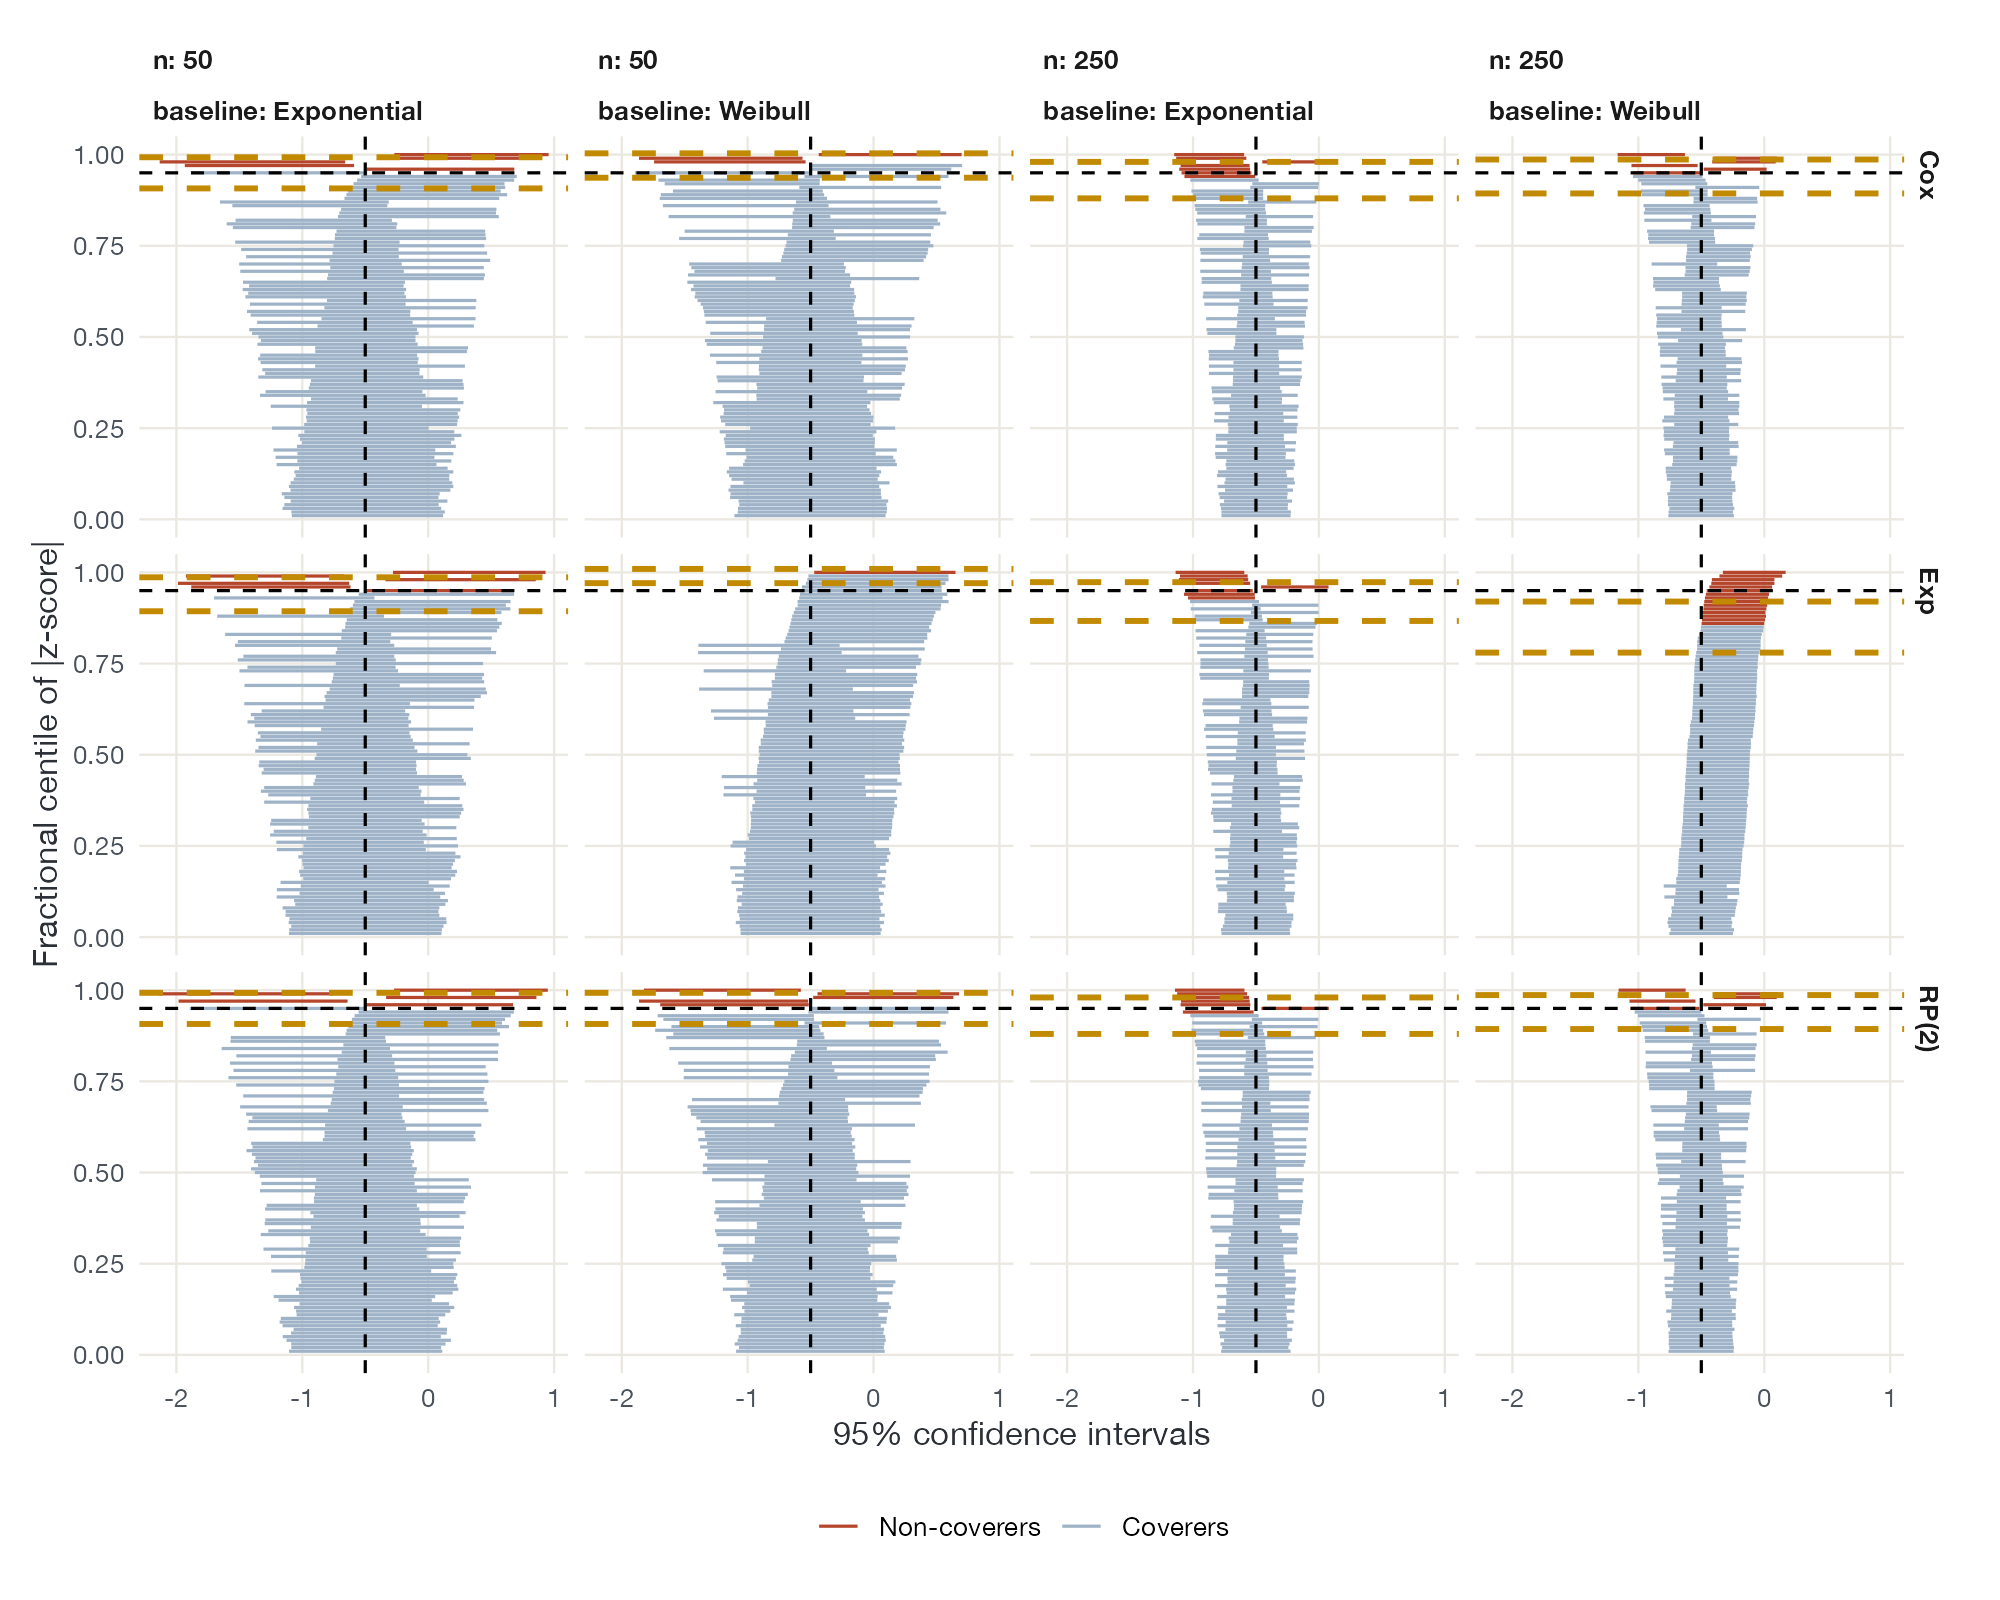
Graphics from the proof-of-concept literature that evaluates methods under known truth.
No plots match this filter. Try another method or search term.