Absolute outcome plot
Treatment-specific predicted outcomes by population
mlumr::psoriasis_ipd, psoriasis_agd.
mlumr (plot(predict())), multinma::predict()
What it shows
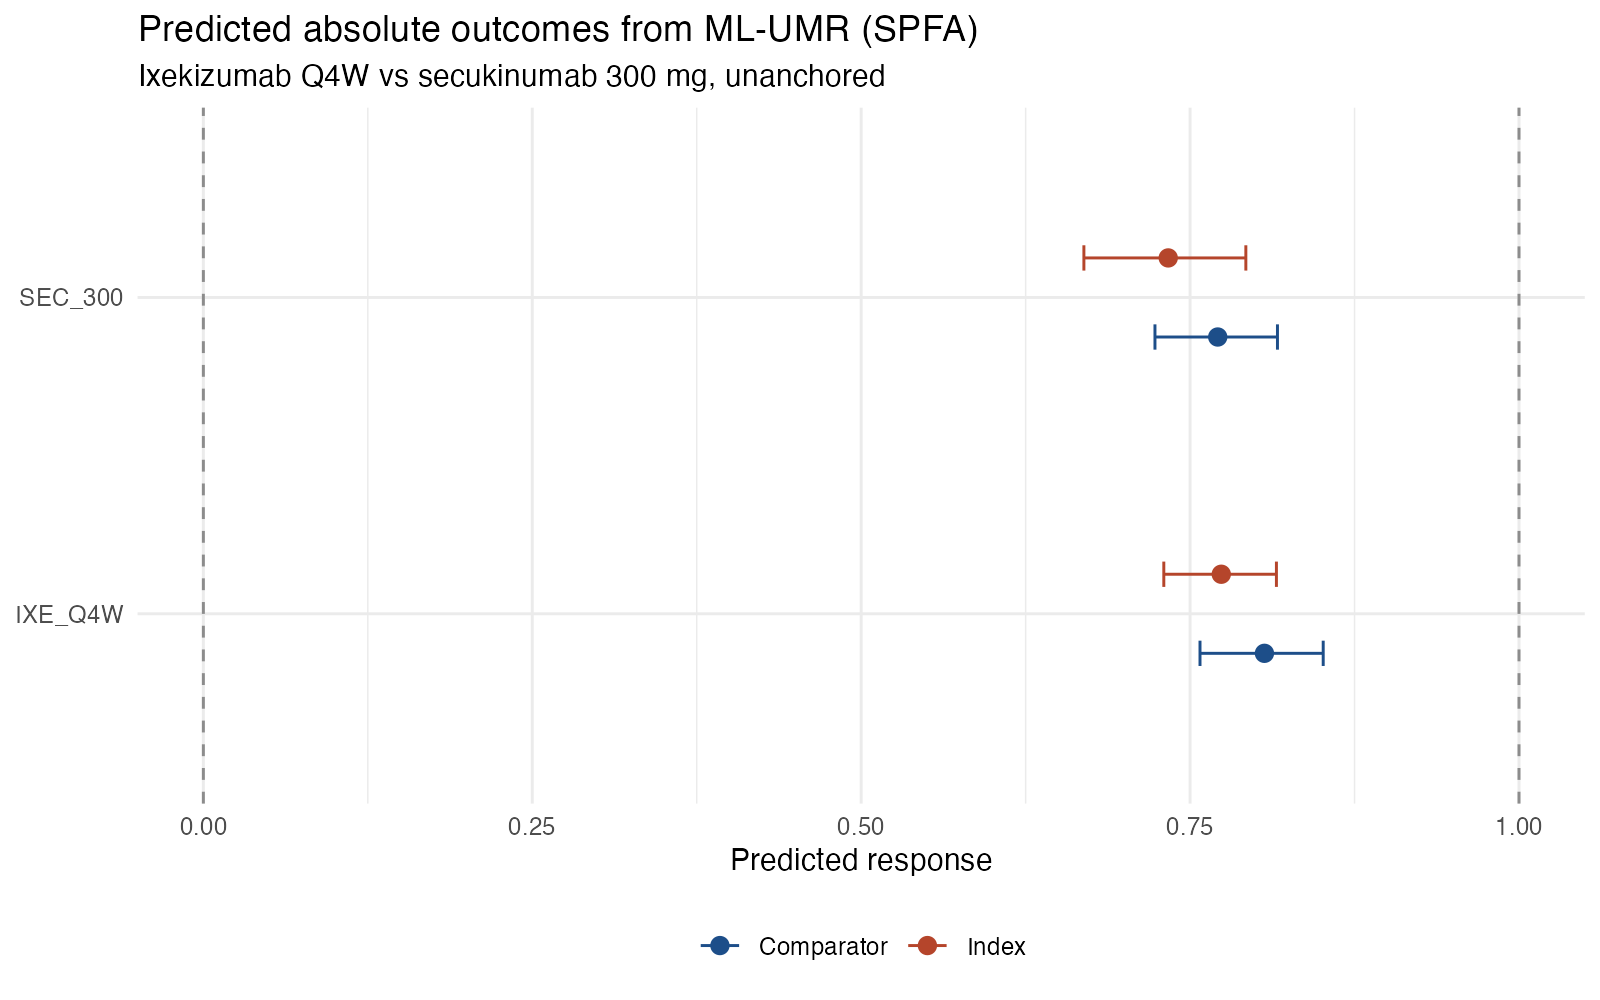
Without a common comparator, an unanchored comparison cannot rely on randomization to cancel prognosis: it has to predict absolute outcomes for each treatment in a common population. ML-UMR (Chandler and colleagues, 2026) does this by modeling the IPD and integrating over the aggregate study’s covariate distribution. Plotting the predicted absolute outcomes for both treatments in both populations shows the inputs to the relative effect, and how much the choice of population matters.
How to read it
- Rows: treatments.
- Colors: target population (index = the IPD trial’s population, comparator = the aggregate trial’s).
- Points and bars: posterior mean and 95% credible interval of the outcome probability.
- Dashed lines: the bounds 0 and 1 of the probability scale.
Interpretation
In the comparator (FIXTURE) population the model predicts PASI 75 response of 81% on ixekizumab Q4W and 77% on secukinumab 300 mg; in the index (UNCOVER-2) population, 77% and 73%. Both treatments do better in the comparator population, which has patients with slightly more favorable prognosis, but the difference between treatments is similar in both: a marginal log odds ratio of 0.22 (95% CrI −0.17 to 0.61). The naive unadjusted comparison gives 0.02, so adjustment changes the answer more than it changes the uncertainty.
Pitfalls
- Every absolute prediction depends on the outcome model being correct and complete; unmeasured prognostic factors bias it directly.
- The index population is usually the decision-relevant one for HTA; report both and say which is primary.
- ML-UMR is a 2026 method; conventions for presenting it are still forming.
Code
Shared model (R/models/psoriasis-mlumr.R)
# Unanchored comparison of PASI 75 response: ixekizumab Q4W (IPD, UNCOVER-2)
# versus secukinumab 300 mg (aggregate data, FIXTURE), with no common arm
library(mlumr)

ipd <- set_ipd(psoriasis_ipd, treatment = "treatment", outcome = "pasi75",
               covariates = c("age", "bsa", "weight", "prevsys"), family = "binomial")
agd <- set_agd(psoriasis_agd, treatment = "treatment", family = "binomial",
               outcome_n = "pasi75_n", outcome_r = "pasi75_r",
               cov_means = c("age_mean", "bsa_mean", "weight_mean", "prevsys_prop"),
               cov_sds = c("age_sd", "bsa_sd", "weight_sd", NA),
               cov_types = c("continuous", "continuous", "continuous", "binary"))
pso_dat <- combine_data(ipd, agd)

# Integration points over the comparator population's covariate distribution
pso_dat <- add_integration(pso_dat, n_int = 256,
  age = distr(qgamma, mean = age_mean, sd = age_sd),
  bsa = distr(qgamma, mean = bsa_mean, sd = bsa_sd),
  weight = distr(qgamma, mean = weight_mean, sd = weight_sd),
  prevsys = distr(qbern, prob = prevsys_mean))

# Shared prognostic factor model (SPFA) and relaxed model with
# treatment-specific covariate effects
fit_spfa <- mlumr(pso_dat, model = "spfa", seed = 2026, refresh = 0)
fit_relaxed <- mlumr(pso_dat, model = "relaxed", seed = 2026, refresh = 0)
Figure
library(mlumr)
source("R/models/psoriasis-mlumr.R")  # builds pso_dat and fits fit_spfa, fit_relaxed

# Posterior probability of PASI 75 response on each treatment, standardized
# to the index (IPD) and comparator (aggregate) populations
plot(predict(fit_spfa), ref_line = c(0, 1)) +
  ggplot2::labs(title = "Predicted absolute outcomes from ML-UMR (SPFA)",
                subtitle = "Ixekizumab Q4W vs secukinumab 300 mg, unanchored")
References
- Chandler C, et al. Anchors away: navigating unanchored indirect comparisons with multilevel unanchored meta-regression. 2026. arXiv:2606.20341
- mlumr: Bayesian multilevel unanchored meta-regression. R package. cran.r-project.org/package=mlumr
- Phillippo DM, Dias S, Ades AE, et al. Multilevel network meta-regression for population-adjusted treatment comparisons. J R Stat Soc Ser A. 2020;183:1189-1210. doi:10.1111/rssa.12579