Node-splitting forest plot
Side-split plot, direct versus indirect forest, NMA composite forest
netmeta::Senn2013.
netmeta::netsplit() + forest(), multinma (consistency = "nodesplit"), gemtc::mtc.nodesplit(); Stata network sidesplit
What it shows
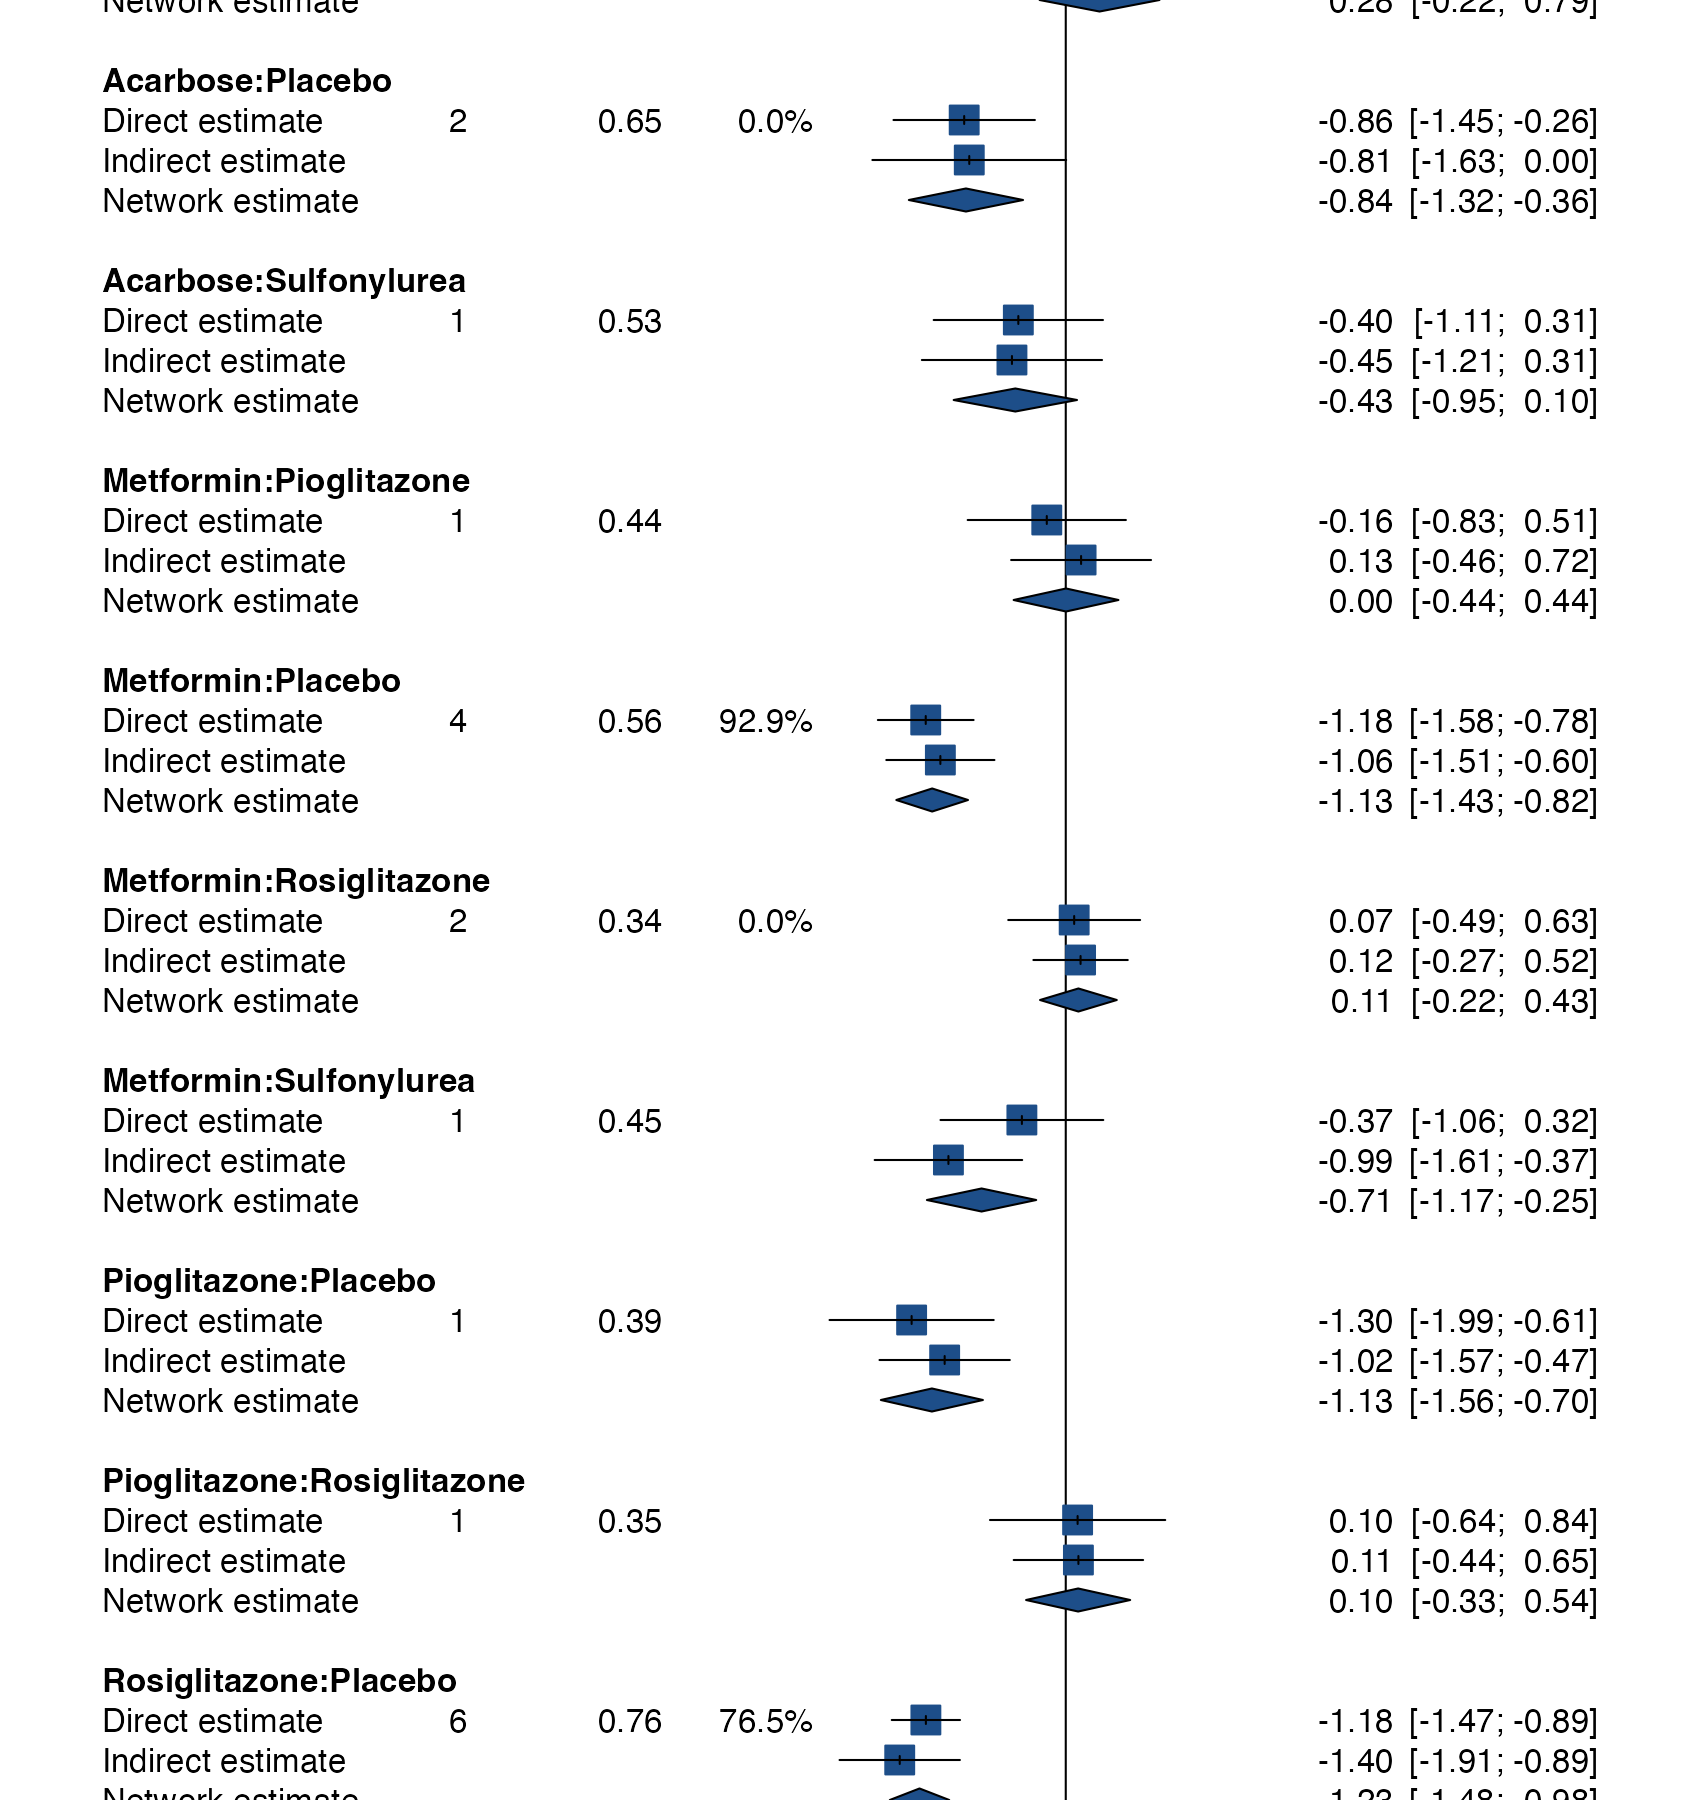
Node splitting (Dias and colleagues) separates, for one comparison at a time, the direct evidence from the indirect evidence supplied by the rest of the network. The forest plot stacks the direct estimate, the indirect estimate, and the combined network estimate for each comparison. Disagreement between the first two is local inconsistency. The same layout shows at a glance where each network estimate comes from, which is why it is sometimes called an NMA composite forest.
How to read it
- Groups: comparisons that have both direct and indirect evidence.
- Rows within a group: direct estimate, indirect estimate, and network estimate (diamond).
- Columns: number of direct trials, direct evidence proportion, and within-comparison \(I^2\).
- Look for: direct and indirect intervals that do not overlap.
Interpretation
Most pairs agree closely. The largest discrepancies are metformin versus sulfonylurea (direct −0.37 against indirect −0.99) and rosiglitazone versus sulfonylurea, both informed by a single direct trial, with p-values of 0.19 and 0.16 for the difference. With intervals this wide, the absence of significant differences is weak reassurance.
Pitfalls
- A non-significant difference does not establish consistency; direct and indirect estimates are often imprecise.
- Testing every comparison creates multiplicity.
- With multi-arm trials, the split can be defined in several ways (for example, SIDDE in netmeta versus the Dias approach), which changes results.
- Loops share evidence, so node-split tests are not independent.
Code
library(netmeta)

data(Senn2013)

net <- netmeta(
  TE, seTE, treat1.long, treat2.long, studlab,
  data = Senn2013, sm = "MD",
  common = FALSE, reference.group = "Placebo"
)

# Separate direct and indirect evidence for every comparison informed by both
ns <- netsplit(net)
forest(ns, show = "both", nchar.trts = 6,
       col.square = "#1d4e89", col.diamond = "#1d4e89",
       col.square.lines = "#1d4e89")
network meta consistency
network sidesplit all, tauReferences
- Dias S, Welton NJ, Caldwell DM, Ades AE. Checking consistency in mixed treatment comparison meta-analysis. Stat Med. 2010;29:932-944. doi:10.1002/sim.3767
- König J, Krahn U, Binder H. Visualizing the flow of evidence in network meta-analysis and characterizing mixed treatment comparisons. Stat Med. 2013;32:5414-5429. doi:10.1002/sim.6001