Diagnostic test accuracy meta-analysis
Plots for pooled sensitivity and specificity
Meta-analysis of diagnostic test accuracy models sensitivity and specificity jointly, because they are correlated through the positivity threshold. The bivariate and hierarchical summary ROC (HSROC) models produce a summary point with confidence and prediction regions, or a summary curve.
Minimum graphical set
- A paired forest plot of sensitivity and specificity.
- A summary ROC plot with confidence and prediction regions.
All plots for DTA meta-analysis
Diagnostic test accuracy
Paired sensitivity and specificity displays and summary ROC curves for DTA meta-analysis.
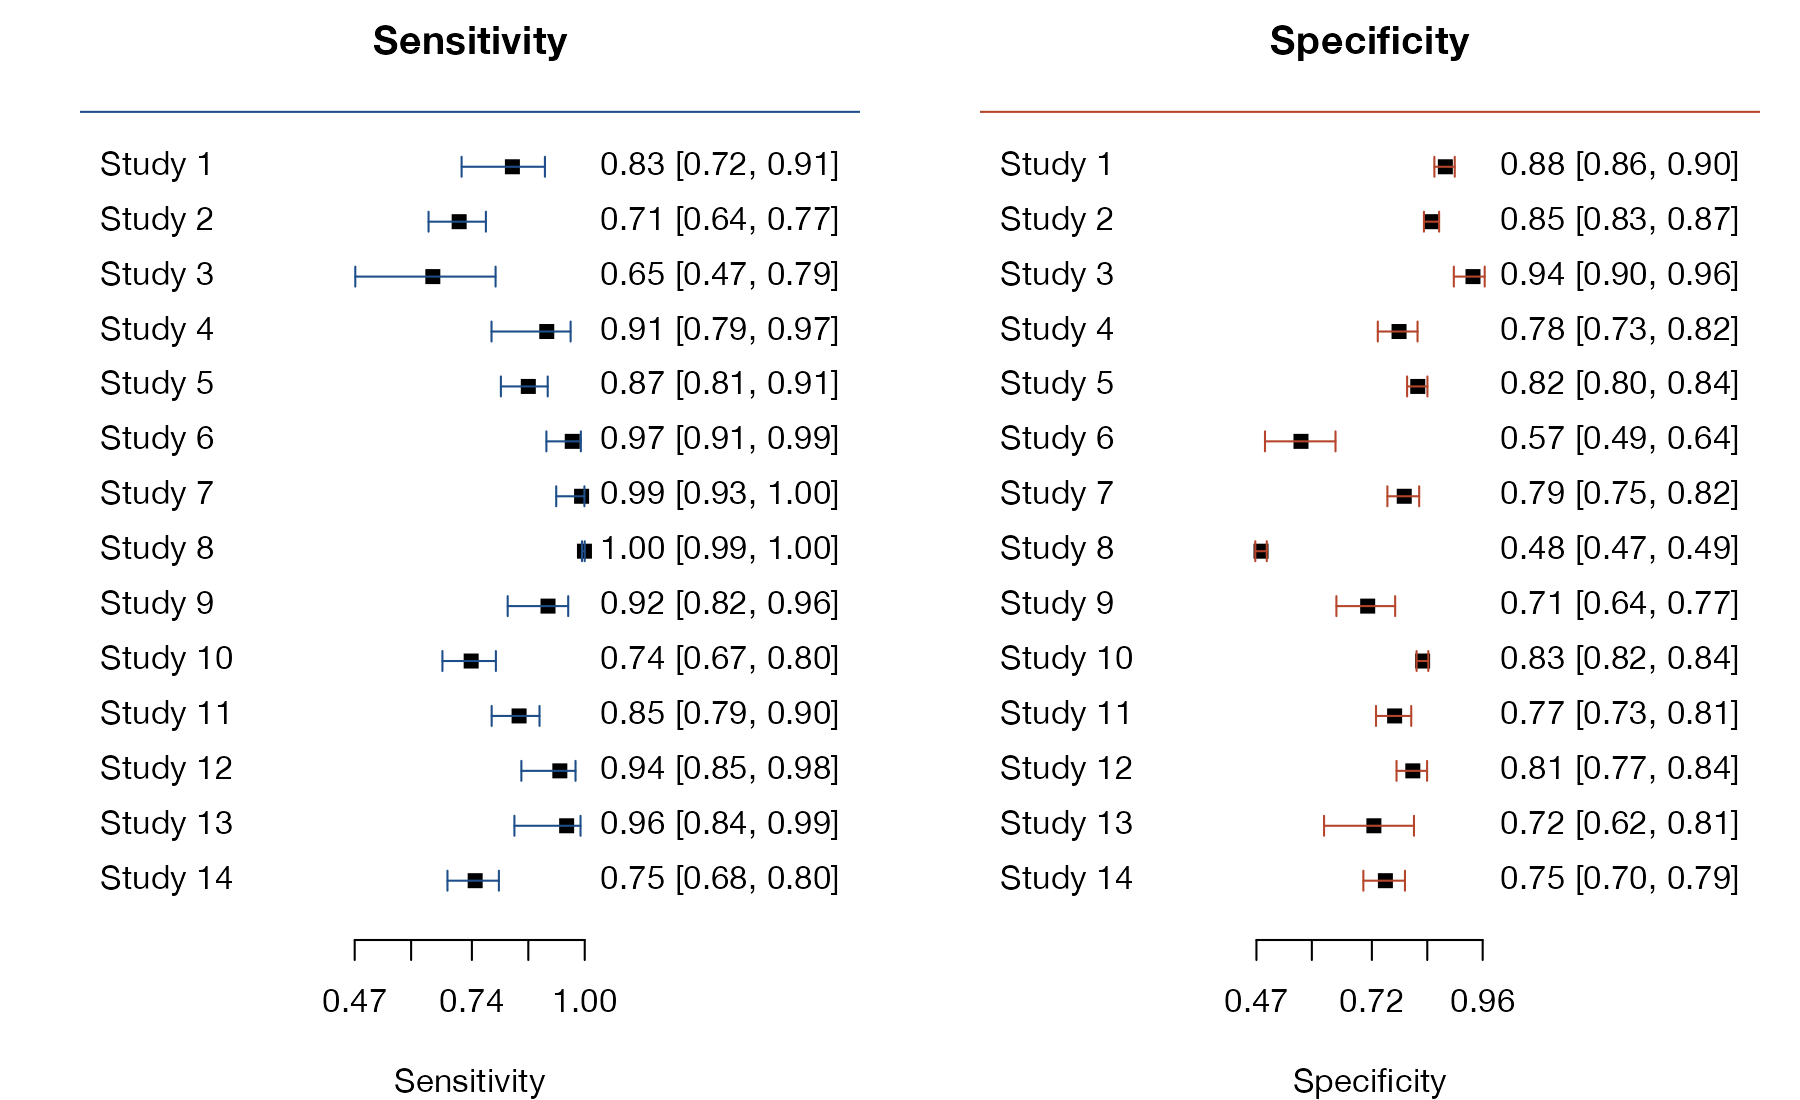
Paired forest plot of sensitivity and specificity
Side-by-side forest plots of each study's sensitivity and specificity with confidence intervals.
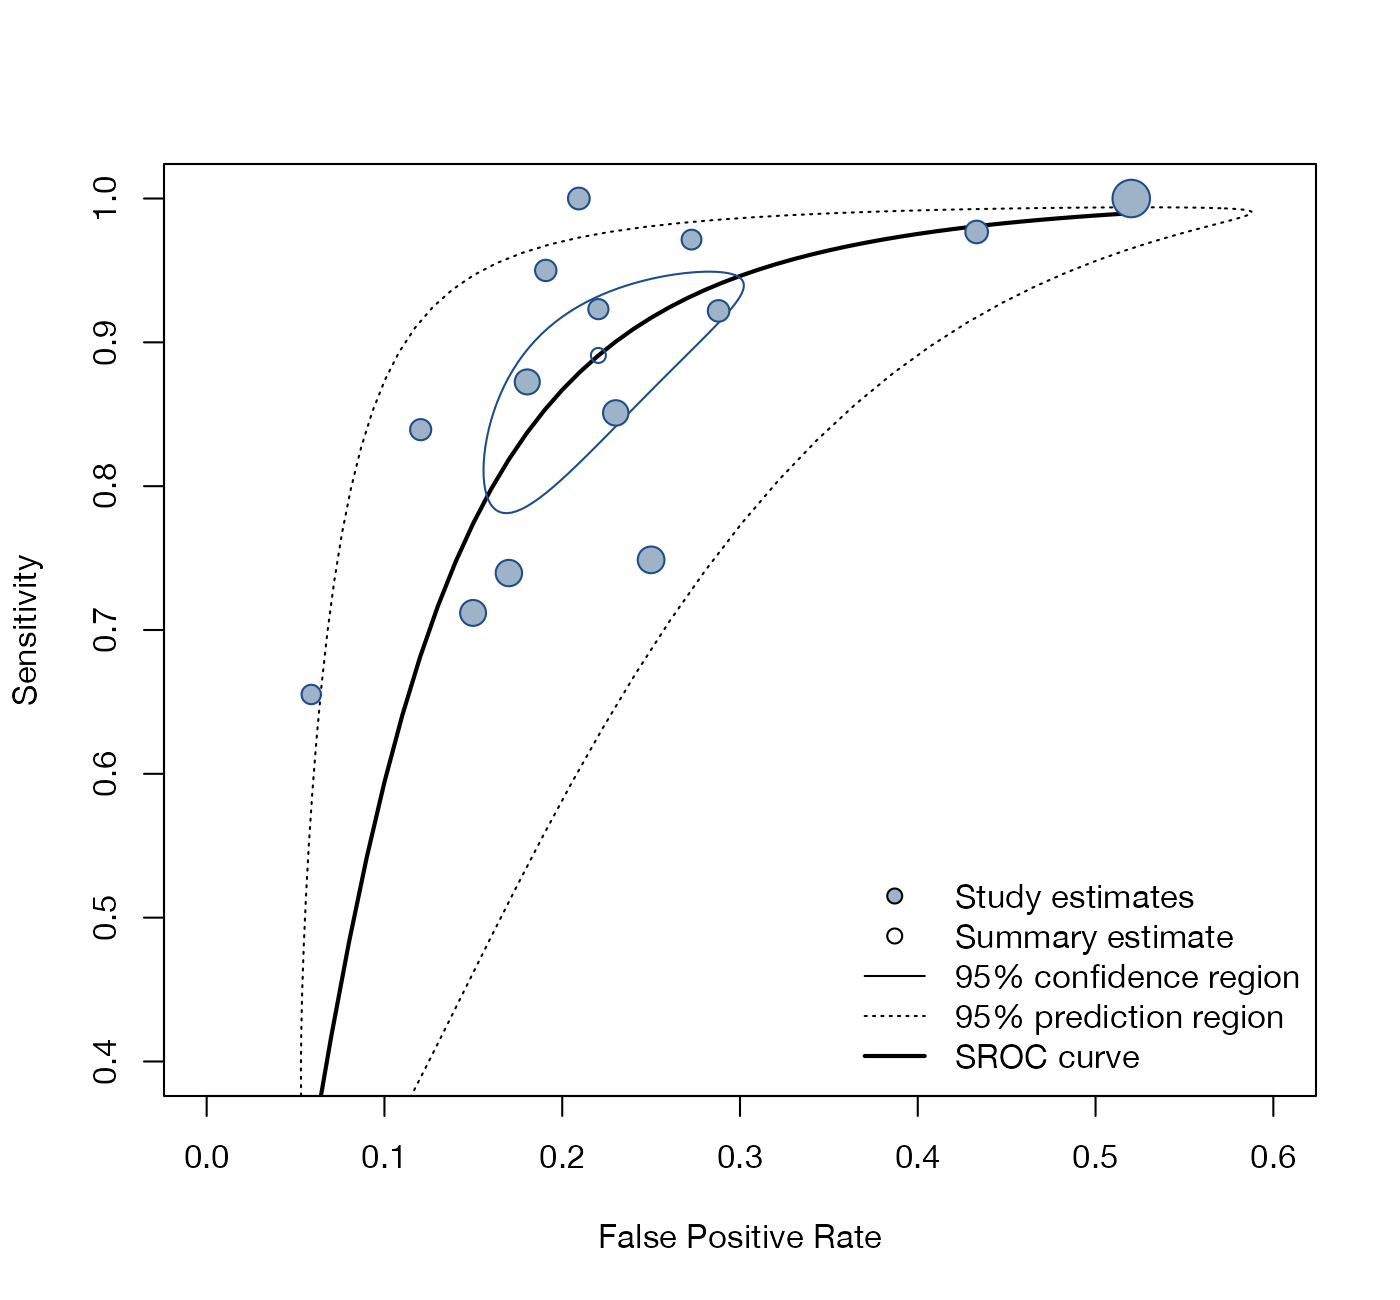
Summary ROC plot
Study estimates in ROC space with the bivariate summary point, its confidence and prediction regions, and the summary ROC curve.
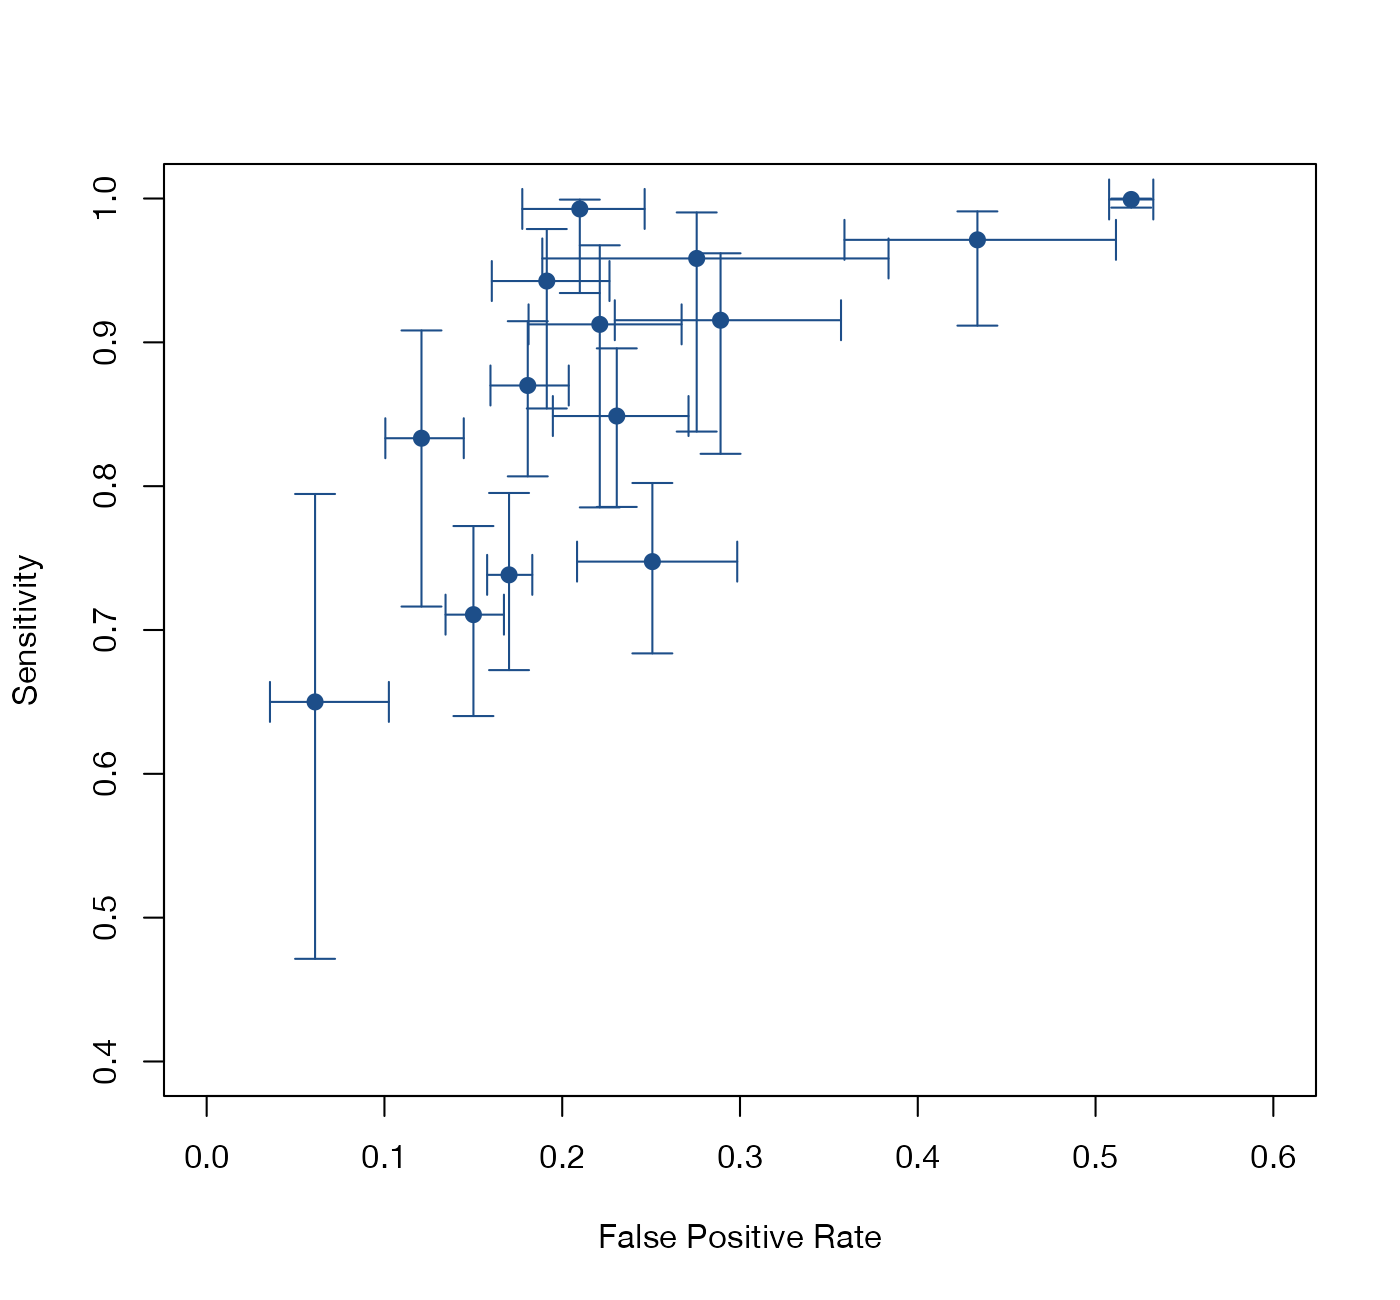
Crosshair plot
Each study in ROC space with confidence intervals for both its false positive rate and its sensitivity.
No plots match this filter. Try another method or search term.
No matching items