Summary ROC plot
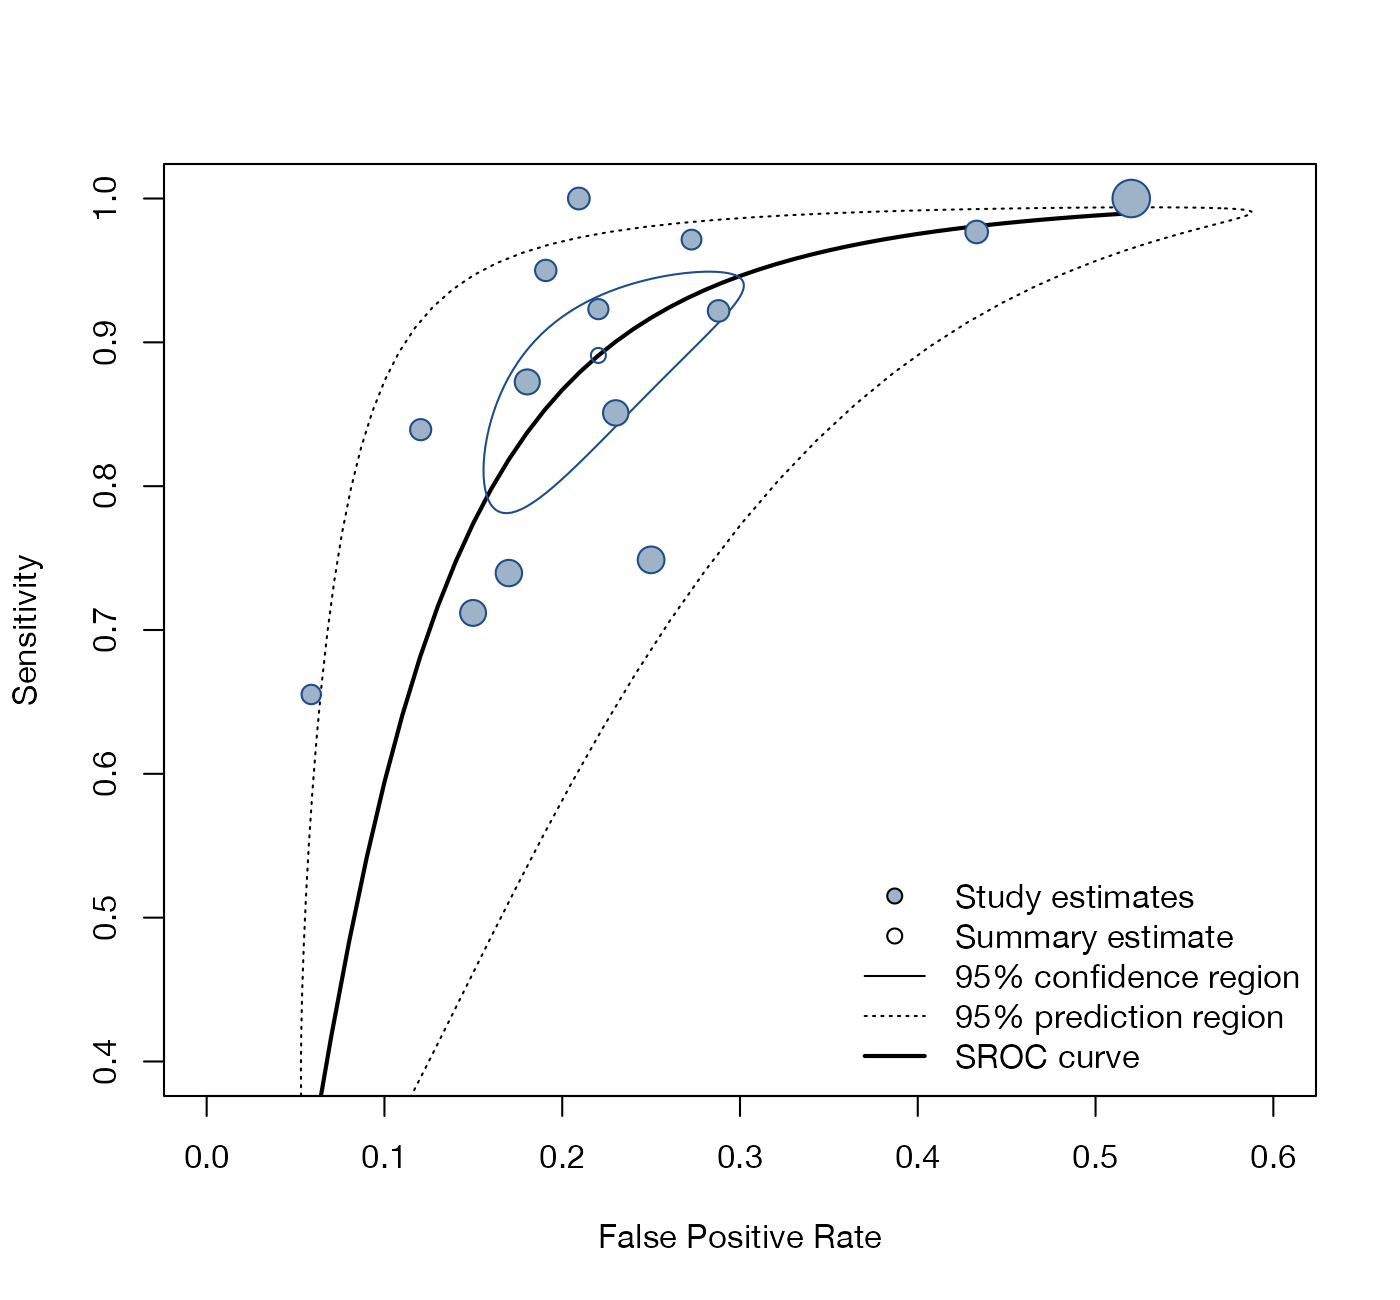
SROC plot with confidence and prediction regions
mada::AuditC.
mada::reitsma() + plot(), metafor bivariate models; Stata metandi, midas; RevMan
What it shows
In ROC space (false positive rate against sensitivity), each study is a point. The bivariate model of Reitsma and colleagues estimates a summary operating point with a confidence region for it and a prediction region for a new study; the HSROC model of Rutter and Gatsonis estimates a summary curve across thresholds. Together they describe average accuracy and how much it varies between settings.
How to read it
- Horizontal axis: false positive rate (1 minus specificity); vertical axis: sensitivity.
- Points: studies, sized by the number of diseased participants.
- Summary point: the pooled operating point.
- Solid ellipse: 95% confidence region for the summary point.
- Dotted region: 95% prediction region for a new study.
- Curve: summary ROC curve.
Interpretation
The summary sensitivity is 0.89 (95% CI 0.81 to 0.94) at a false positive rate of 0.22 (0.17 to 0.29), that is, a specificity of about 0.78. The prediction region is much larger than the confidence region and stretches along the curve, reflecting threshold variation between studies: the operating point in a new setting is uncertain even though the average is well estimated.
Pitfalls
- A summary point is meaningful only if studies share a common threshold; with variable thresholds report the SROC curve.
- The summary curve beyond the range of observed false positive rates is extrapolation.
- Prediction regions are often omitted, overstating certainty about accuracy in practice.
Code
library(mada)

data(AuditC)

# Bivariate (Reitsma) model: summary point, 95% confidence region, and the
# summary ROC curve
fit <- reitsma(AuditC)
plot(fit, sroclwd = 2, xlim = c(0, 0.6), ylim = c(0.4, 1), predict = TRUE,
     main = "", col = "#1d4e89")
points(fpr(AuditC), sens(AuditC), pch = 21, bg = "#9fb3c8", col = "#1d4e89",
       cex = 1 + 1.5 * sqrt((AuditC$TP + AuditC$FN) / max(AuditC$TP + AuditC$FN)))
legend("bottomright", bty = "n",
       c("Study estimates", "Summary estimate", "95% confidence region",
         "95% prediction region", "SROC curve"),
       pch = c(21, 1, NA, NA, NA), pt.bg = c("#9fb3c8", NA, NA, NA, NA),
       lty = c(NA, NA, 1, 3, 1), lwd = c(NA, NA, 1, 1, 2))
References
- Reitsma JB, Glas AS, Rutjes AWS, Scholten RJPM, Bossuyt PM, Zwinderman AH. Bivariate analysis of sensitivity and specificity produces informative summary measures in diagnostic reviews. J Clin Epidemiol. 2005;58:982-990. doi:10.1016/j.jclinepi.2005.02.022
- Rutter CM, Gatsonis CA. A hierarchical regression approach to meta-analysis of diagnostic test accuracy evaluations. Stat Med. 2001;20:2865-2884. doi:10.1002/sim.942
- Doebler P, Holling H. Meta-analysis of diagnostic accuracy with mada. R package vignette. cran.r-project.org/package=mada