Limit meta-analysis funnel plot
Funnel plot with shrunken estimates, extended random-effects funnel
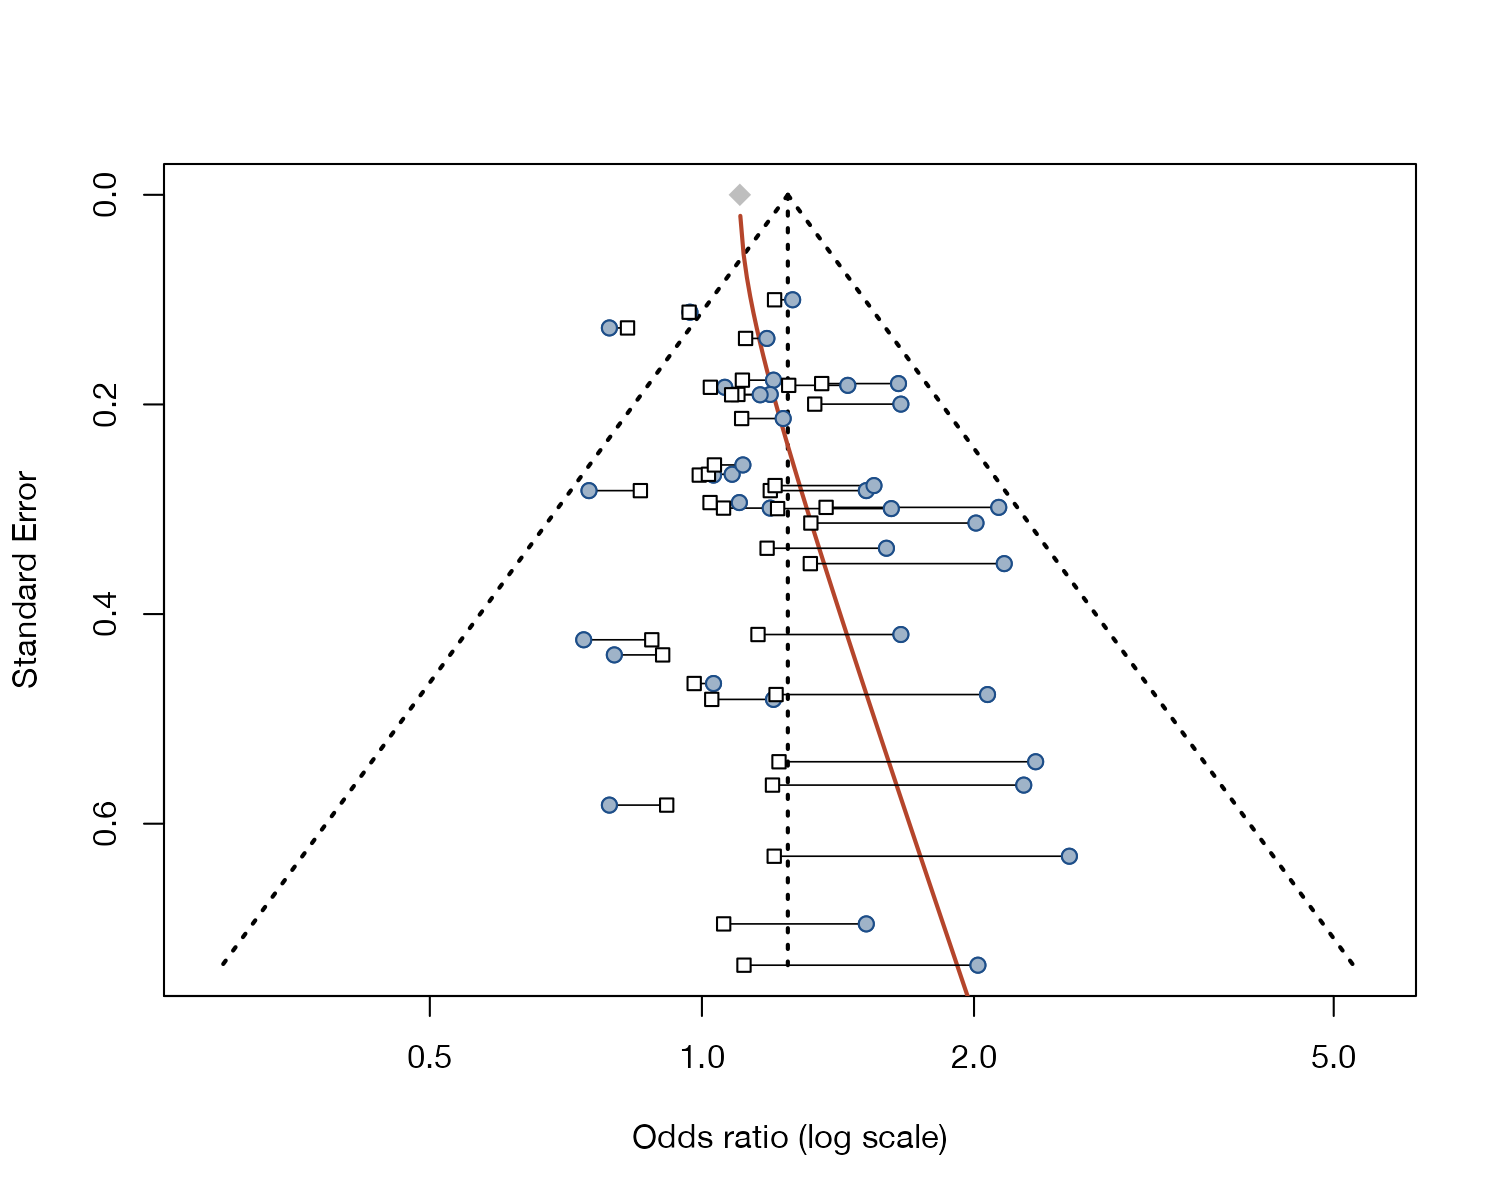
metadat::dat.hackshaw1998.
metasens::limitmeta(), metasens::funnel.limitmeta()
What it shows
Limit meta-analysis (Rücker, Schwarzer, Carpenter, and colleagues) extends the random-effects model with a term for small-study effects and asks what the pooled effect would be for a study with infinite precision. Each study’s estimate is “shrunken” along the fitted small-study-effect line to that limit. The funnel plot shows the observed estimates, their shrunken counterparts, the connecting lines, and the fitted curve.
How to read it
- Circles: observed study estimates.
- Squares: shrunken estimates, joined to the observed ones by lines.
- Curve: the estimated relation between precision and effect.
- Diamond at the top: the adjusted pooled estimate at infinite precision.
Interpretation
Shrinkage pulls the large effects of the small studies toward about 1.1. The adjusted odds ratio is 1.10 (95% CI 0.94 to 1.29), against 1.24 unadjusted, and the test for small-study effects is significant (\(p = 0.010\)). The \(G^2\) statistic of 96% says almost all heterogeneity is explained by the small-study effect. The analysis suggests the unadjusted association may be overstated.
Pitfalls
- Like PET, the adjustment extrapolates to infinite precision and is uncertain with few large studies.
- It treats all small-study effects as bias; genuine differences between small and large studies are also removed.
- Report it as a sensitivity analysis alongside the unadjusted result.
Code
library(meta)
library(metasens)

data(dat.hackshaw1998, package = "metadat")

m <- metagen(TE = yi, seTE = sqrt(vi), studlab = paste(author, year),
             data = dat.hackshaw1998, sm = "OR",
             common = FALSE, random = TRUE)

# Limit meta-analysis: shrunken estimates as if each study were infinitely large
lim <- limitmeta(m)
funnel(lim, shrunken = TRUE, col.line = "#b5452b", lwd = 2,
       bg = "#9fb3c8", col = "#1d4e89",
       xlab = "Odds ratio (log scale)")
References
- Rücker G, Schwarzer G, Carpenter JR, Binder H, Schumacher M. Treatment-effect estimates adjusted for small-study effects via a limit meta-analysis. Biostatistics. 2011;12:122-142. doi:10.1093/biostatistics/kxq046
- Rücker G, Carpenter JR, Schwarzer G. Detecting and adjusting for small-study effects in meta-analysis. Biom J. 2011;53:351-368. doi:10.1002/bimj.201000151