Selection model weight function plot
Publication probability function, step-function selection model
metadat::dat.hackshaw1998.
metafor::selmodel(), weightr; Stata user-written tools
What it shows
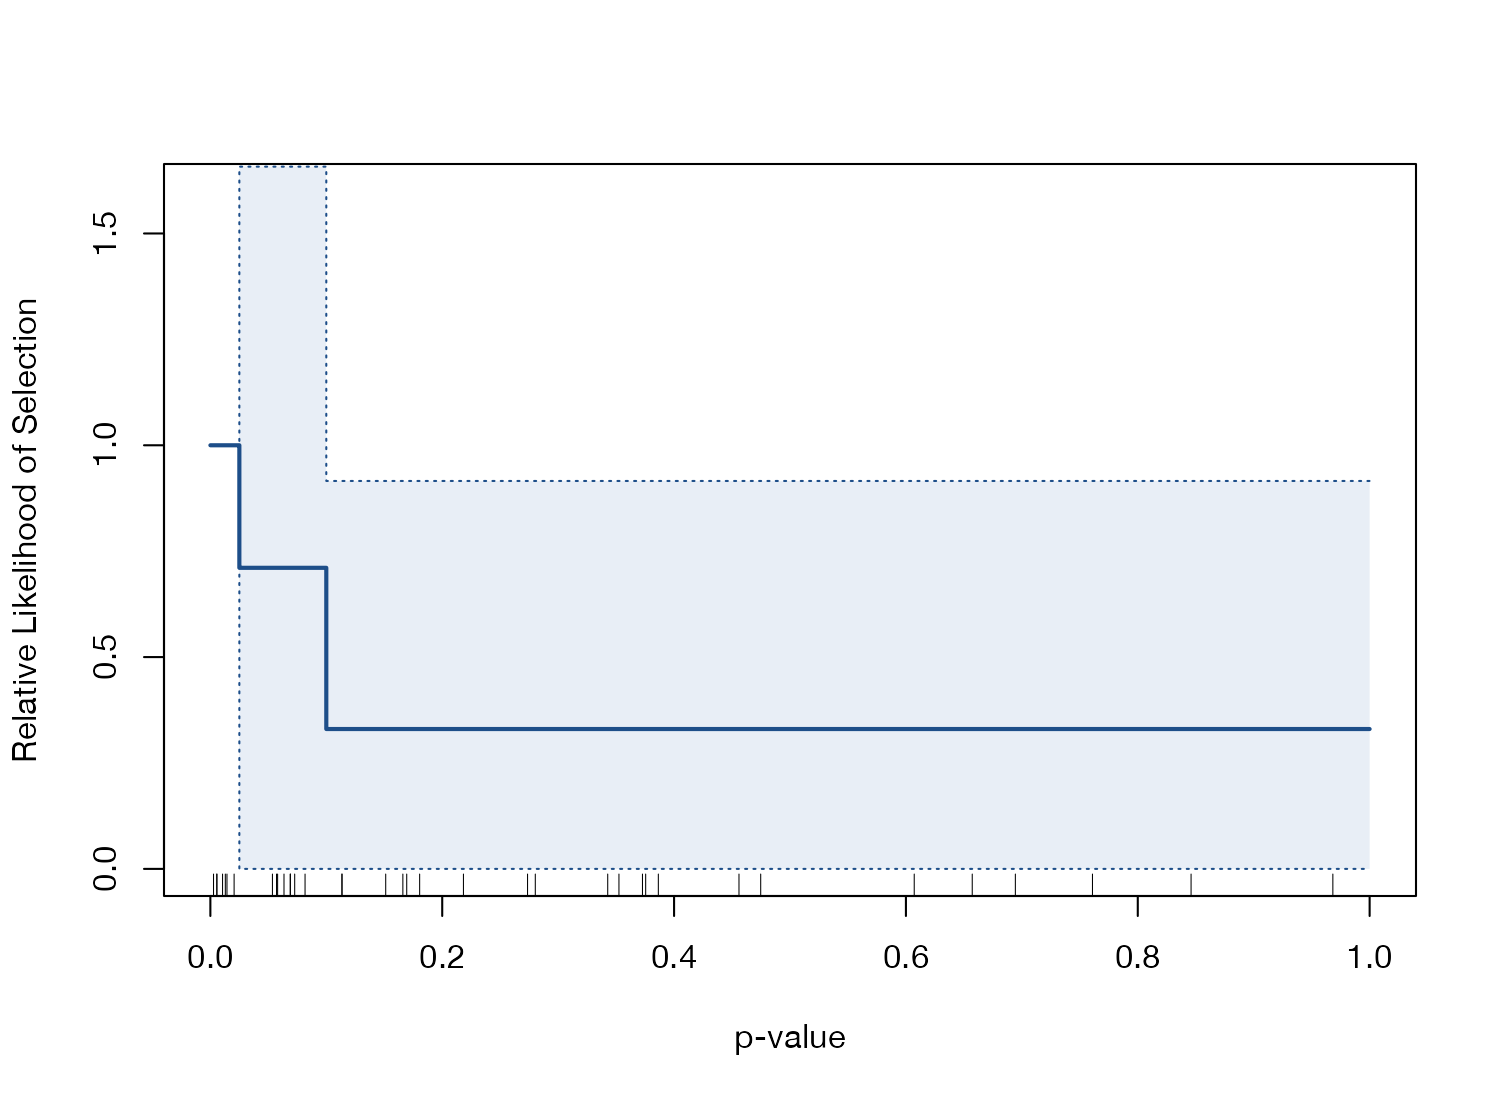
Selection models write down a mechanism for publication bias: the probability that a study is observed depends on its p-value. A step-function model (Hedges, Vevea and Hedges) lets that probability change at chosen cutpoints such as 0.025 and 0.10 one-sided. The model is fitted jointly with the random-effects meta-analysis, which yields an adjusted pooled estimate. The plot displays the estimated weight function, the heart of the model.
How to read it
- Horizontal axis: one-sided p-value of a study.
- Vertical axis: relative likelihood of selection, with the first interval fixed at 1.
- Step line: the estimated weights; lower steps mean less likely to be published.
- Band: 95% confidence interval of the weights.
- Rug: observed study p-values.
Interpretation
Studies with one-sided \(p\) between 0.025 and 0.10 are estimated to be published at about 71% of the rate of clearly significant studies, and those with \(p > 0.10\) at about 33%. The intervals are wide and the likelihood ratio test of no selection is not significant (\(p = 0.39\)). The adjusted odds ratio is 1.12 (95% CI 0.96 to 1.31), lower than the unadjusted 1.24 and no longer statistically significant.
Pitfalls
- The cutpoints and the functional form are assumptions; results can change with them. Report several.
- With few studies per interval, weights are poorly estimated.
- Selection models assume selection works through p-values in a particular way; other forms of bias are not captured.
- The adjusted estimate is a sensitivity analysis, not a corrected truth.
Code
library(metafor)

data(dat.hackshaw1998, package = "metadat")

fit <- rma(yi, vi, data = dat.hackshaw1998, method = "ML")

# Step-function selection model: relative probability of publication for
# one-sided p-values in (0, 0.025], (0.025, 0.10], and (0.10, 1]
sel <- selmodel(fit, type = "stepfun", steps = c(0.025, 0.10, 1),
                alternative = "greater")

plot(sel, ci = TRUE, col = "#1d4e89", shade = "#e8eef6",
     rug = TRUE, ylim = c(0, 1.6), main = "")
References
- Vevea JL, Hedges LV. A general linear model for estimating effect size in the presence of publication bias. Psychometrika. 1995;60:419-435. doi:10.1007/BF02294384
- Hedges LV. Modeling publication selection effects in meta-analysis. Stat Sci. 1992;7:246-255. doi:10.1214/ss/1177011364