Network meta-interpolation
Plots for NMI using subgroup analyses
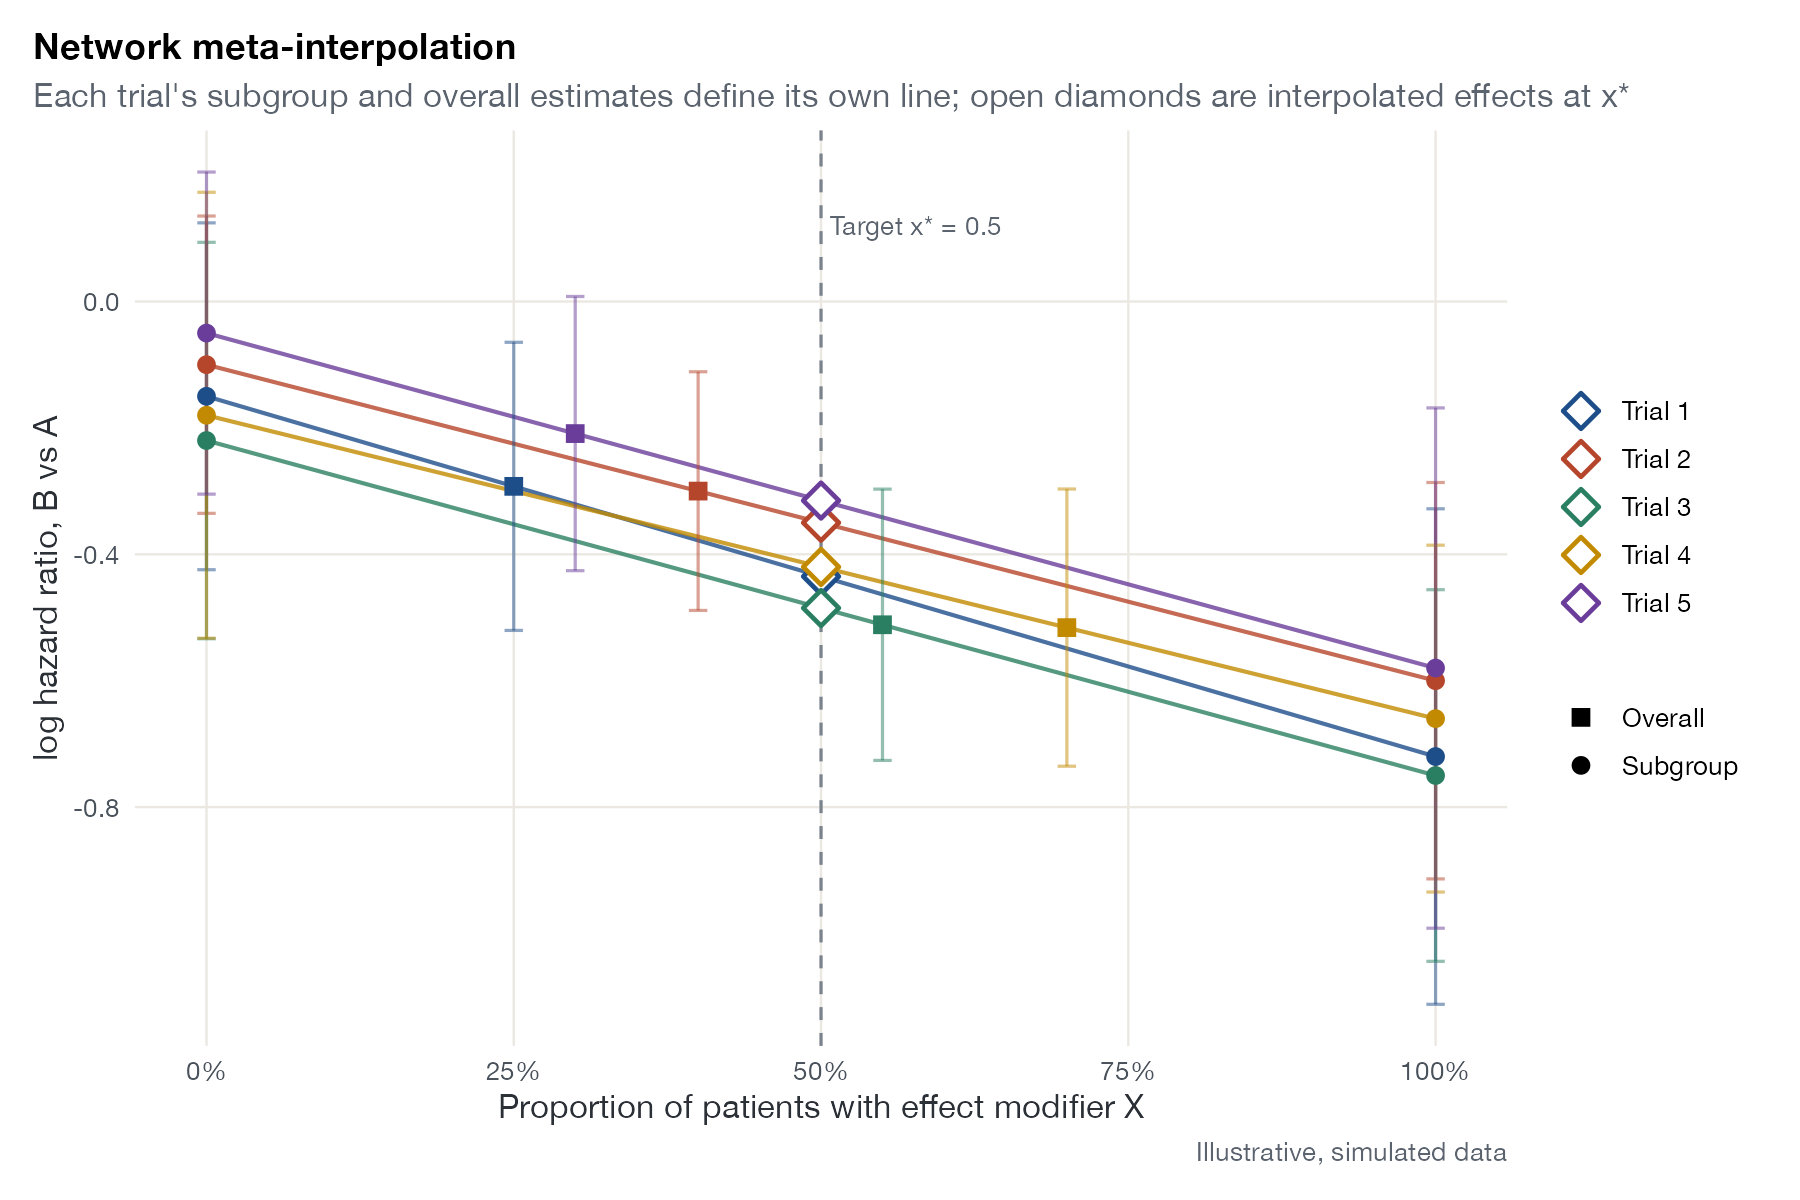
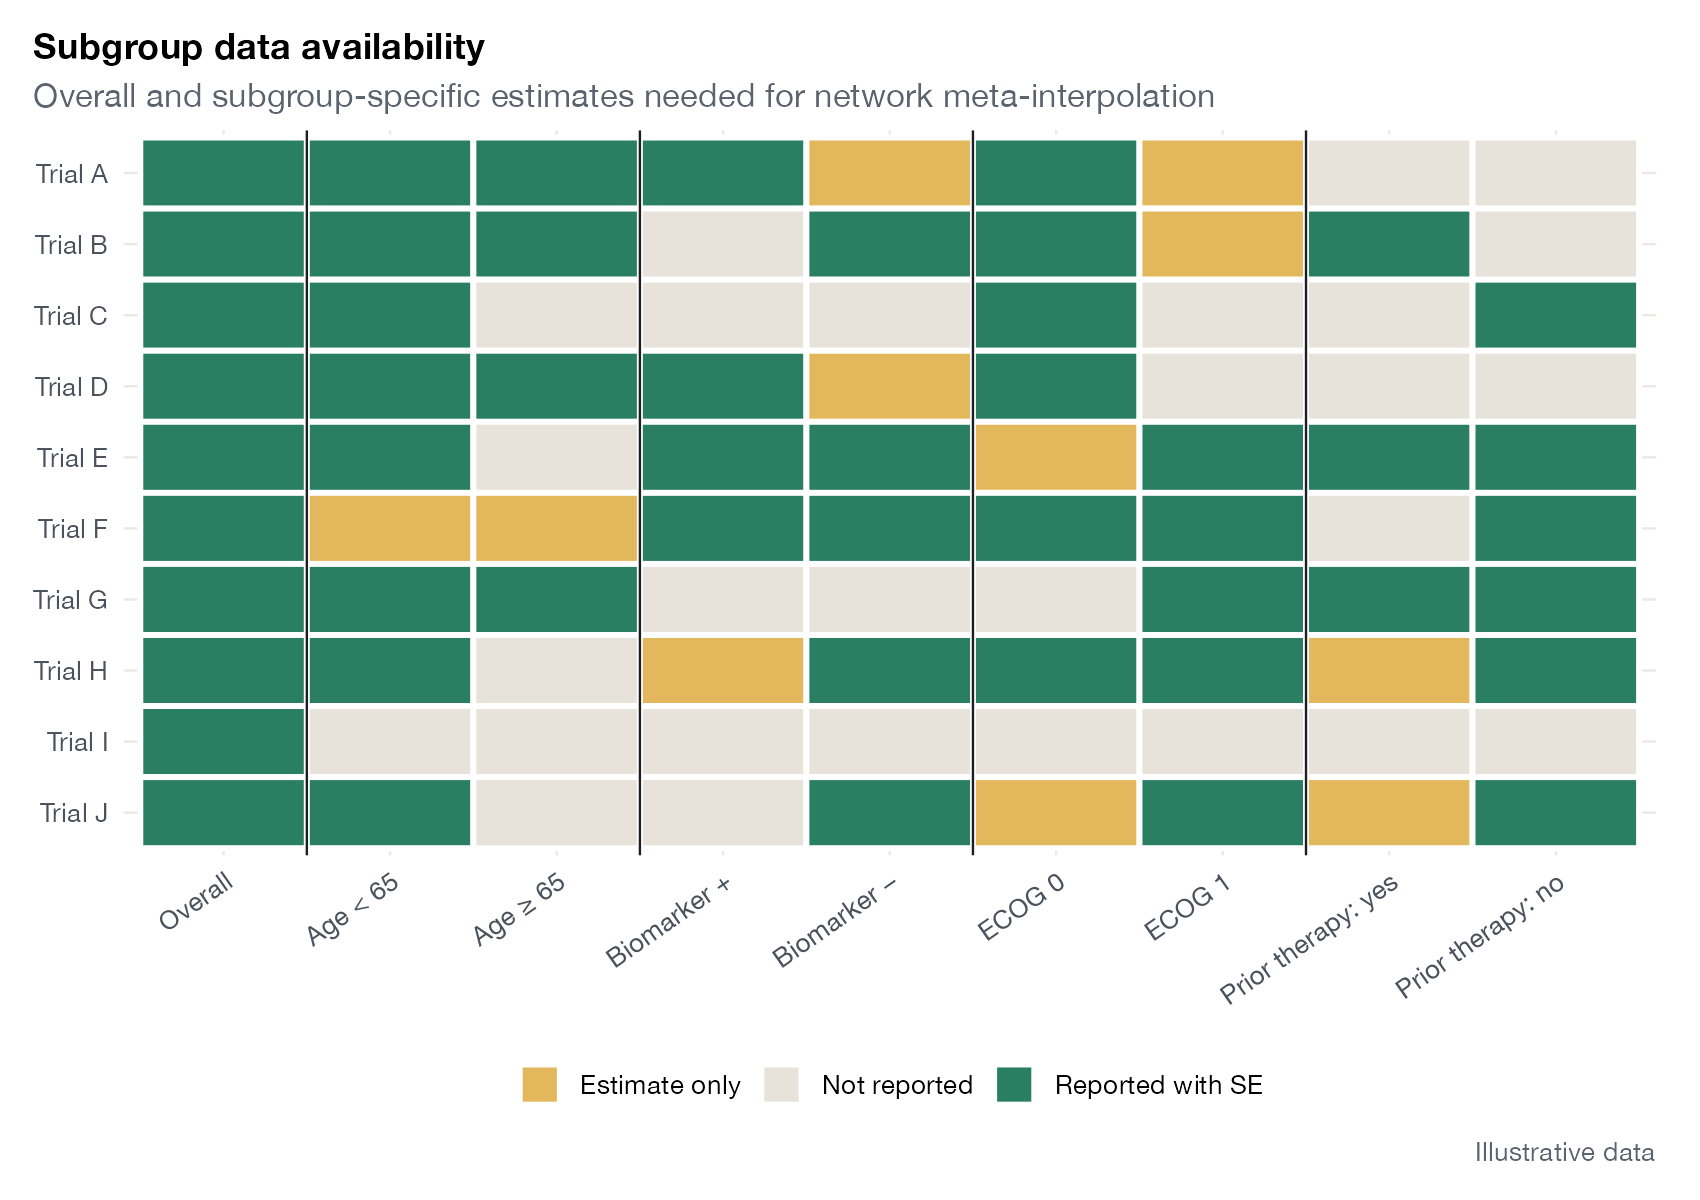
Network meta-interpolation (Harari and colleagues, 2023) uses the subgroup results that trials routinely publish to estimate how treatment effects change with effect modifiers, study by study, and interpolates each trial’s effect to a common set of effect-modifier values before running a standard NMA. Unlike most meta-regression approaches, it does not assume that effect modification is shared across treatments. Its graphics make the interpolation and the data it depends on visible.
Minimum graphical set
- A subgroup data availability matrix.
- The interpolation plot.
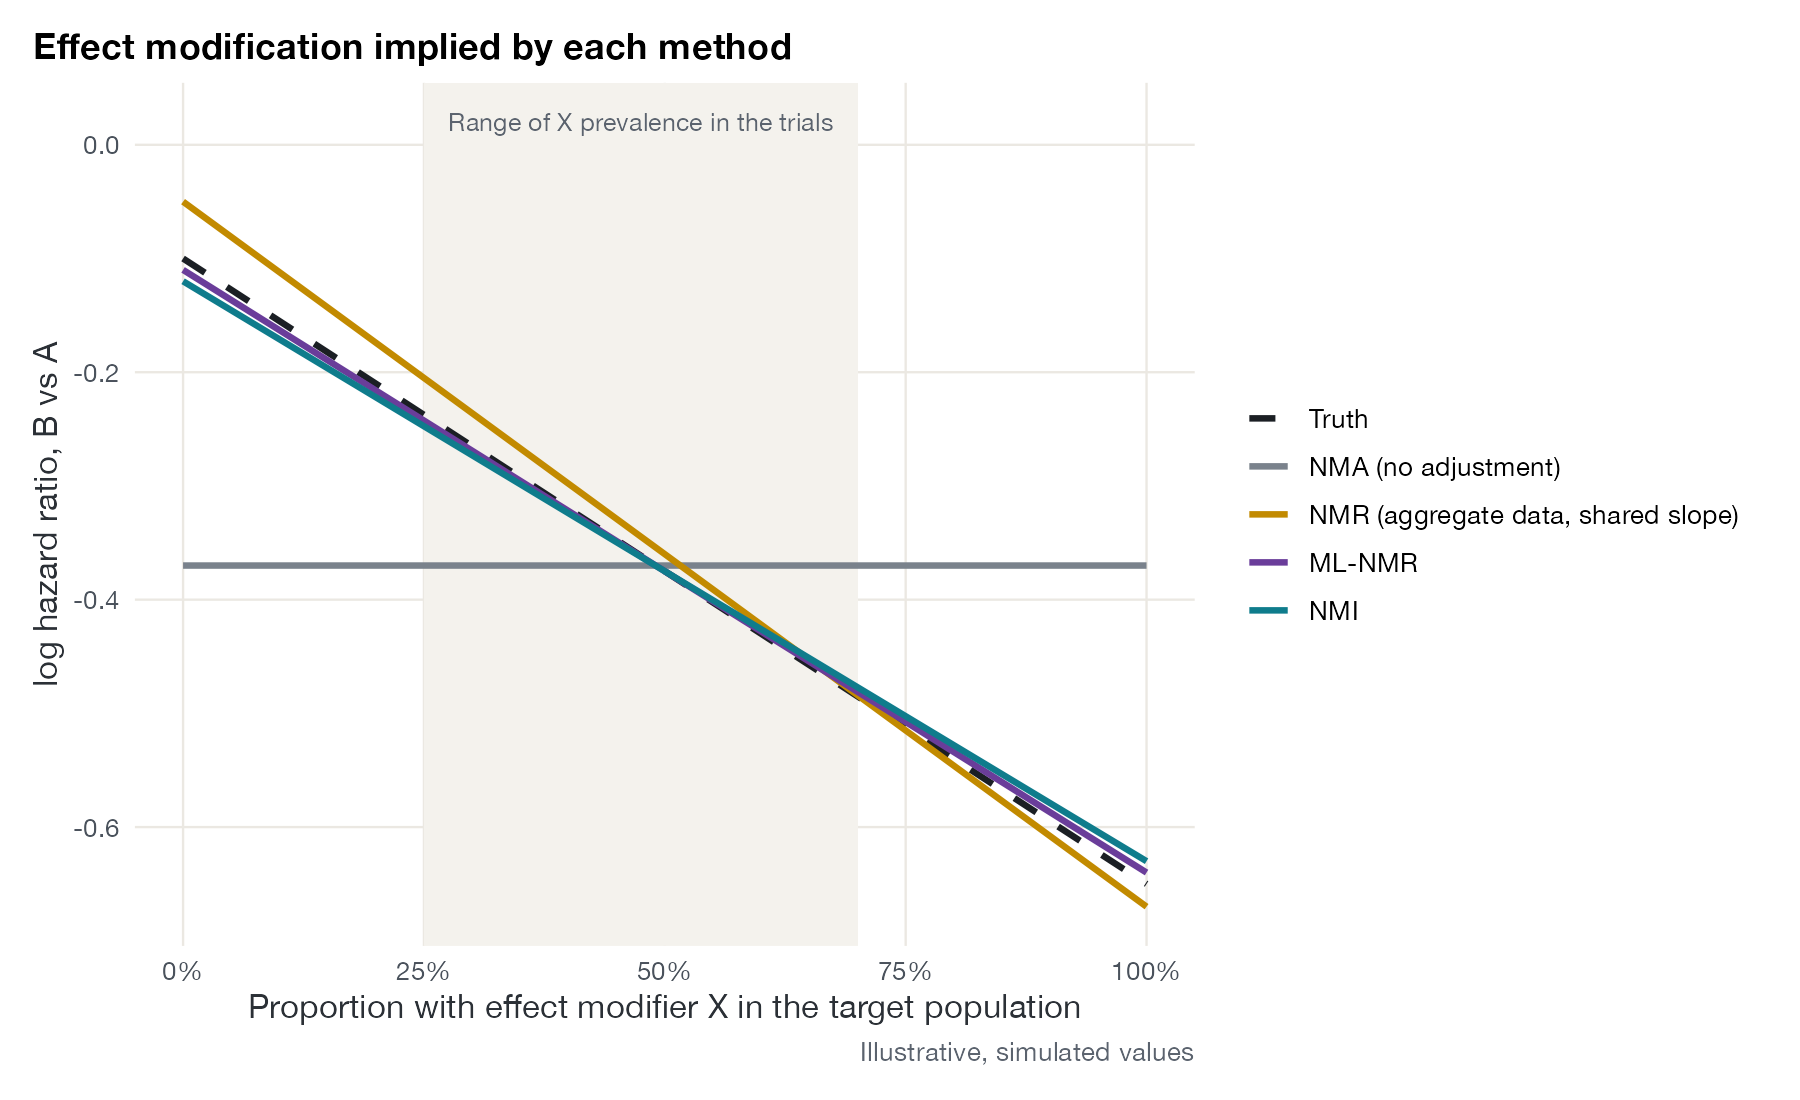
- A comparison of the effect-modifier relationships implied by NMA, NMR, ML-NMR, and NMI.
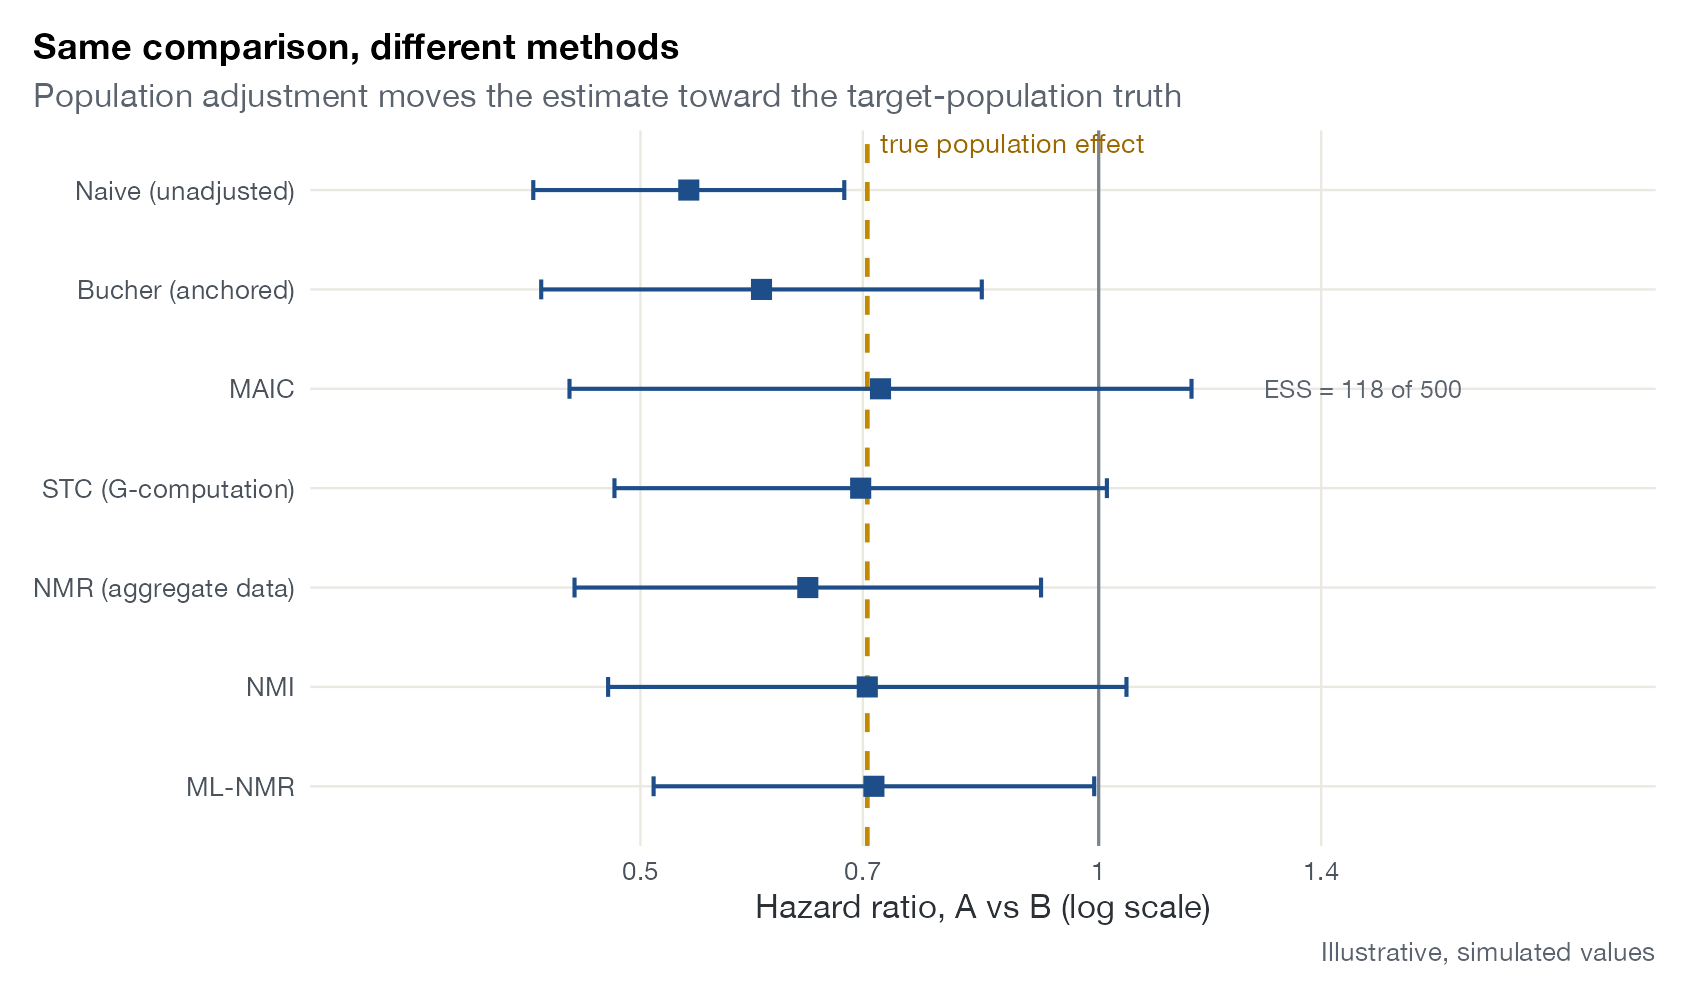
- The adjusted effects as a forest plot or method-comparison forest.
All plots for NMI
Effect display
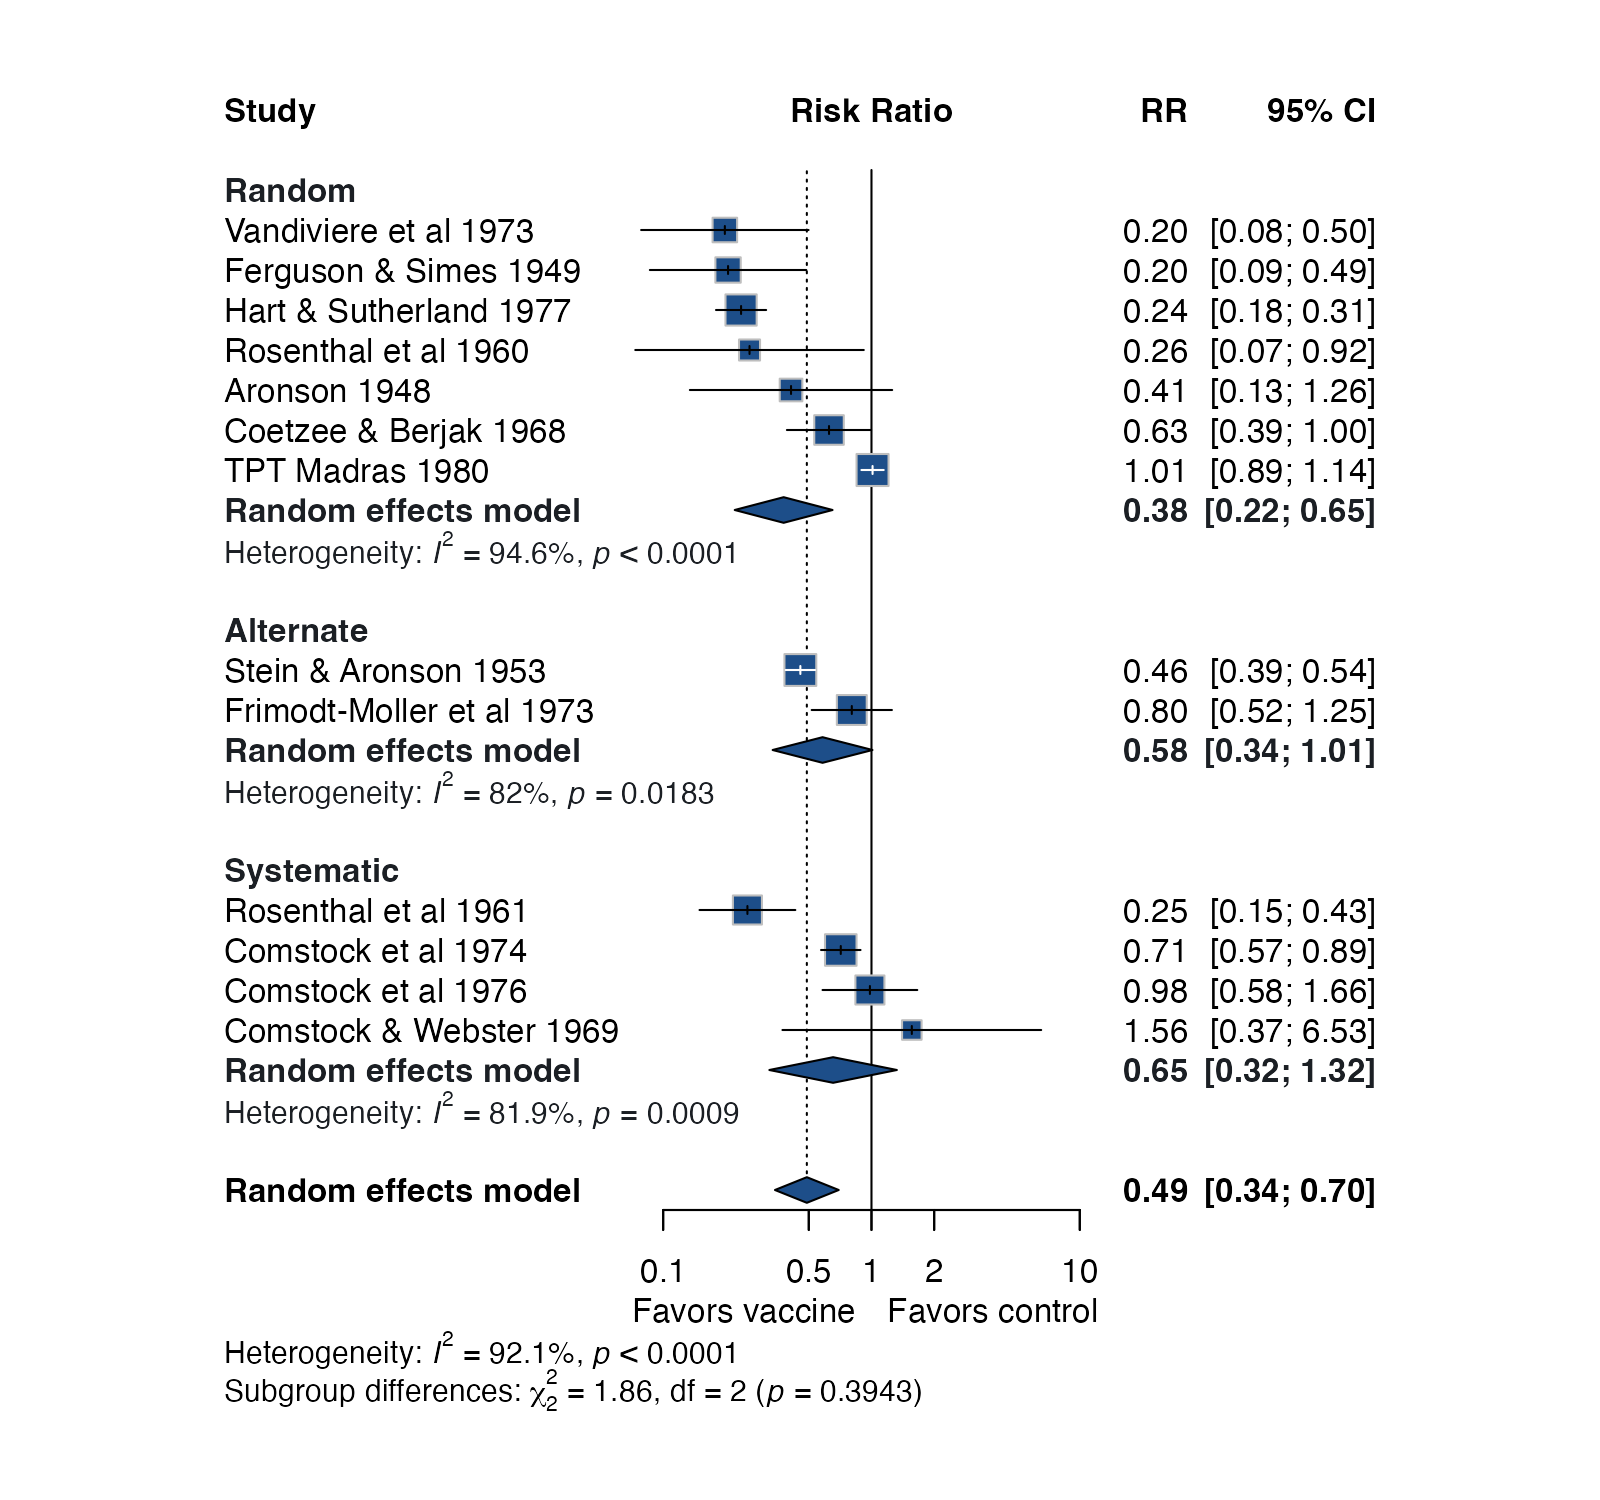
Estimates, intervals, and pooled summaries: the forest plot and its many descendants.
Network geometry and evidence flow
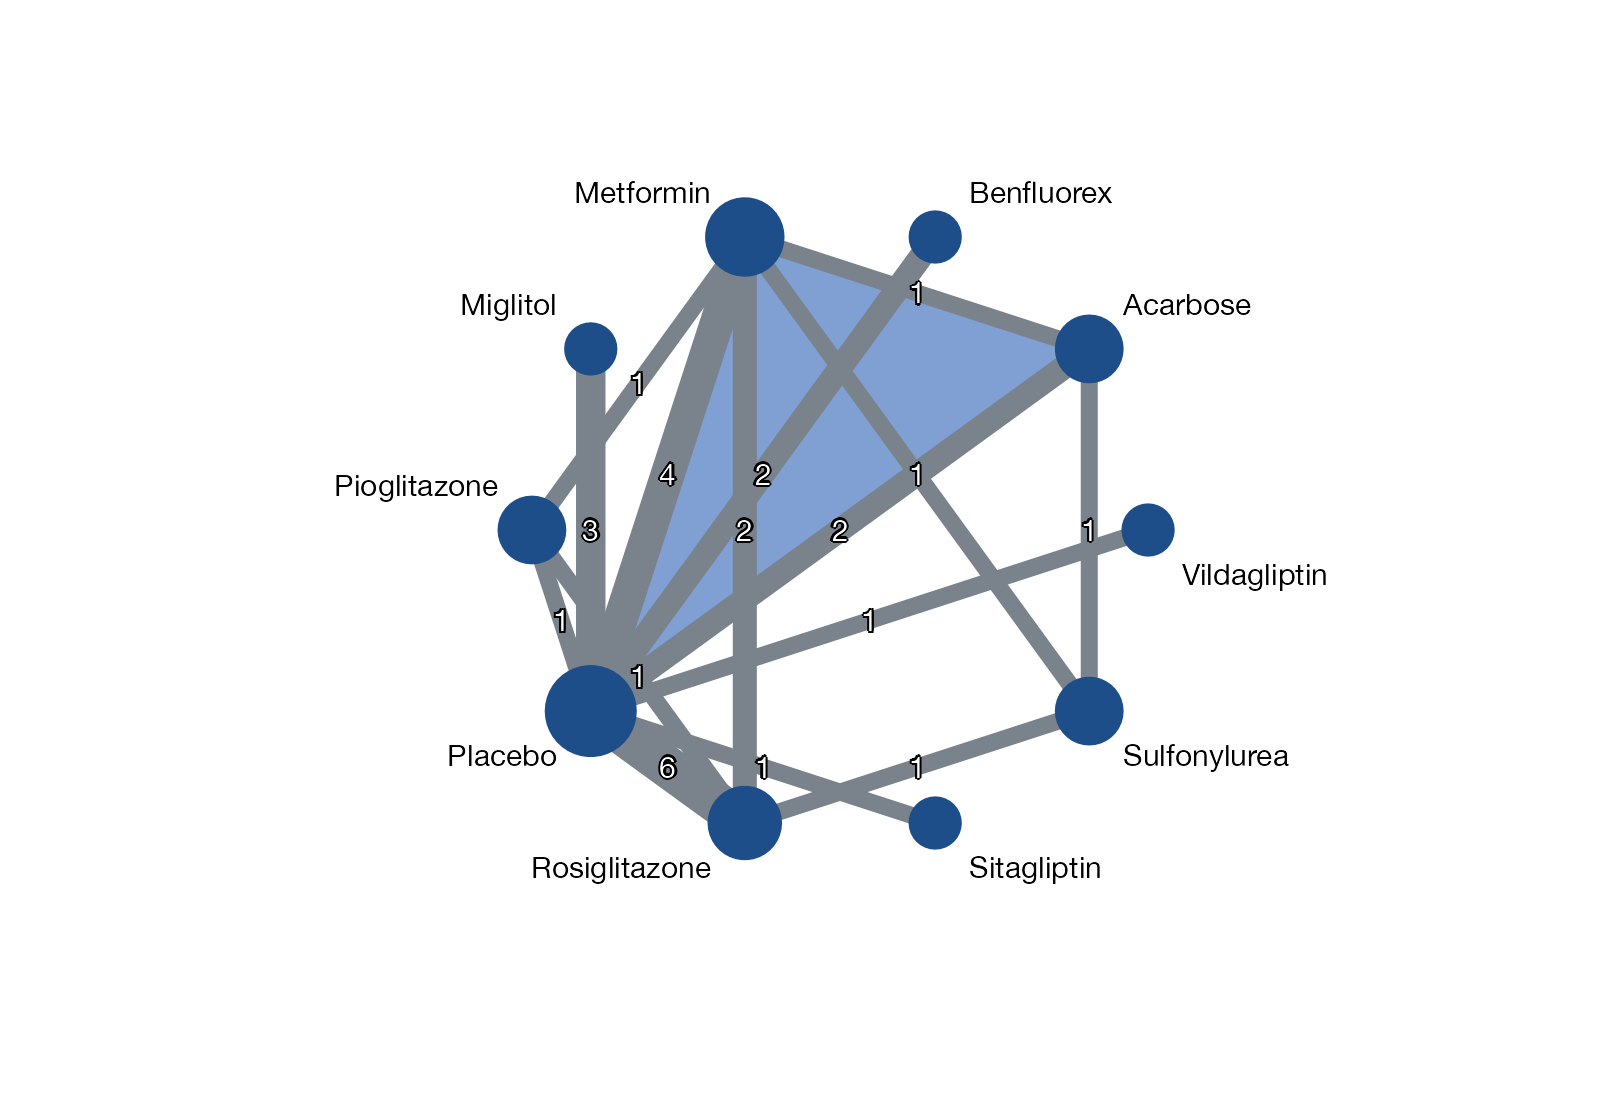
Which treatments are compared directly, how much evidence each comparison carries, and where it flows.
Weighting, balance, and overlap
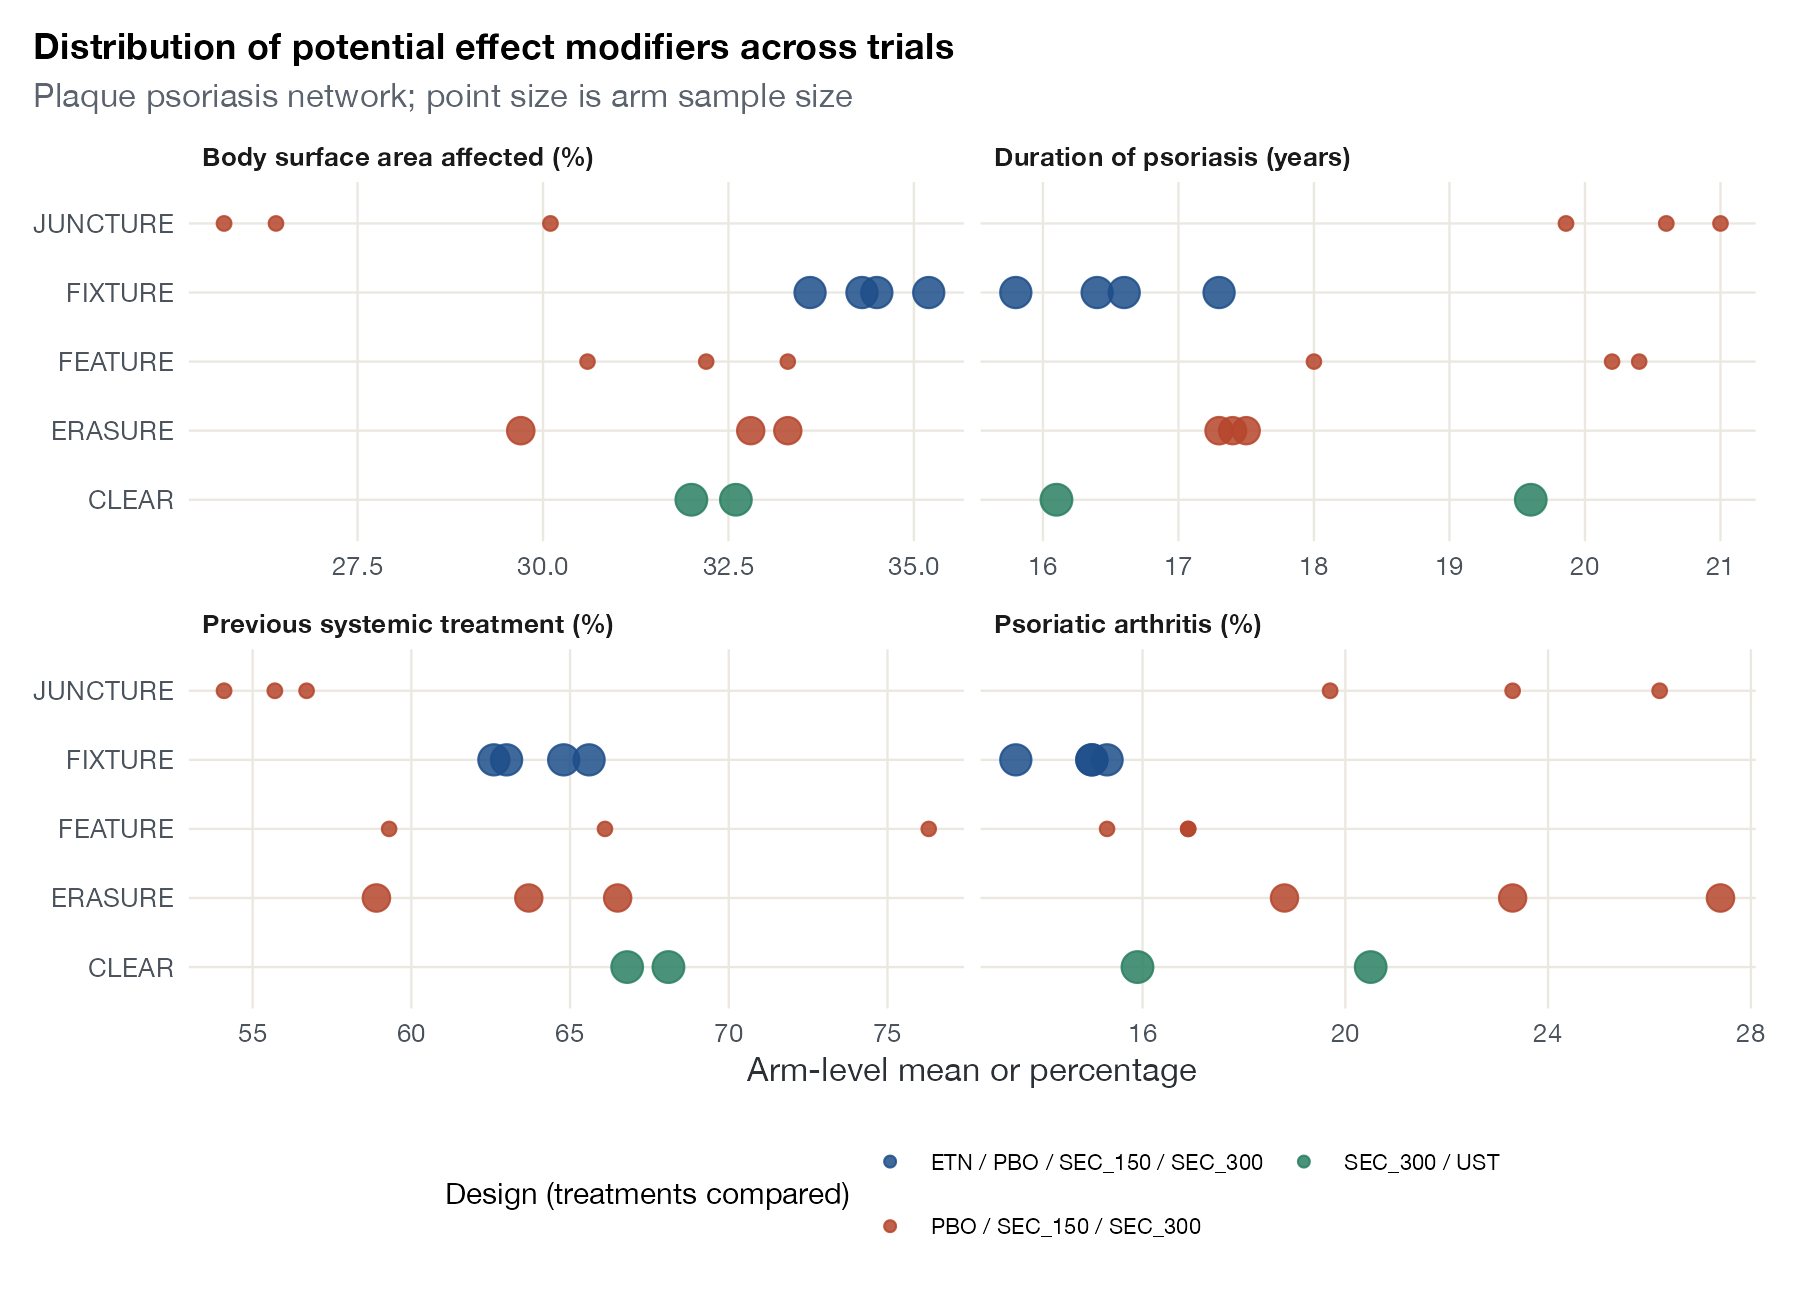
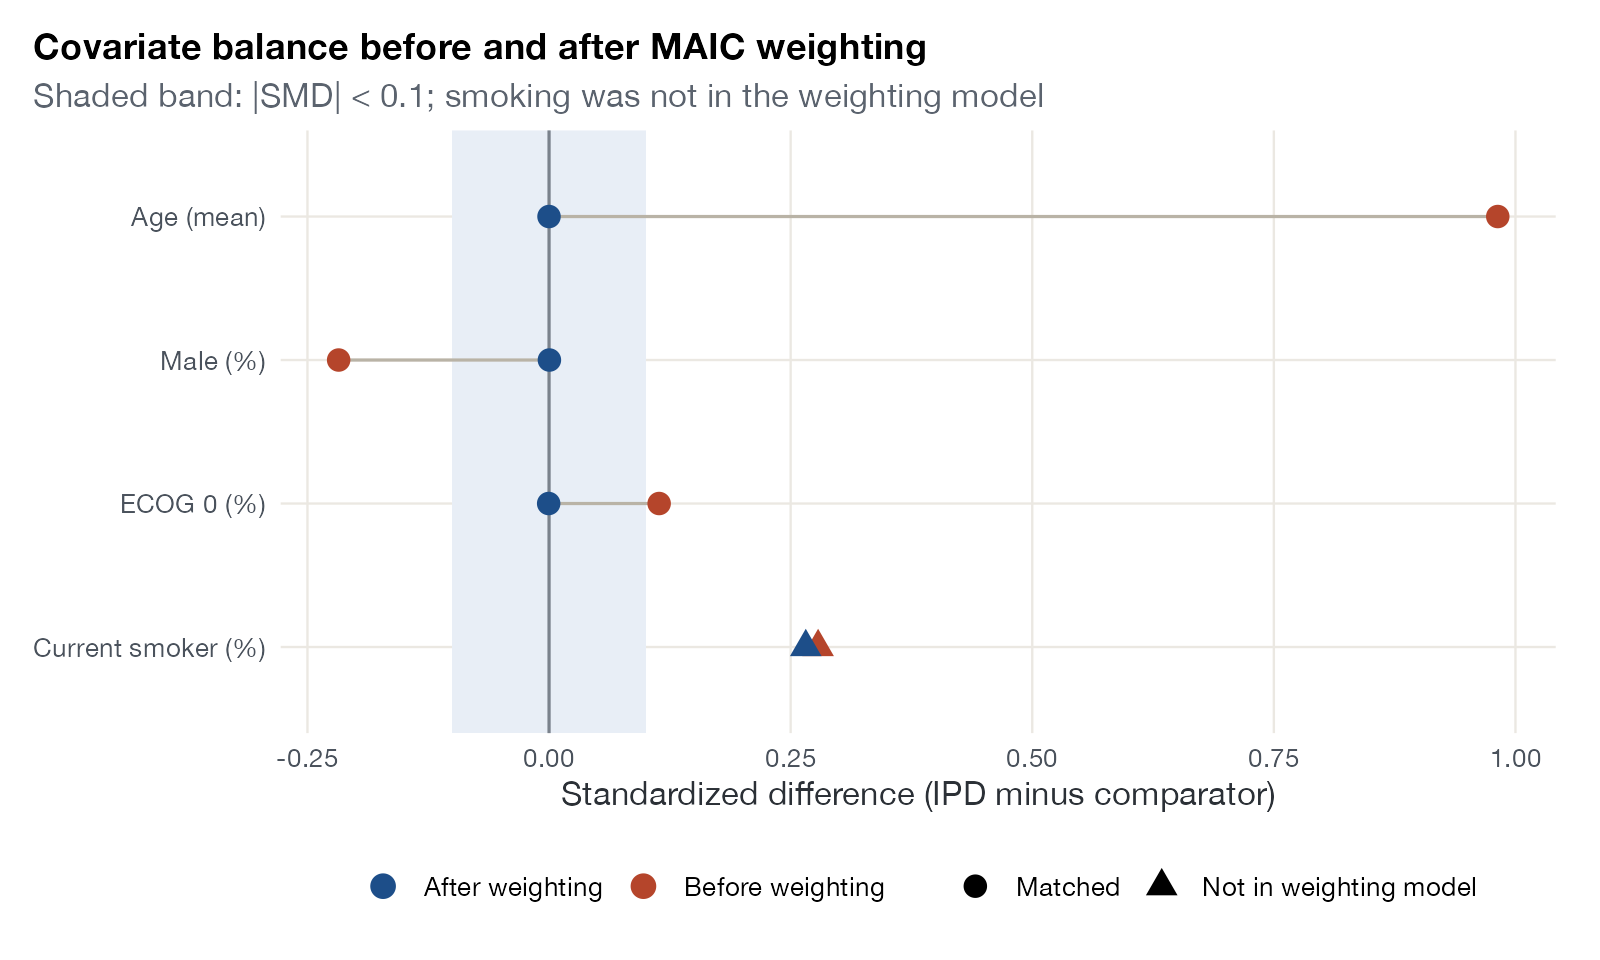
MAIC diagnostics: what the weights did, how much information survived, and whether populations overlap.
Outcome regression and transportability
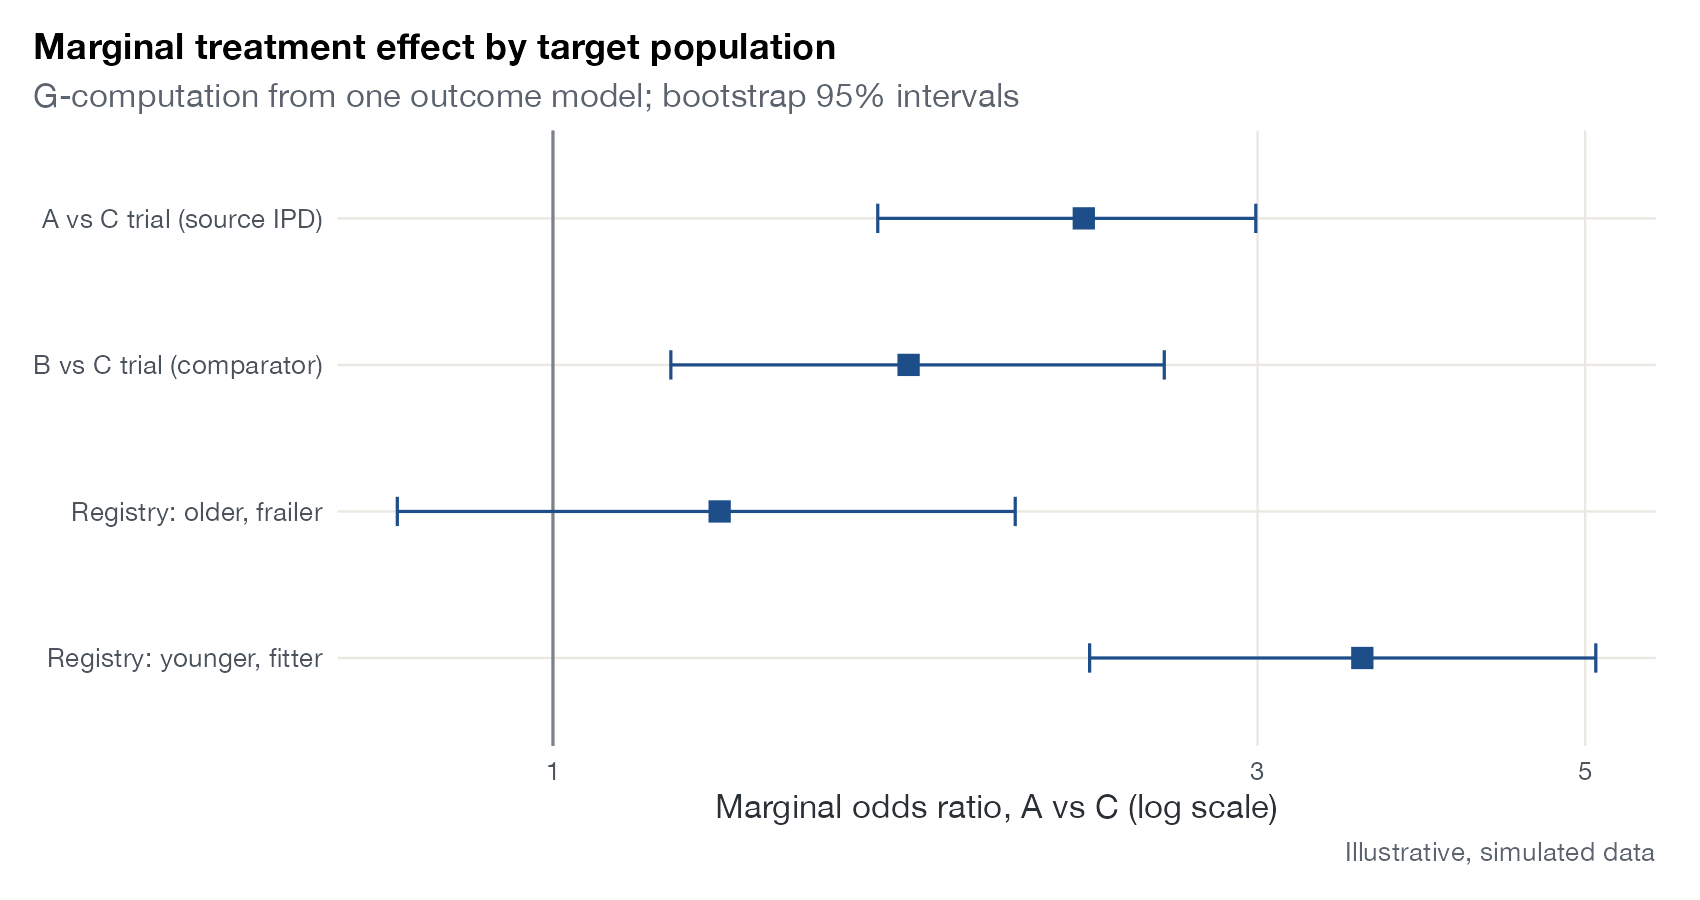
STC and G-computation diagnostics: functional form, extrapolation, and effects in a target population.
Multilevel network meta-regression
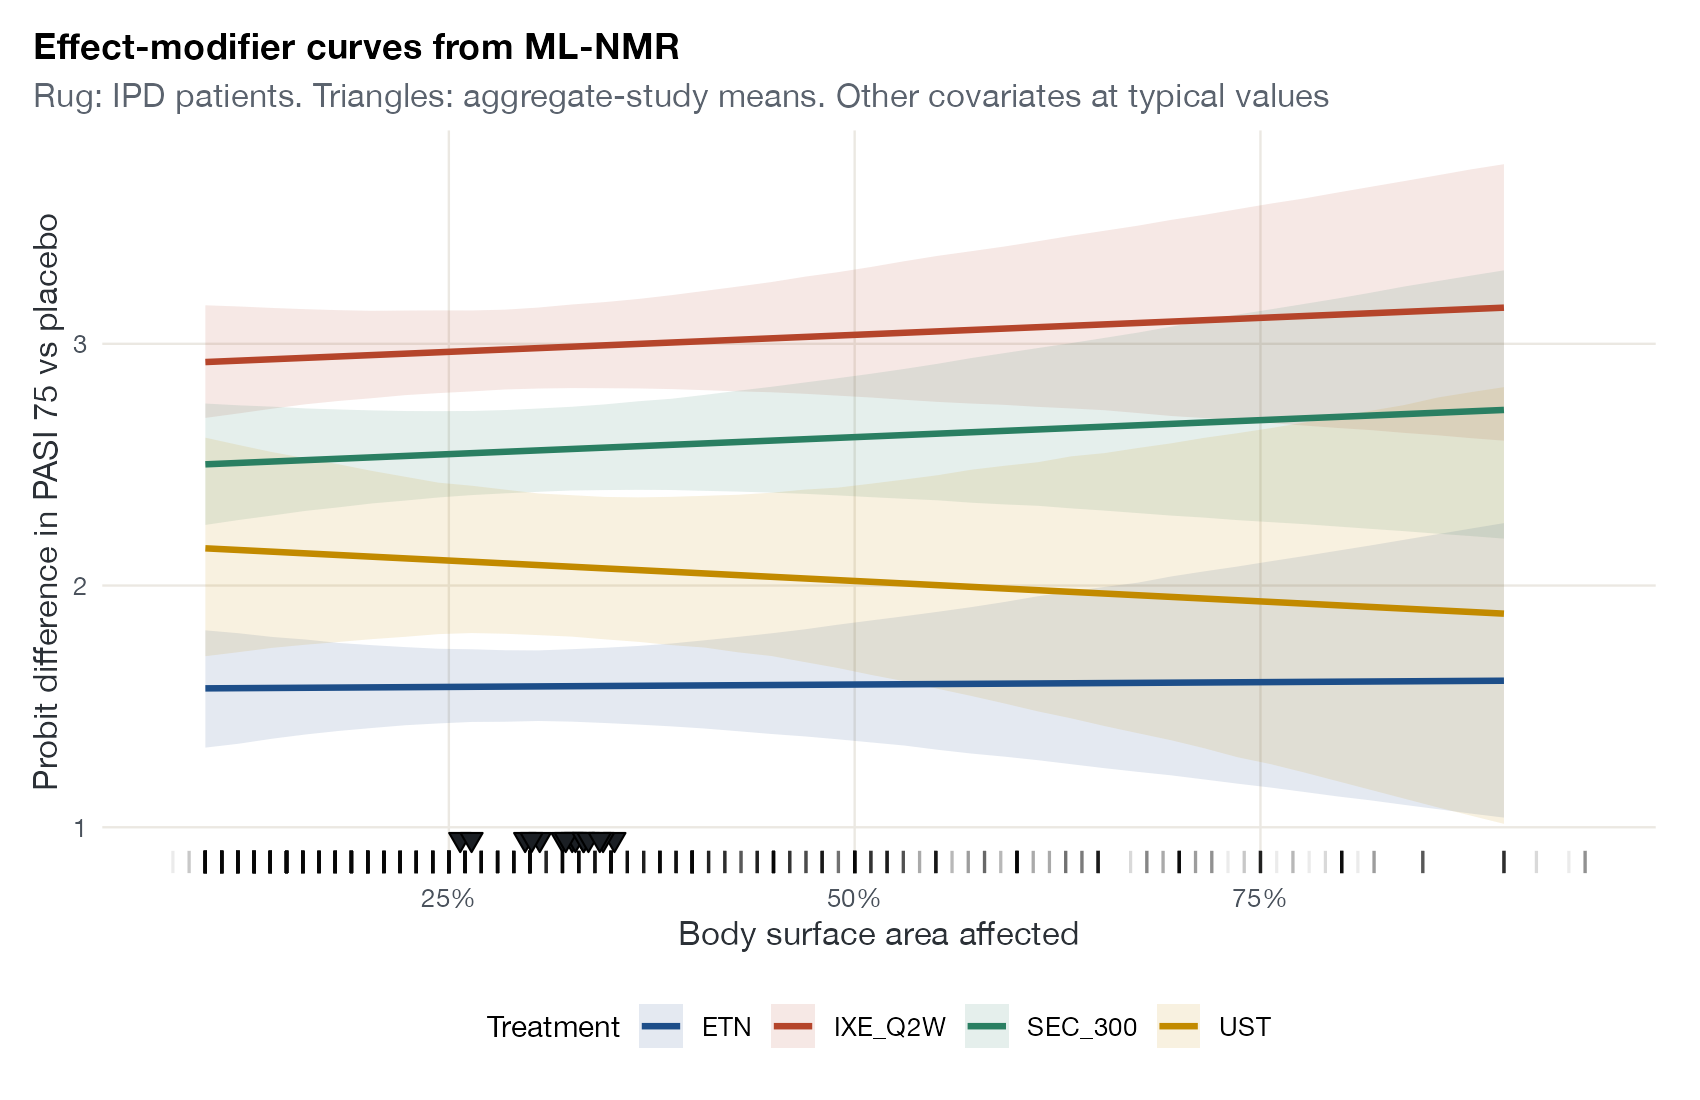
ML-NMR graphics for mixed IPD and aggregate networks, numerical integration, and population-specific effects.
Network meta-interpolation
NMI graphics built on subgroup evidence and interpolation to a common effect-modifier value.
Simulation and method evaluation
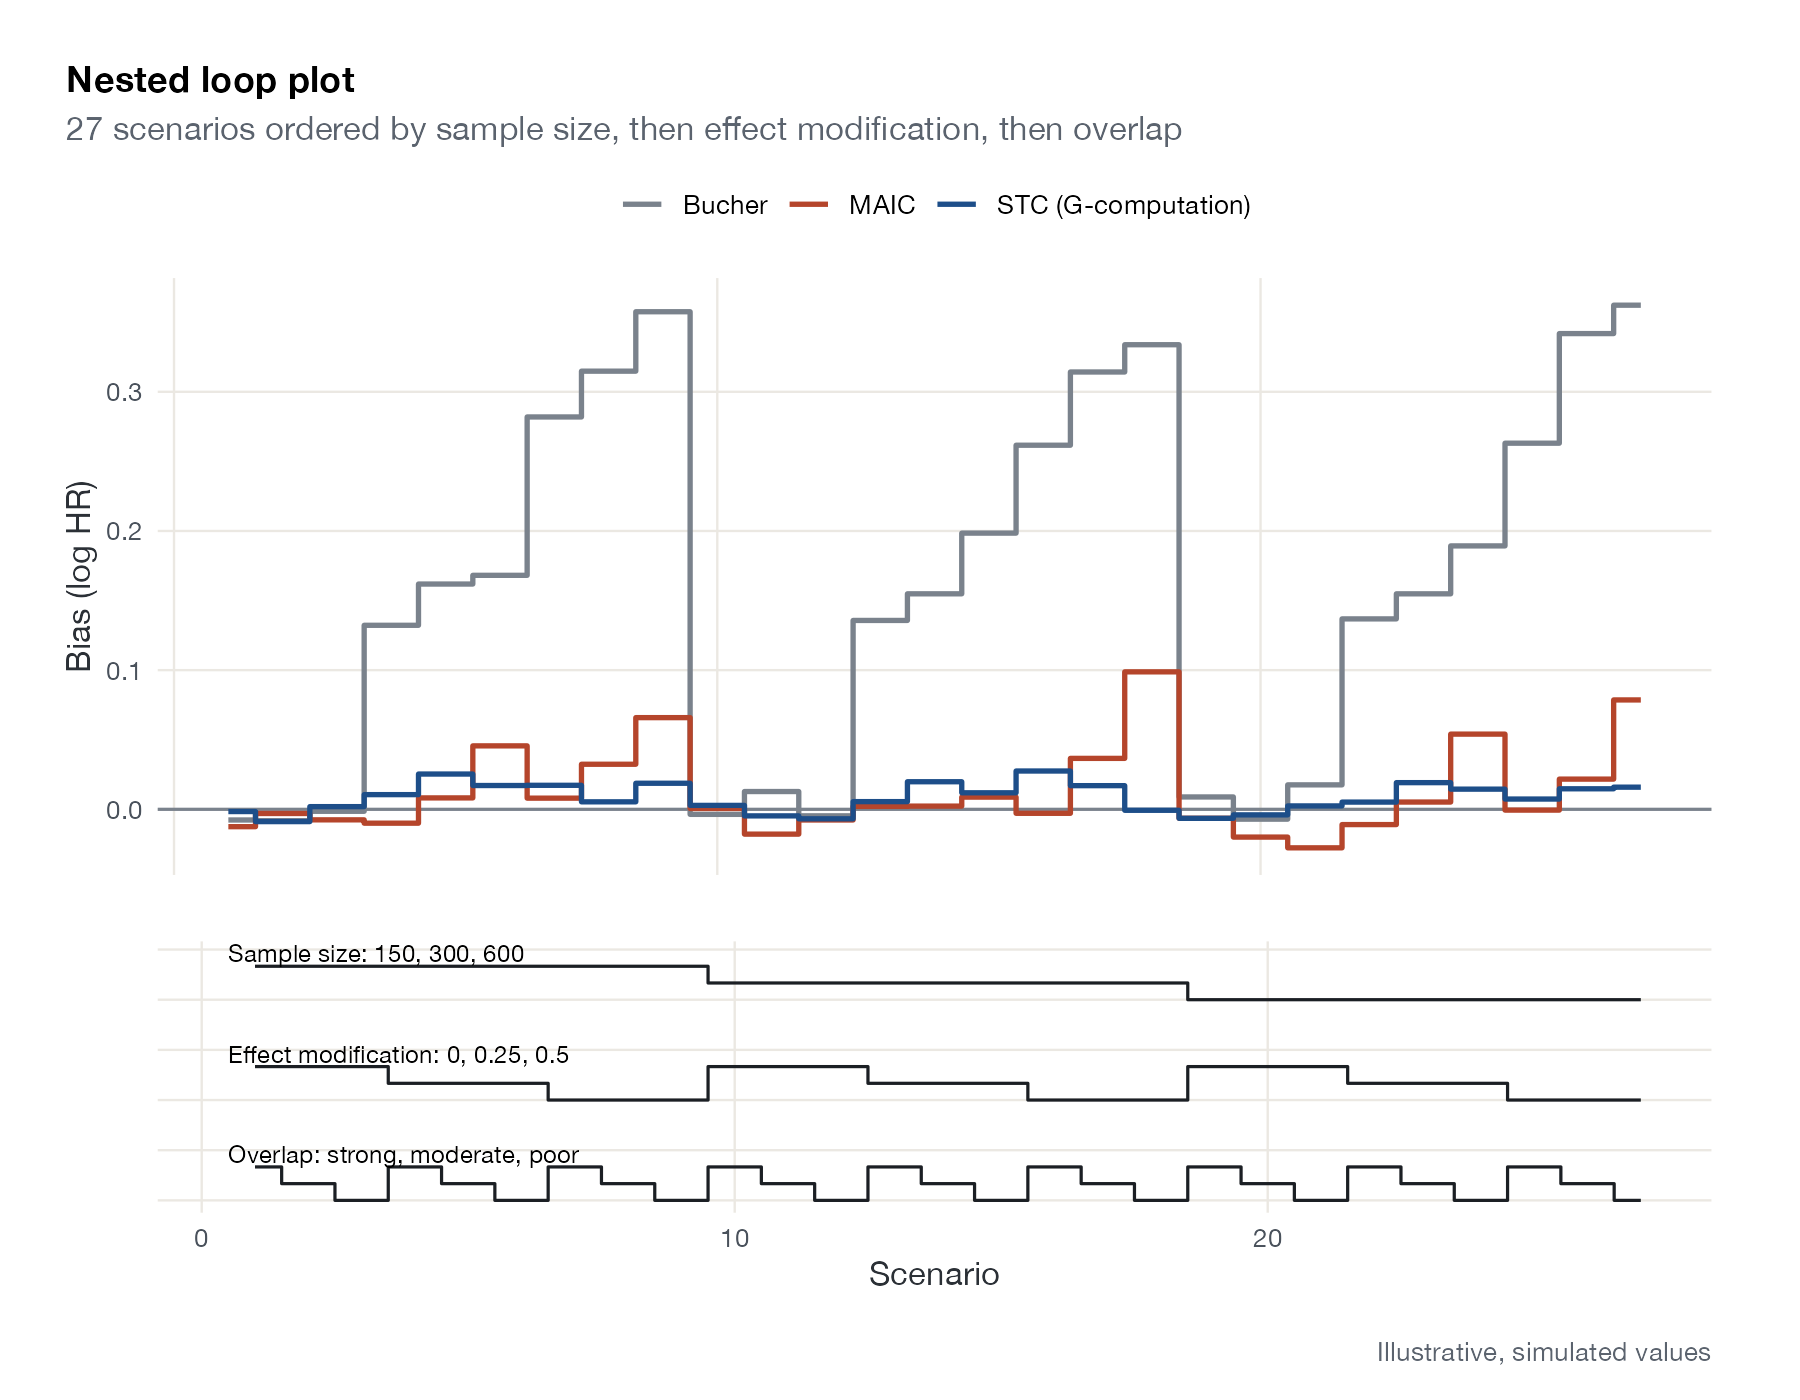
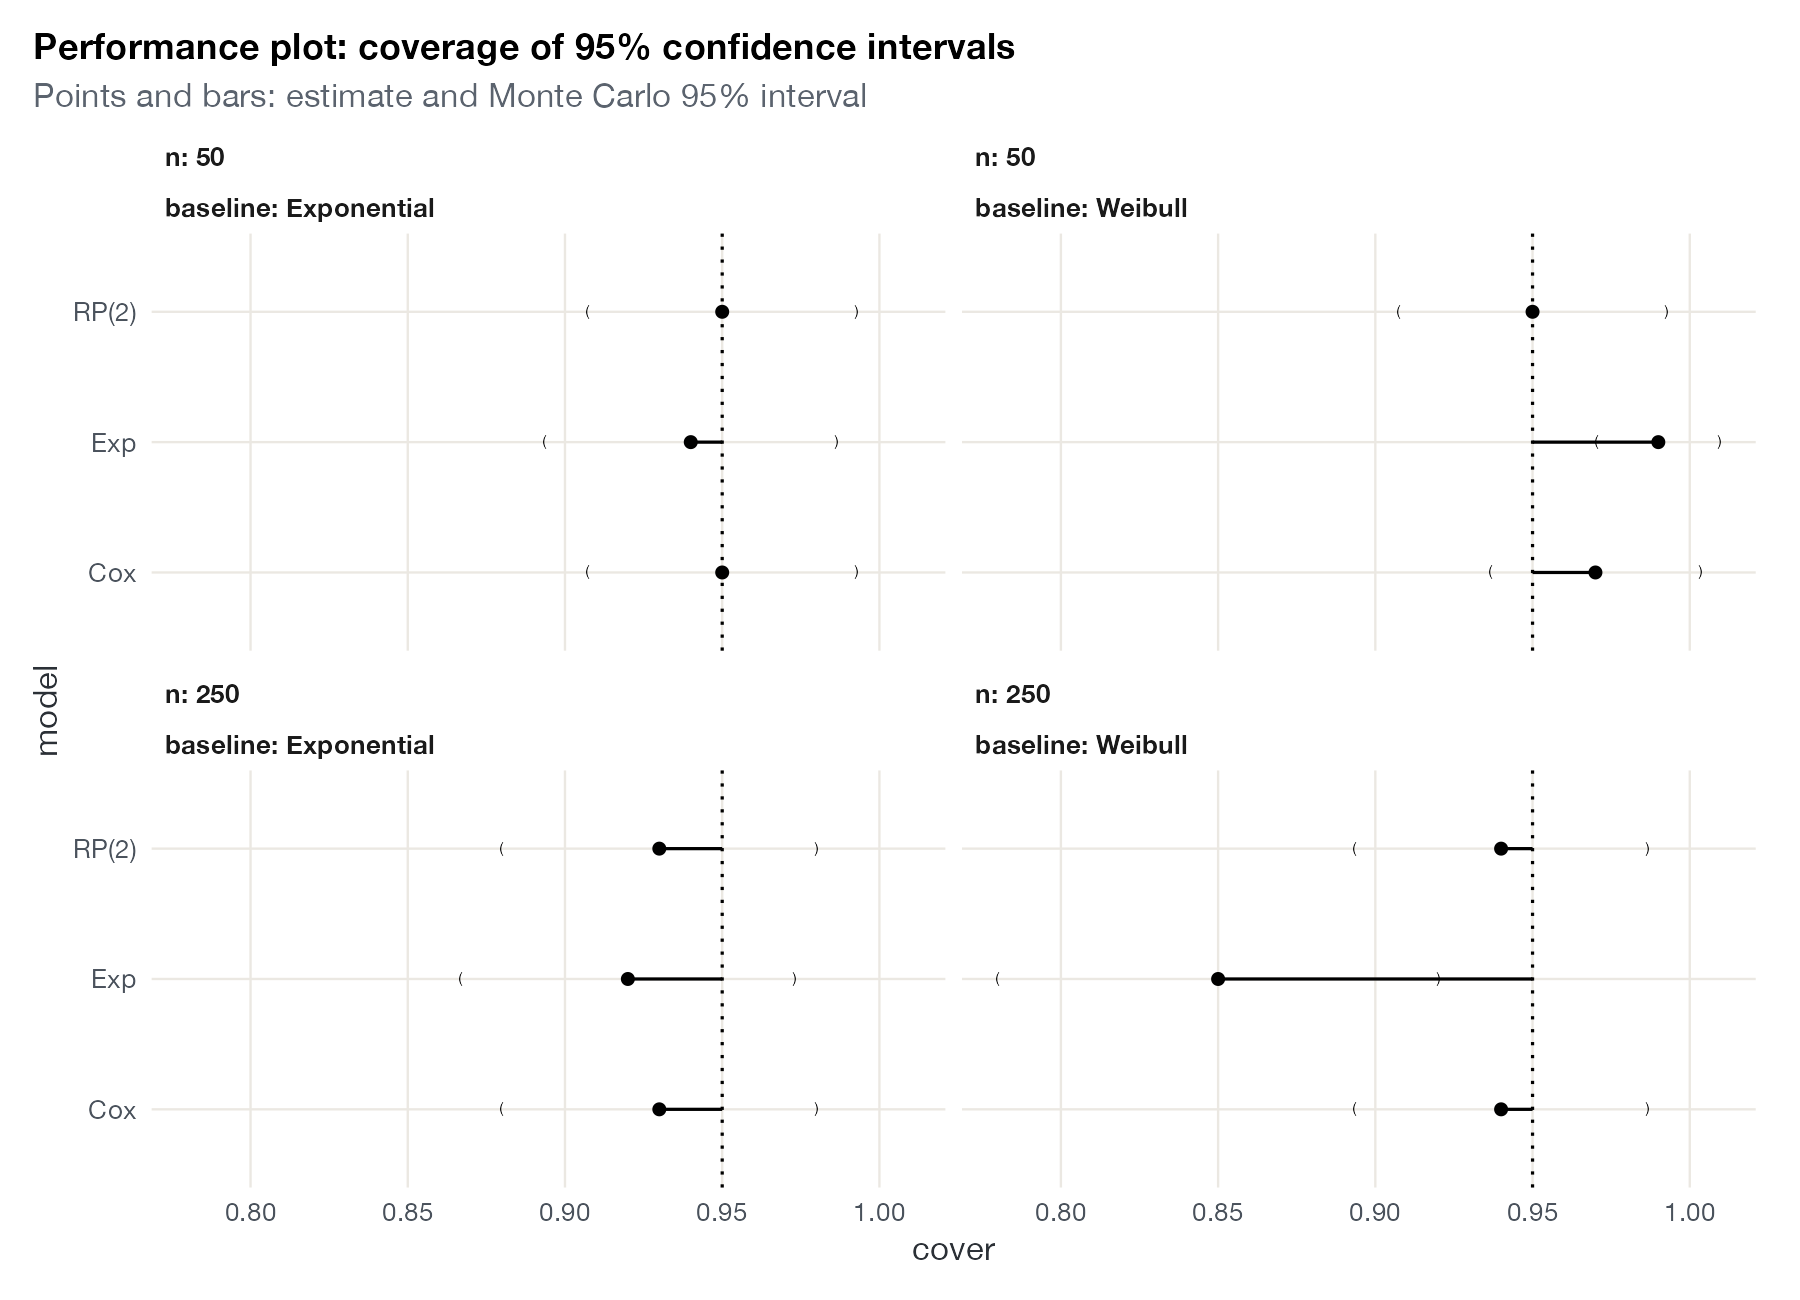
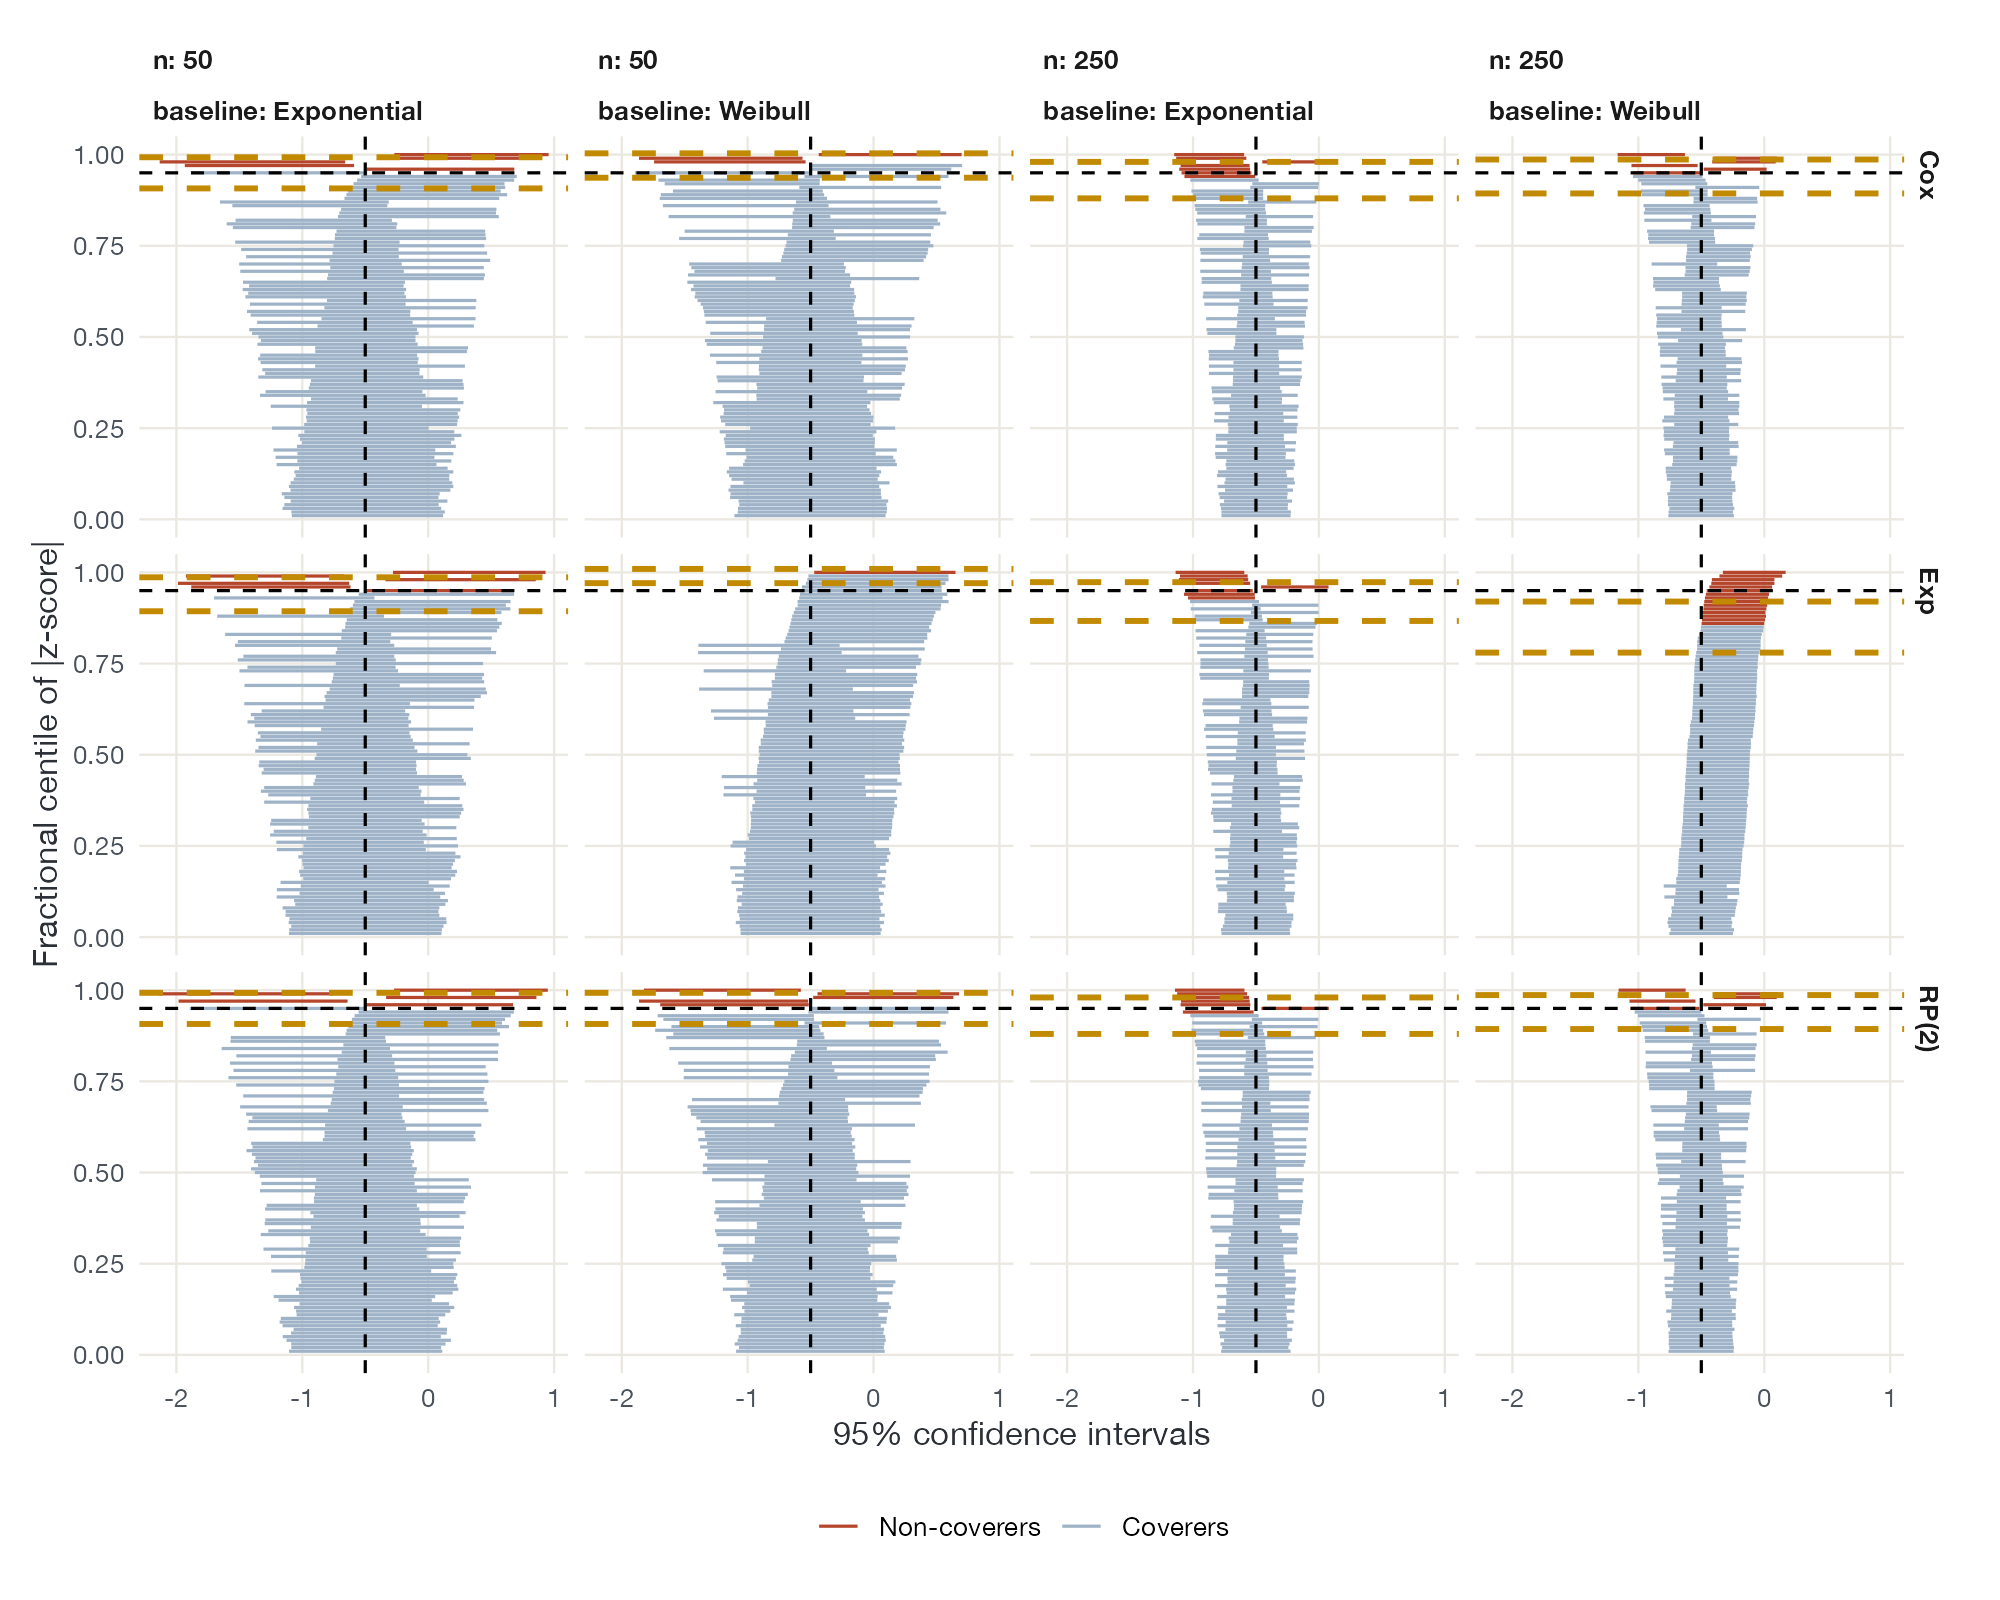
Graphics from the proof-of-concept literature that evaluates methods under known truth.
No plots match this filter. Try another method or search term.