Matching-adjusted indirect comparison
Plots for MAIC, anchored and unanchored
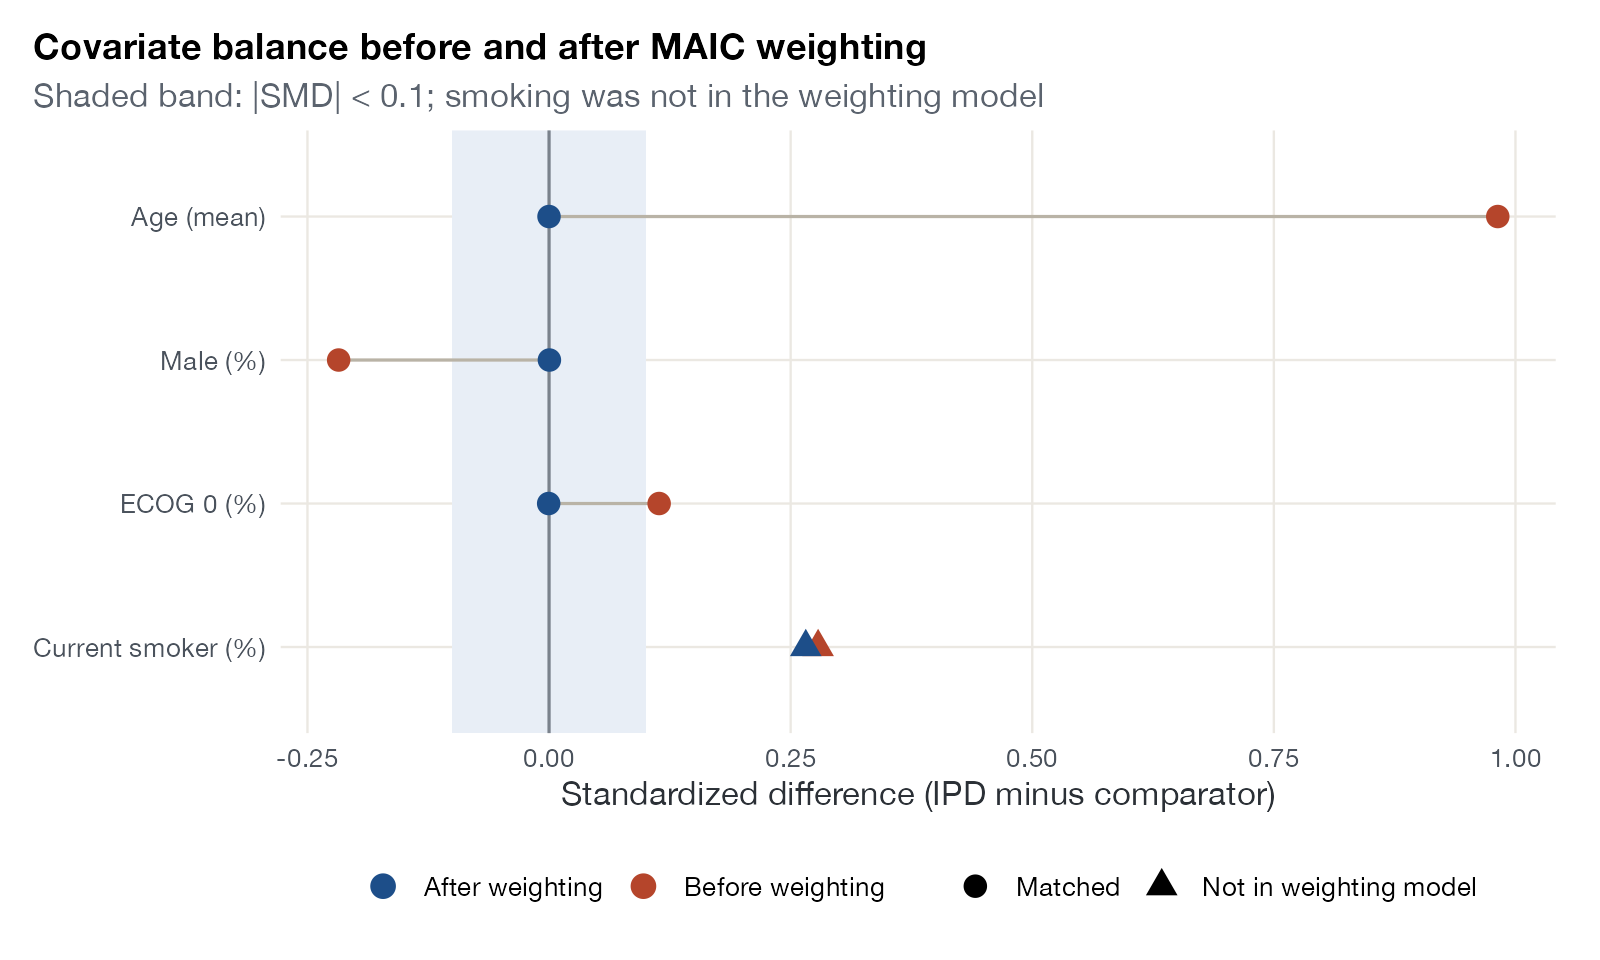
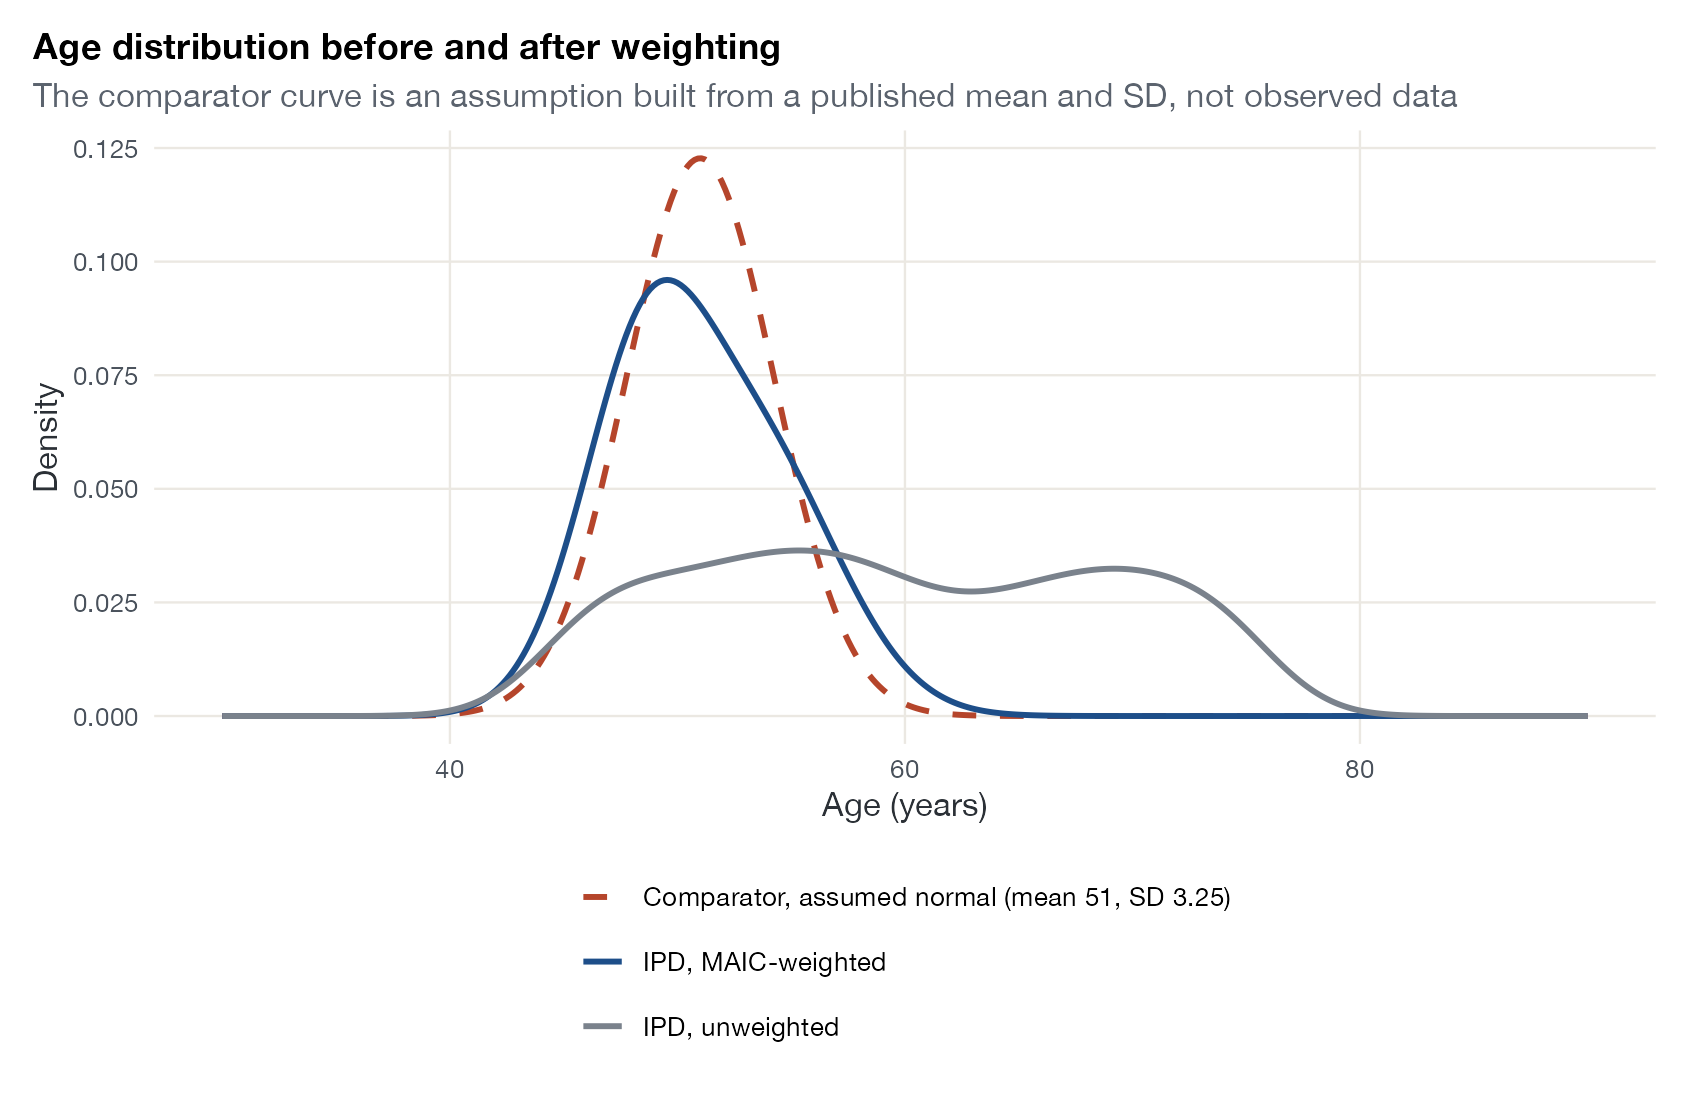
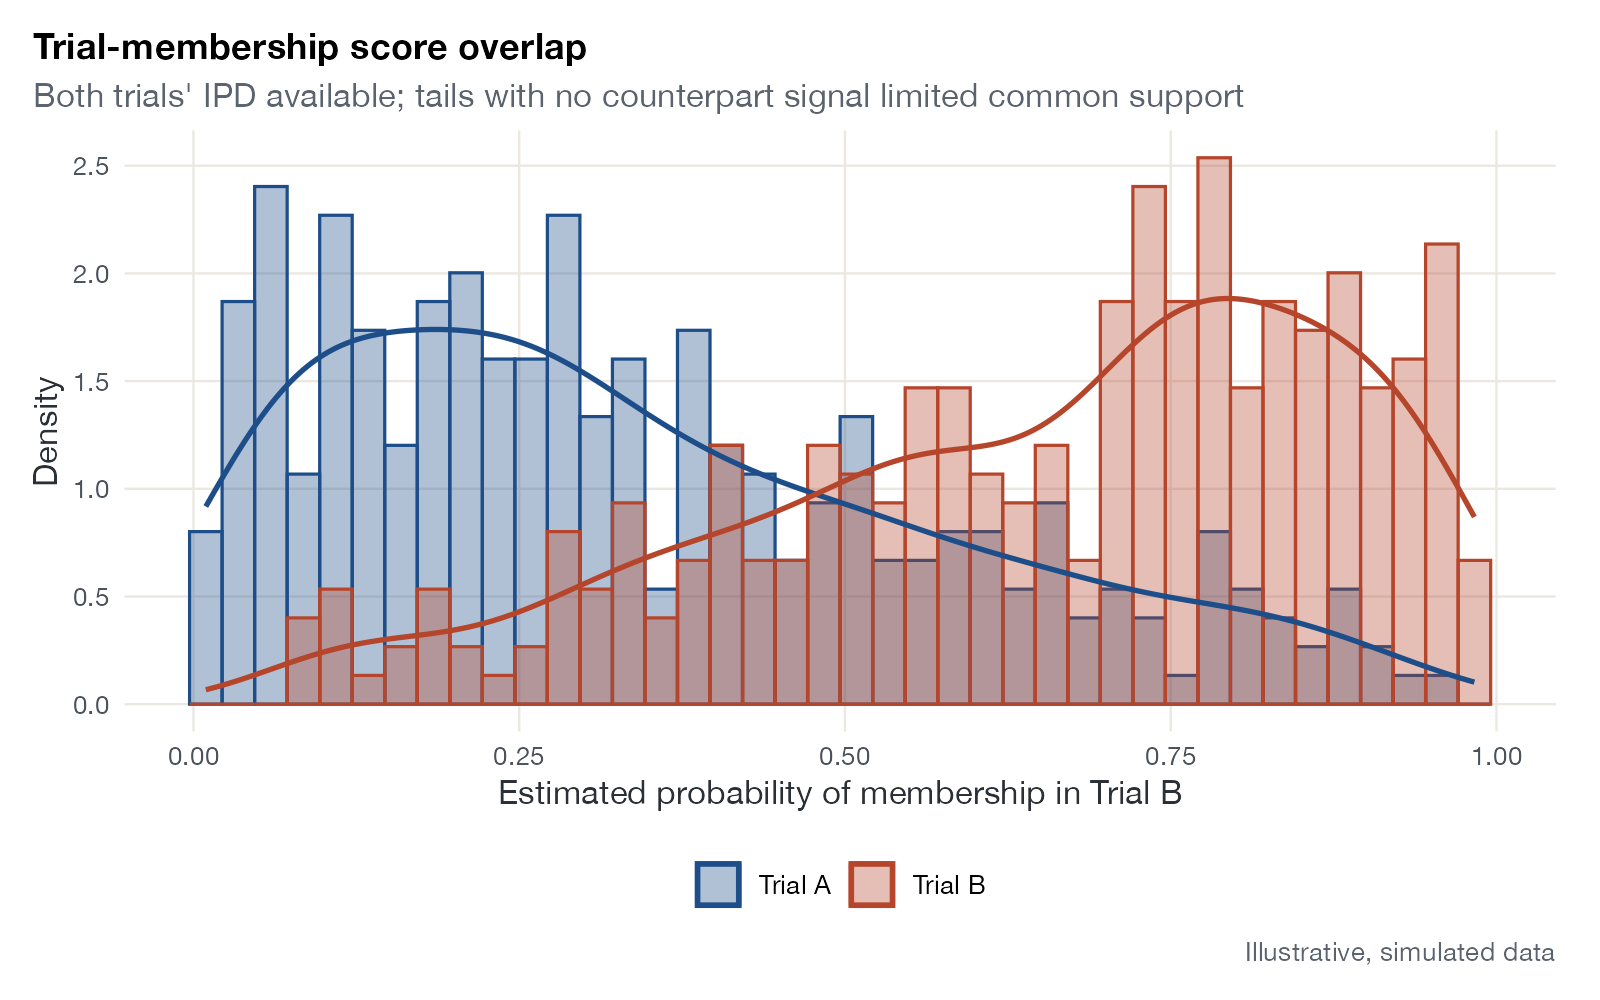
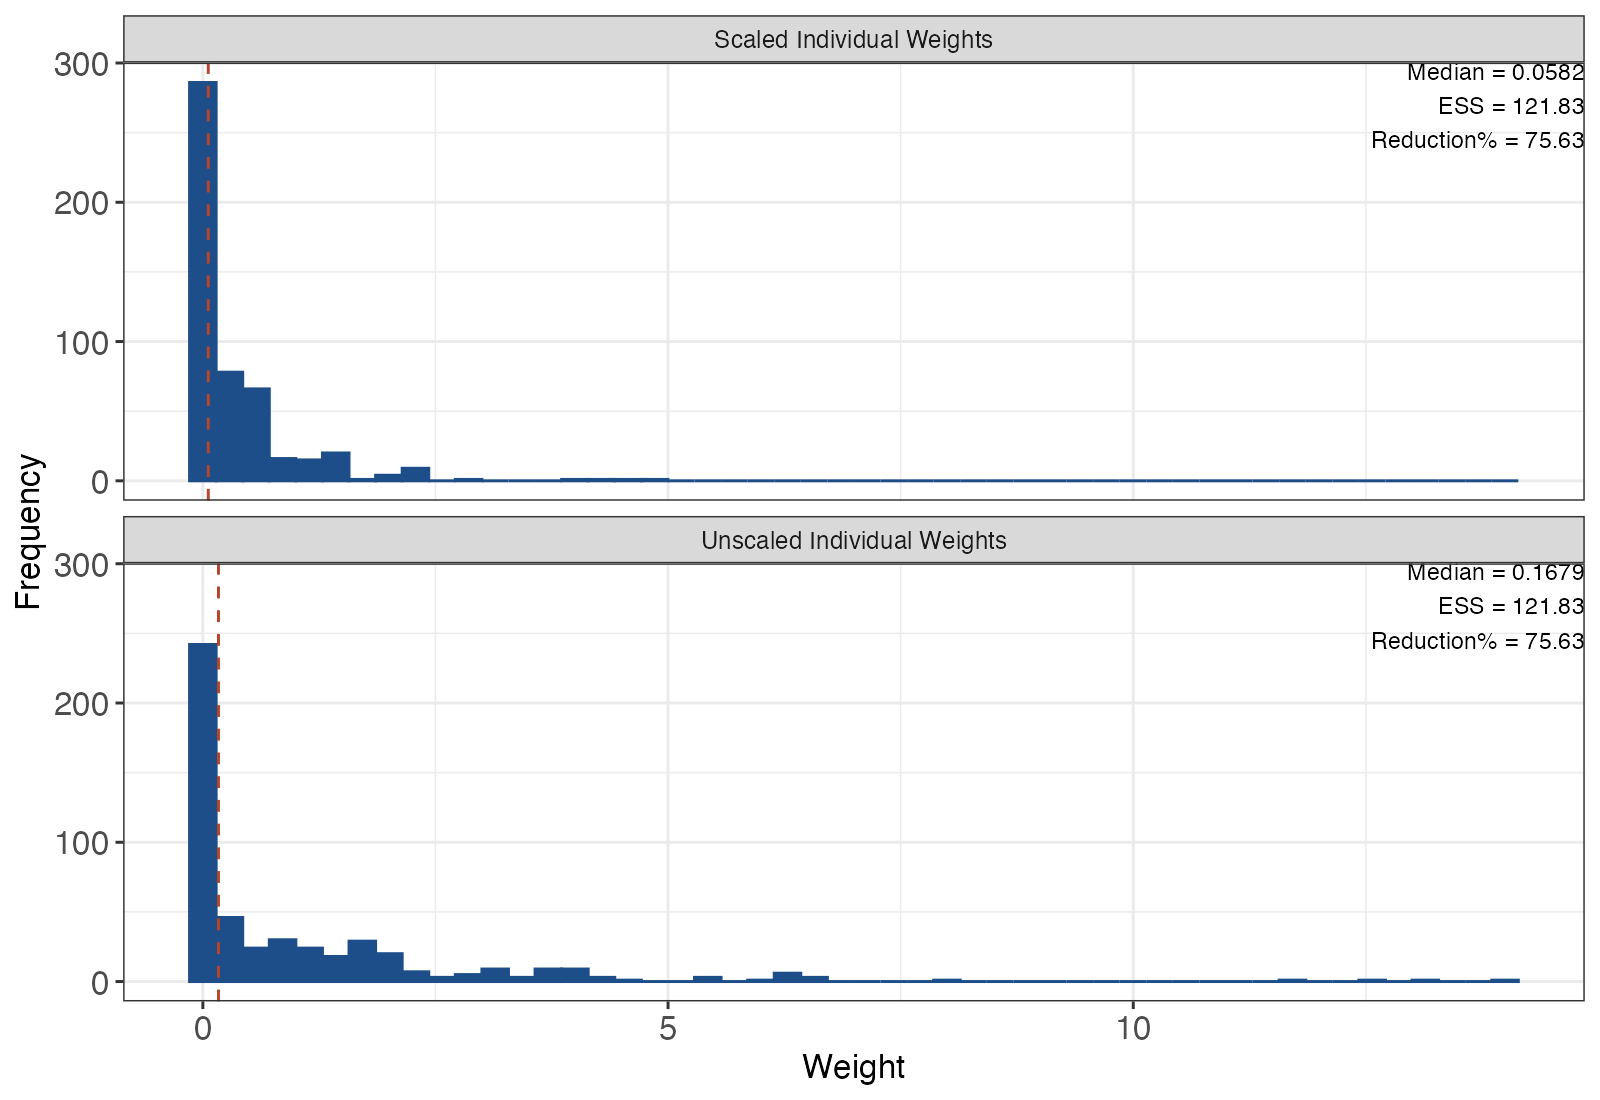
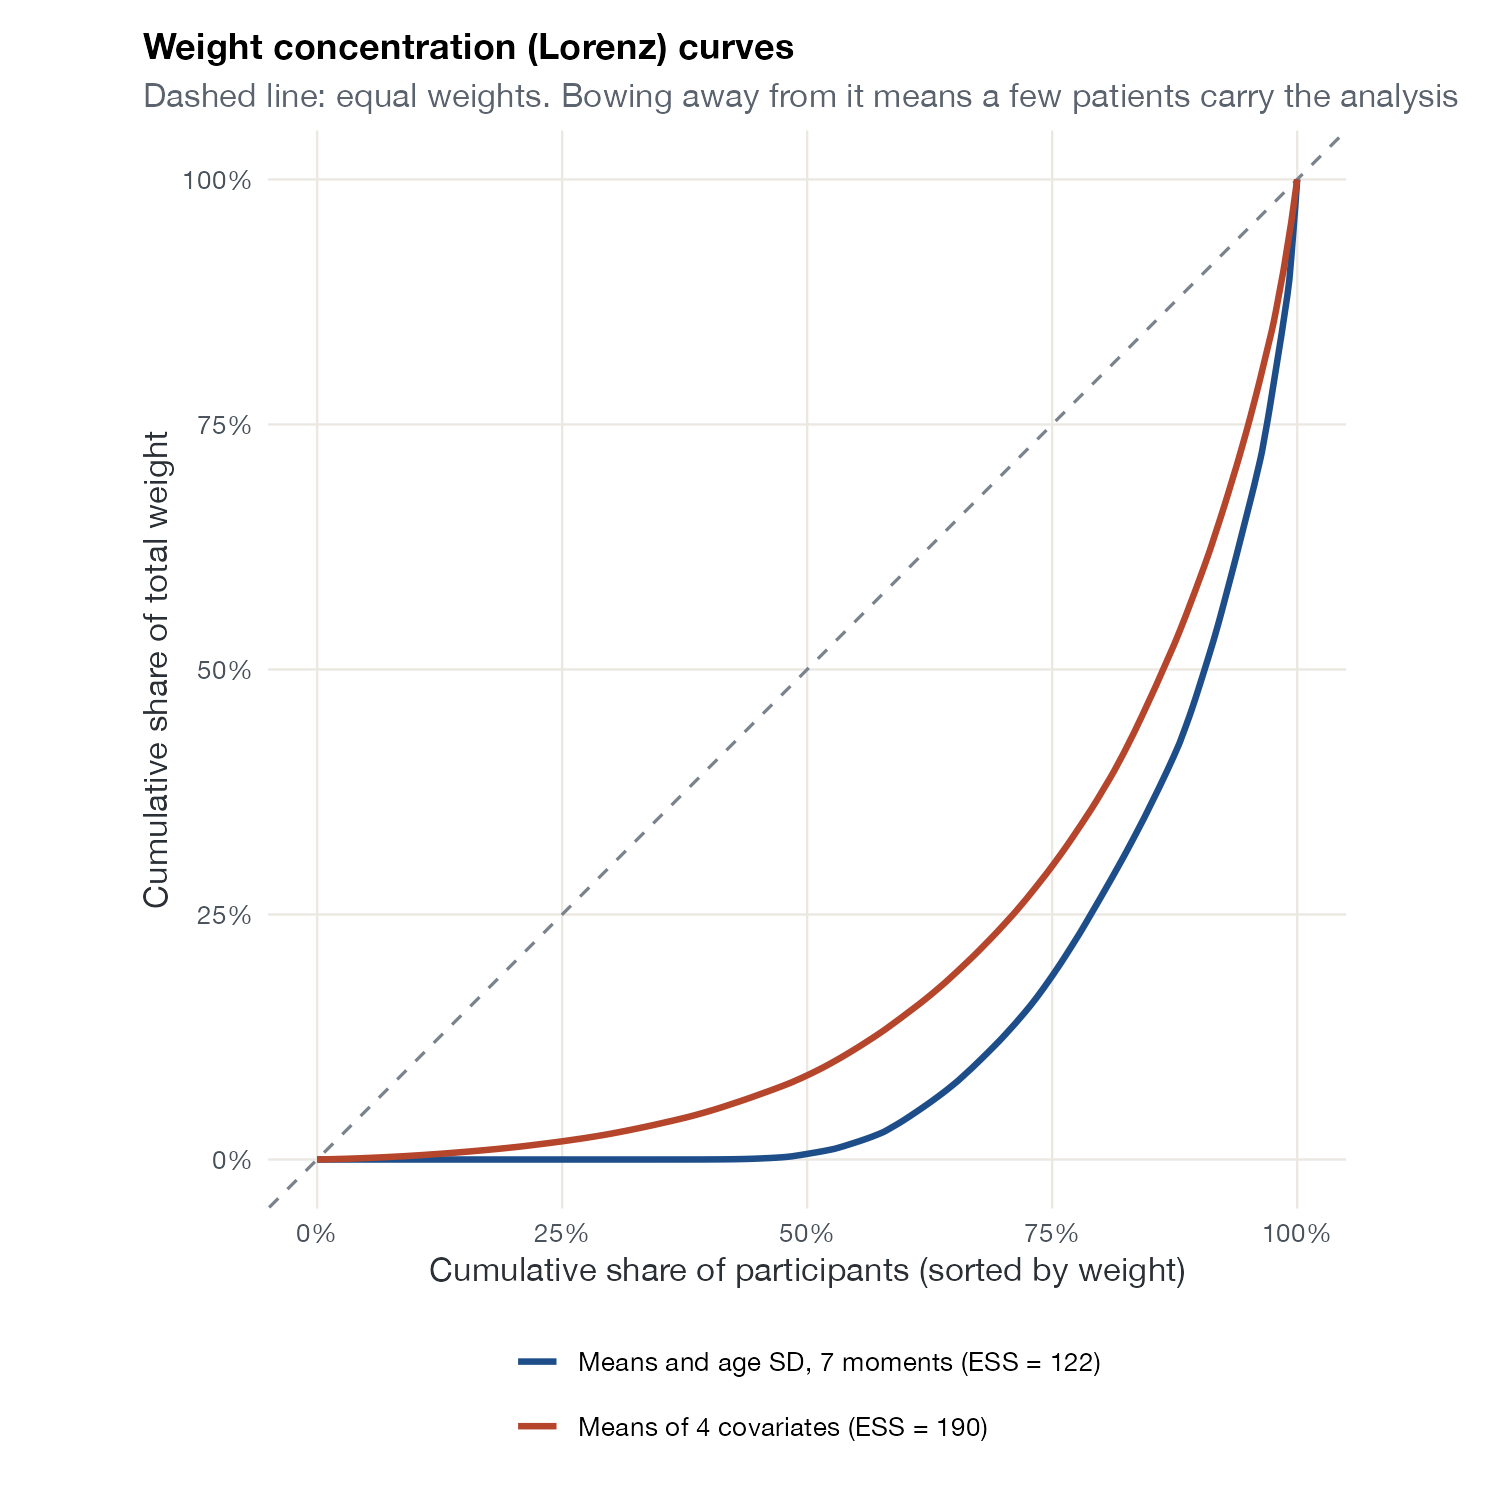
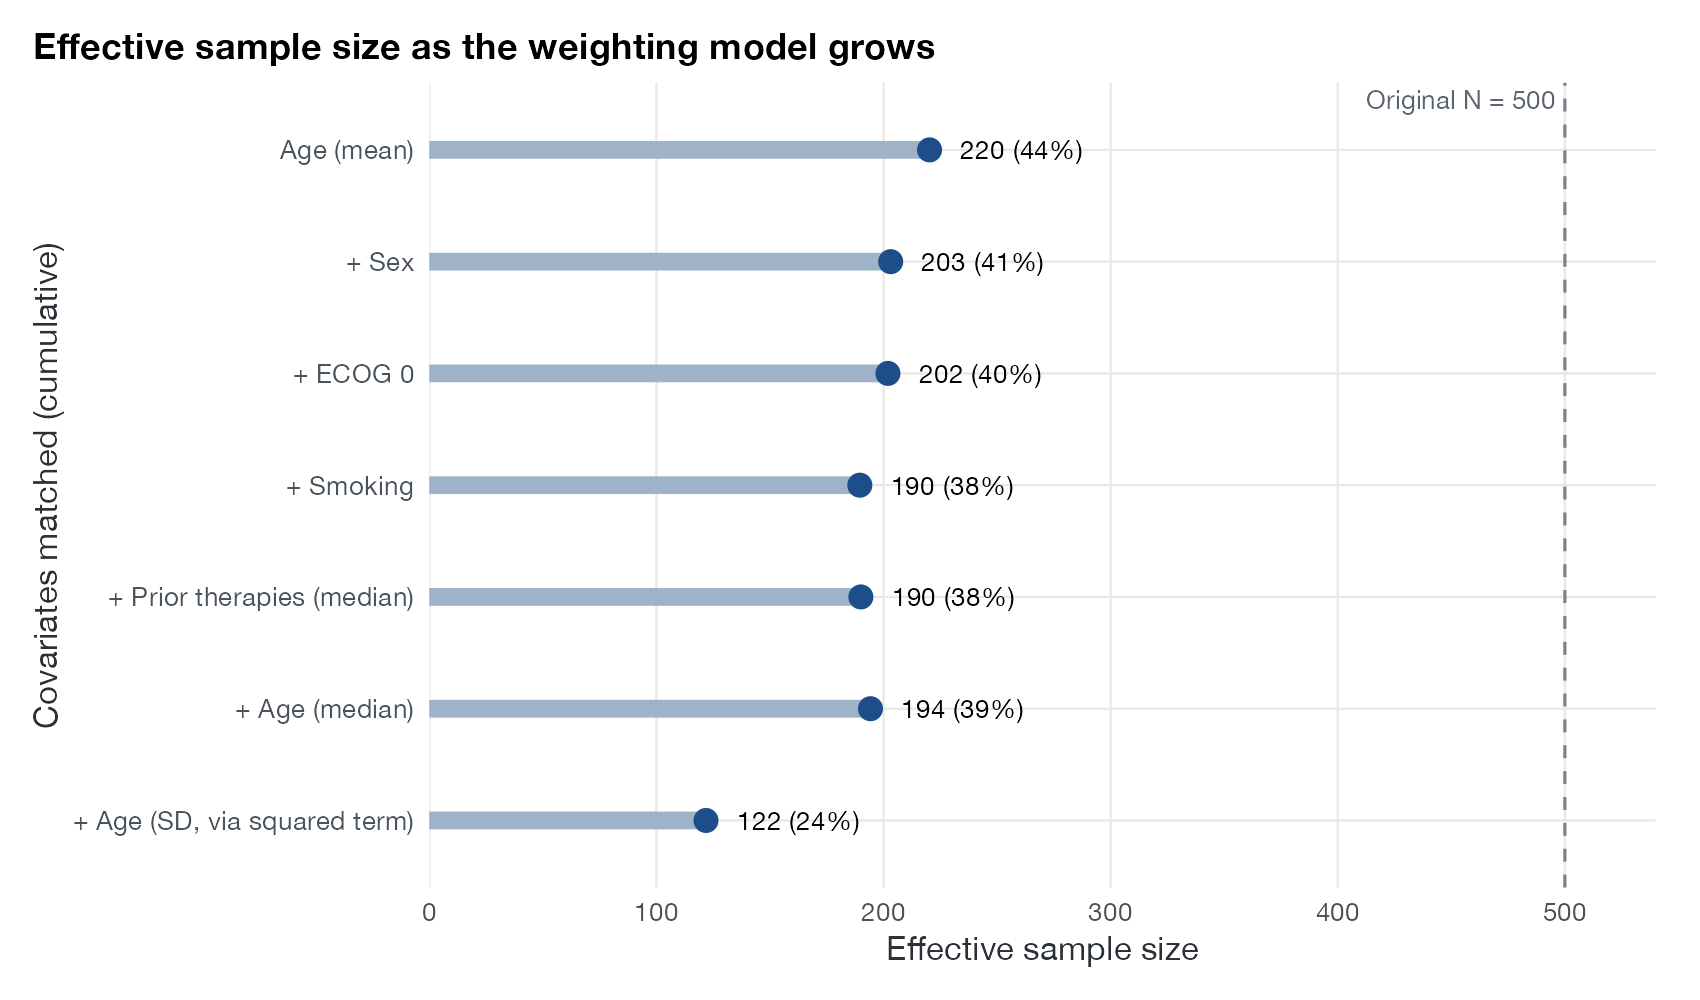
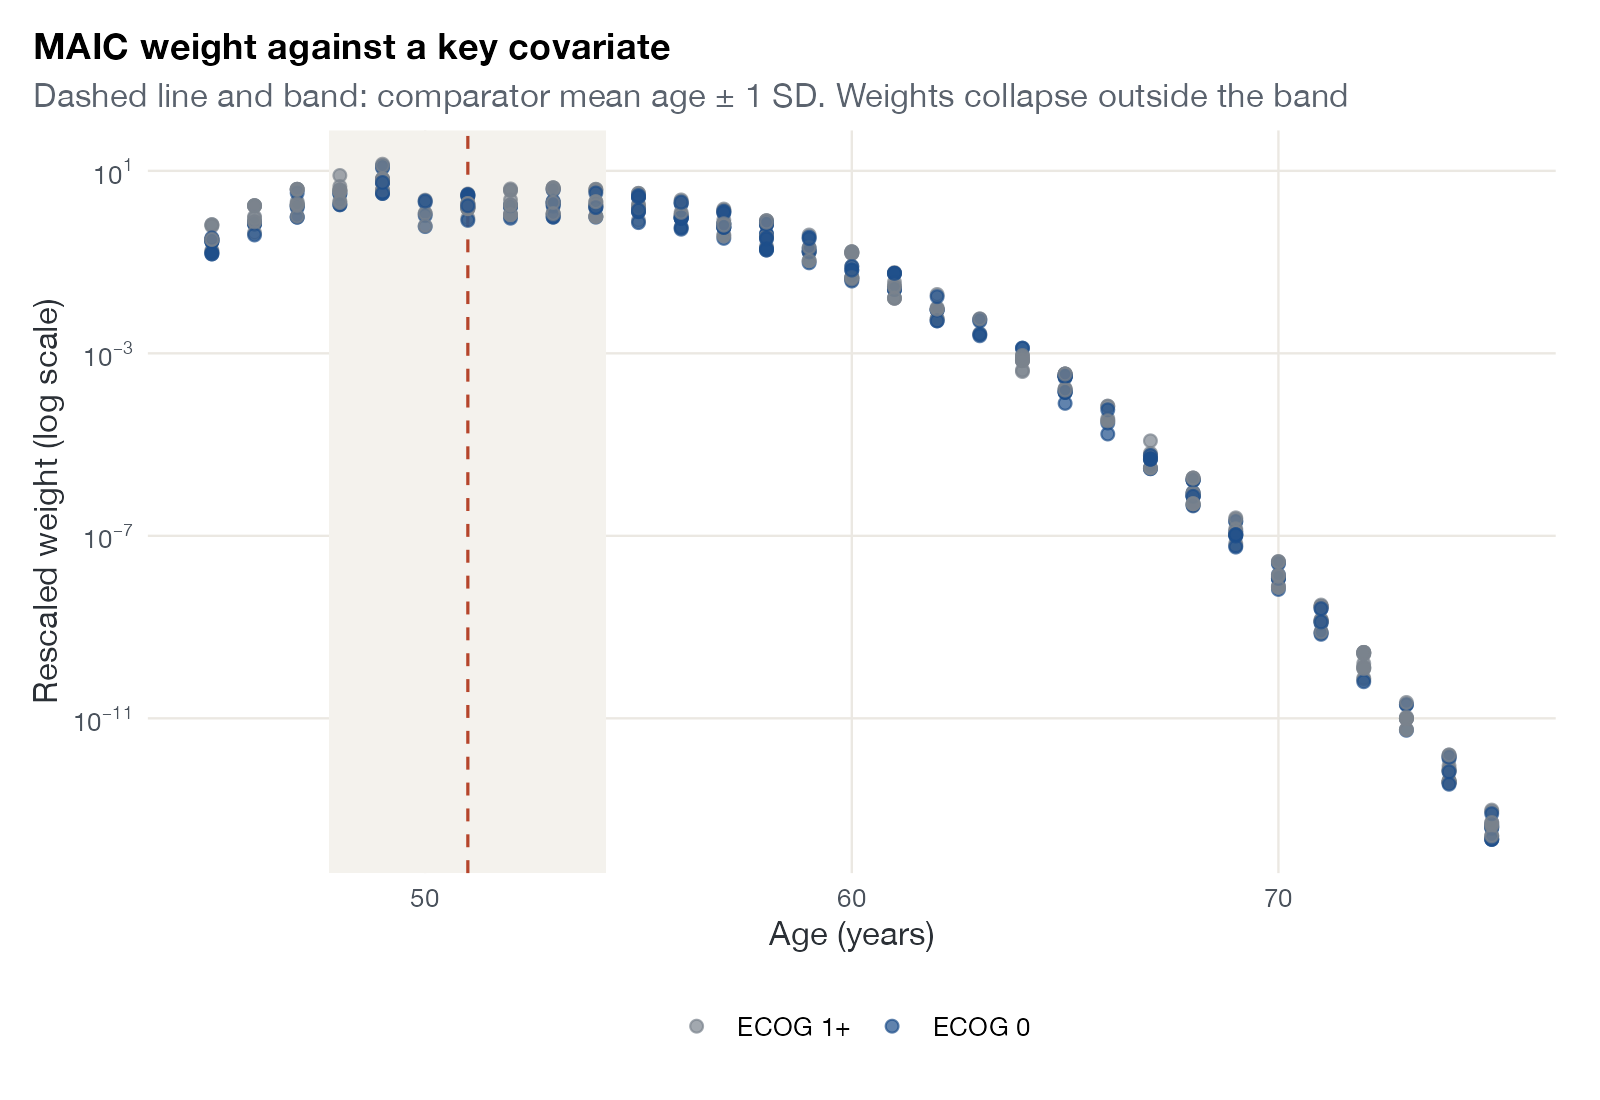
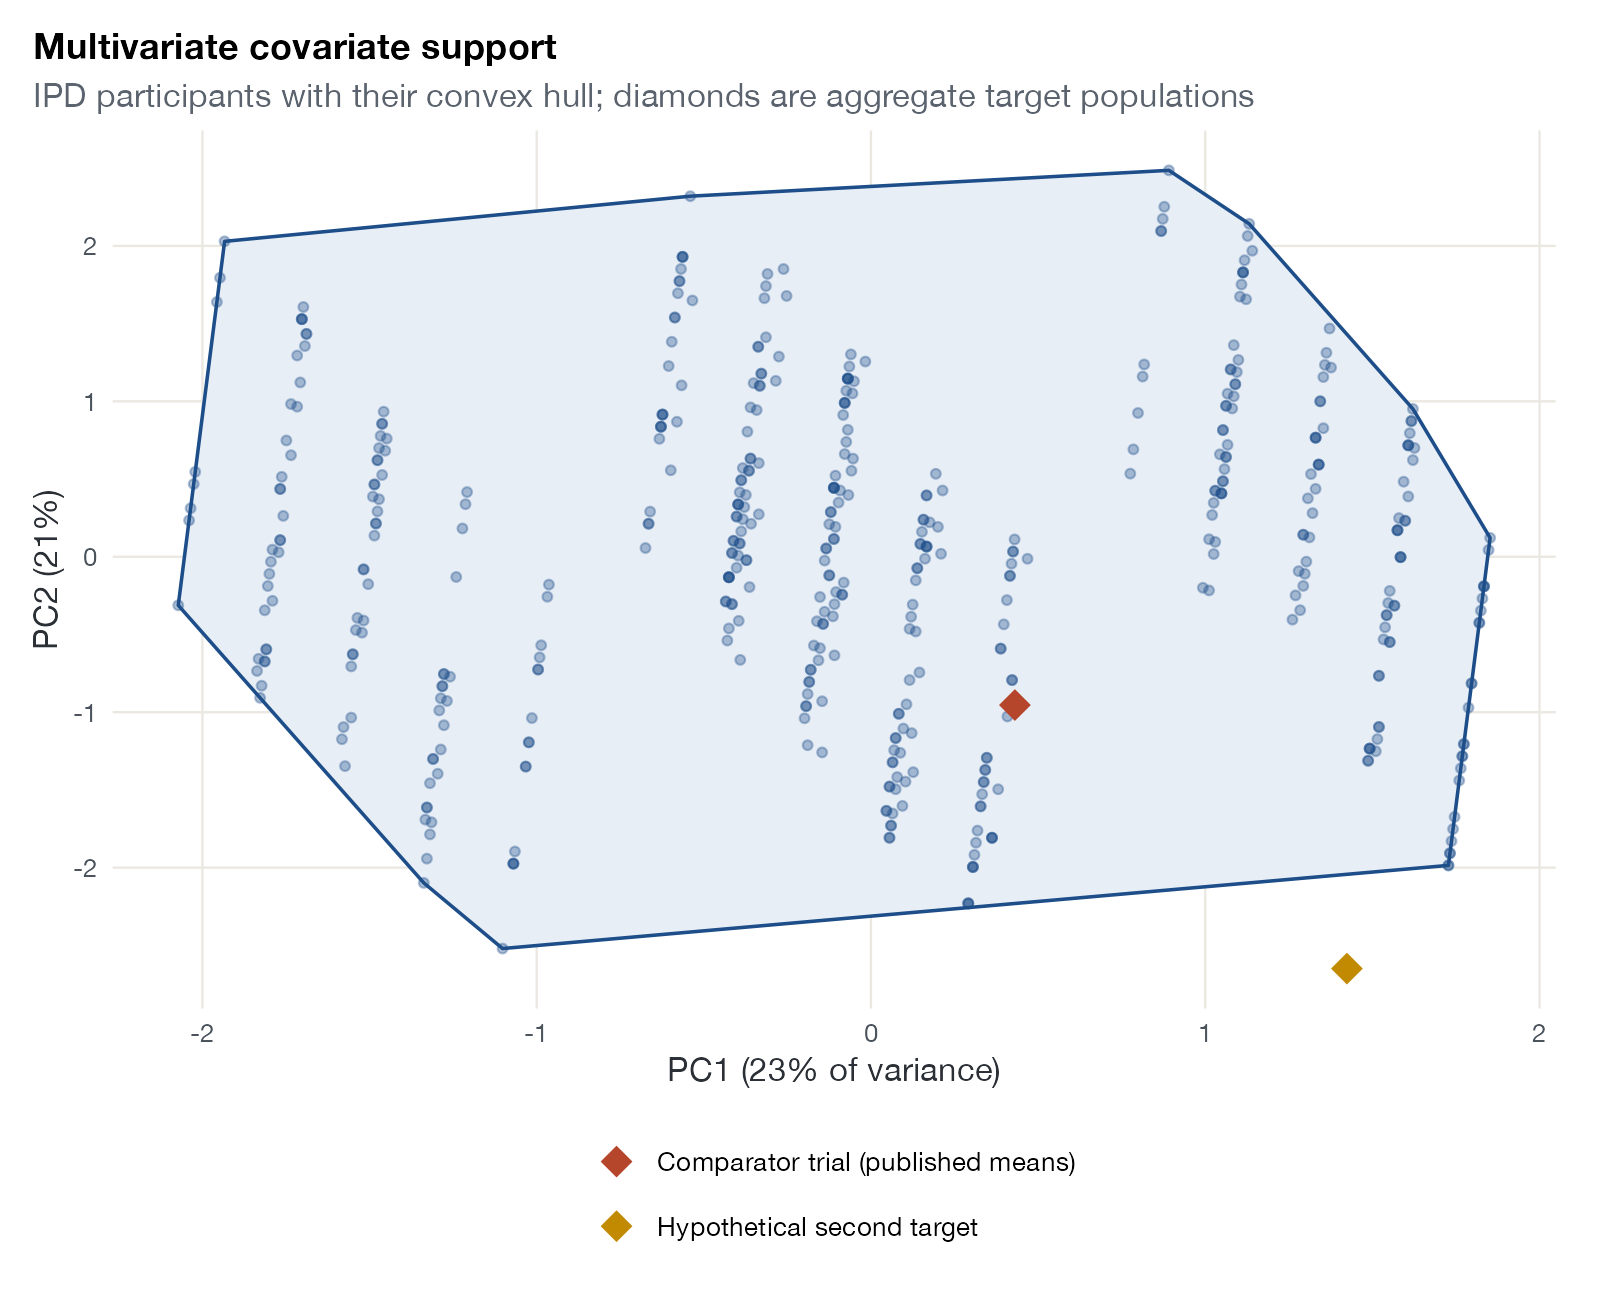
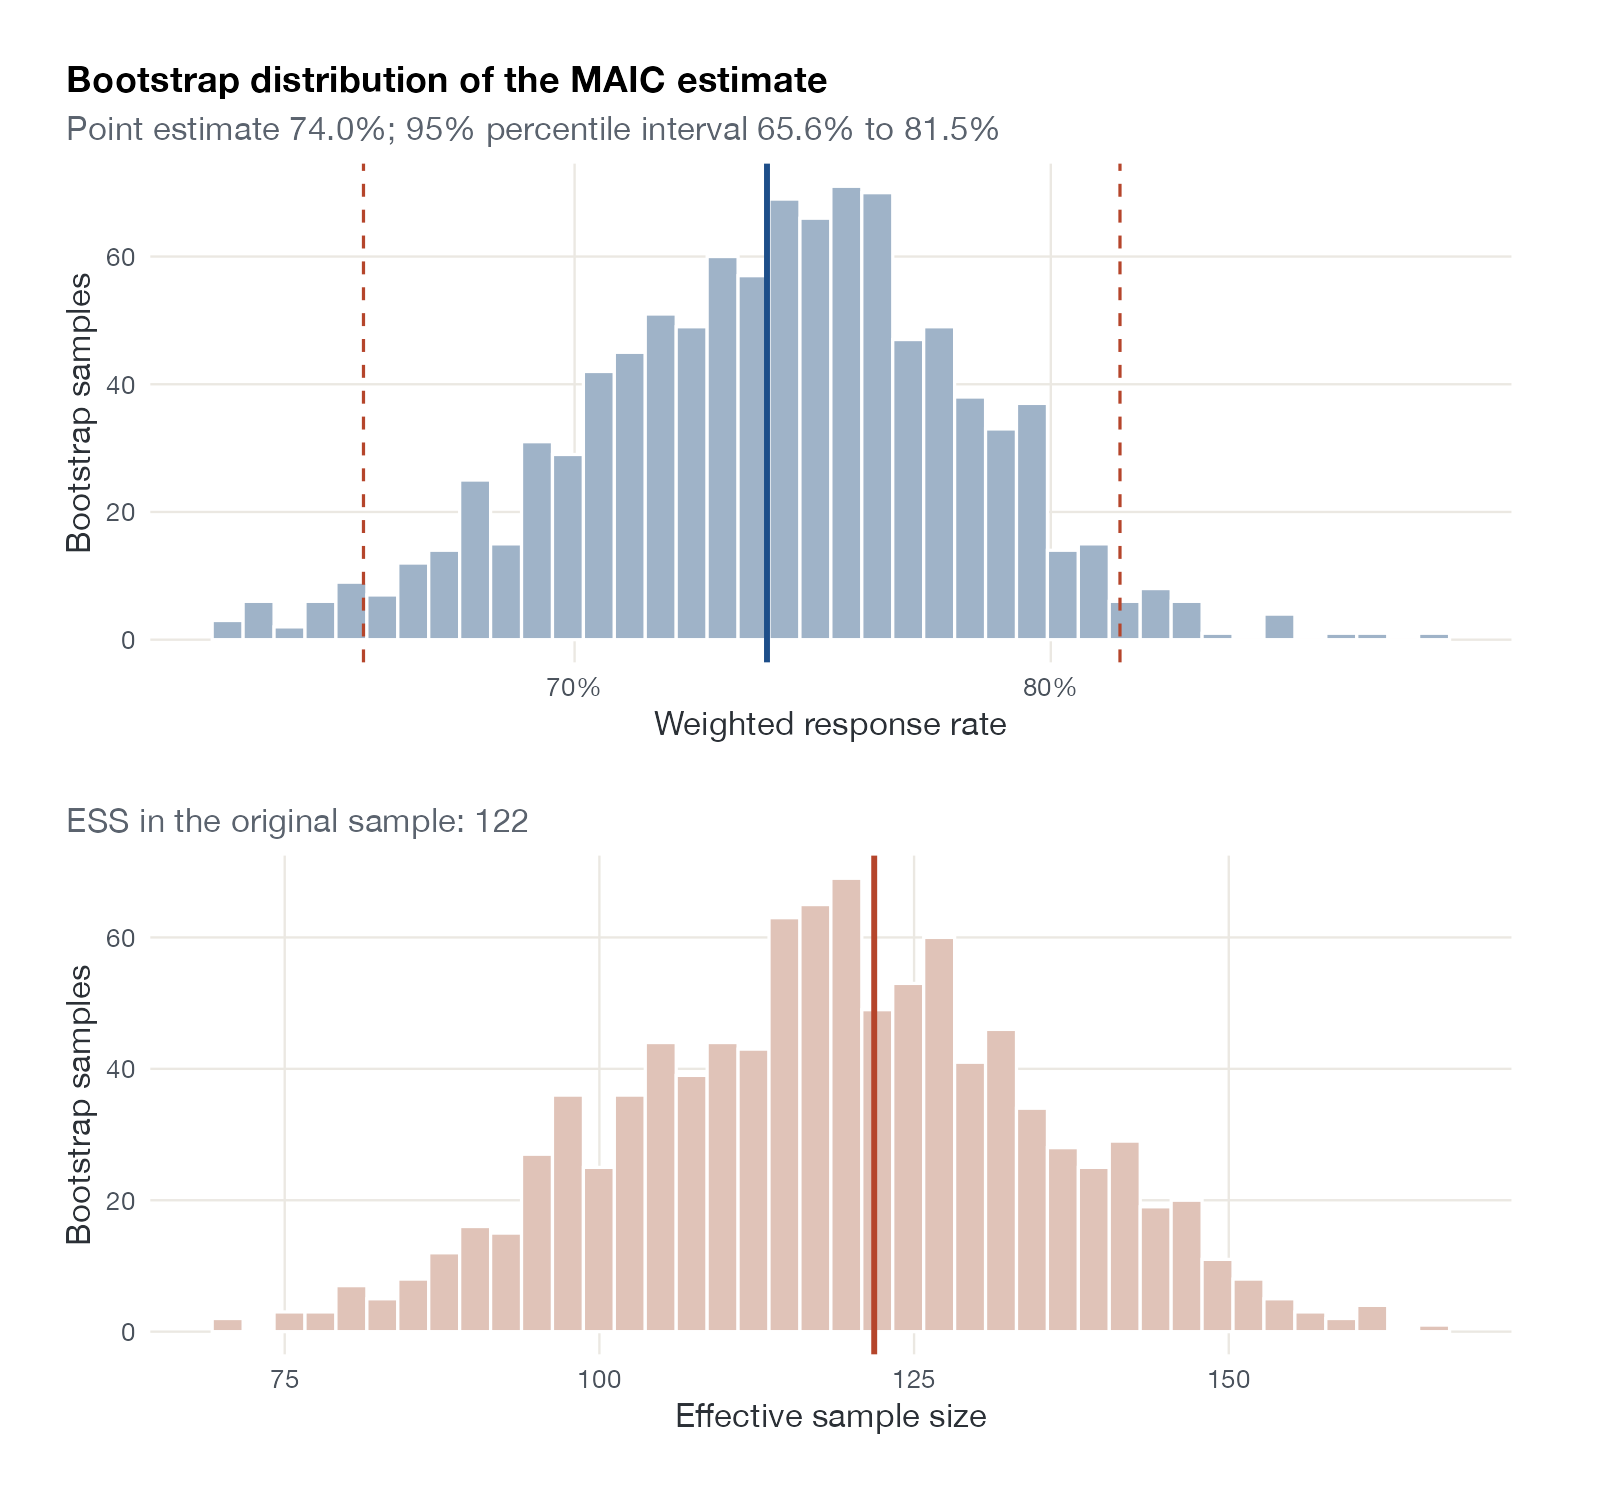
MAIC reweights individual patient data from one trial so that selected covariate moments match those published for a comparator trial, then compares weighted outcomes. Exact matching of the chosen means is a consequence of the weighting algorithm, so a good-looking balance plot proves little. The informative graphics describe the weights: how extreme they are, how much effective sample size survives, and whether the populations overlap.
Minimum graphical set
- Balance before and after weighting: Love plot and weighted covariate distributions.
- The weights: weight histogram and weight concentration curve.
- The effective sample size plot.
- Covariate support: multivariate support plot or weight versus covariate plot.
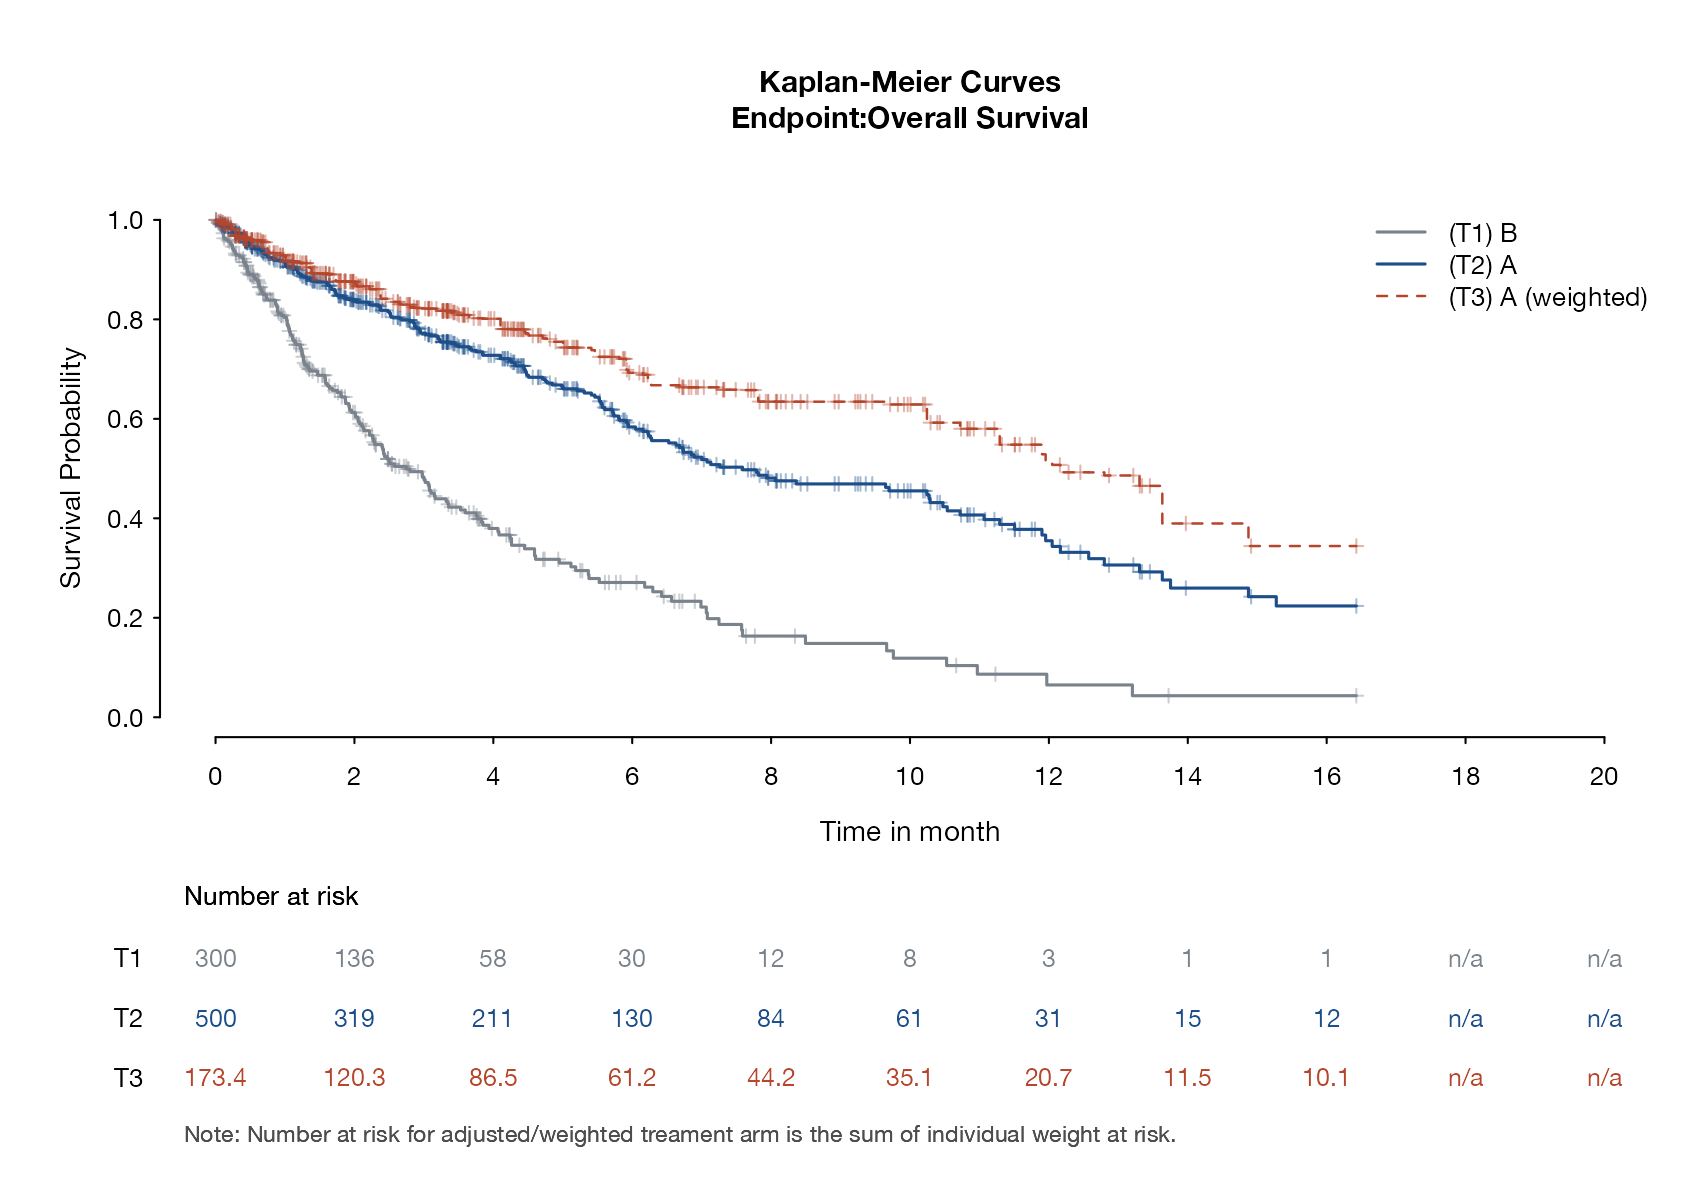
- The adjusted effect, and for survival outcomes a weighted Kaplan-Meier plot.
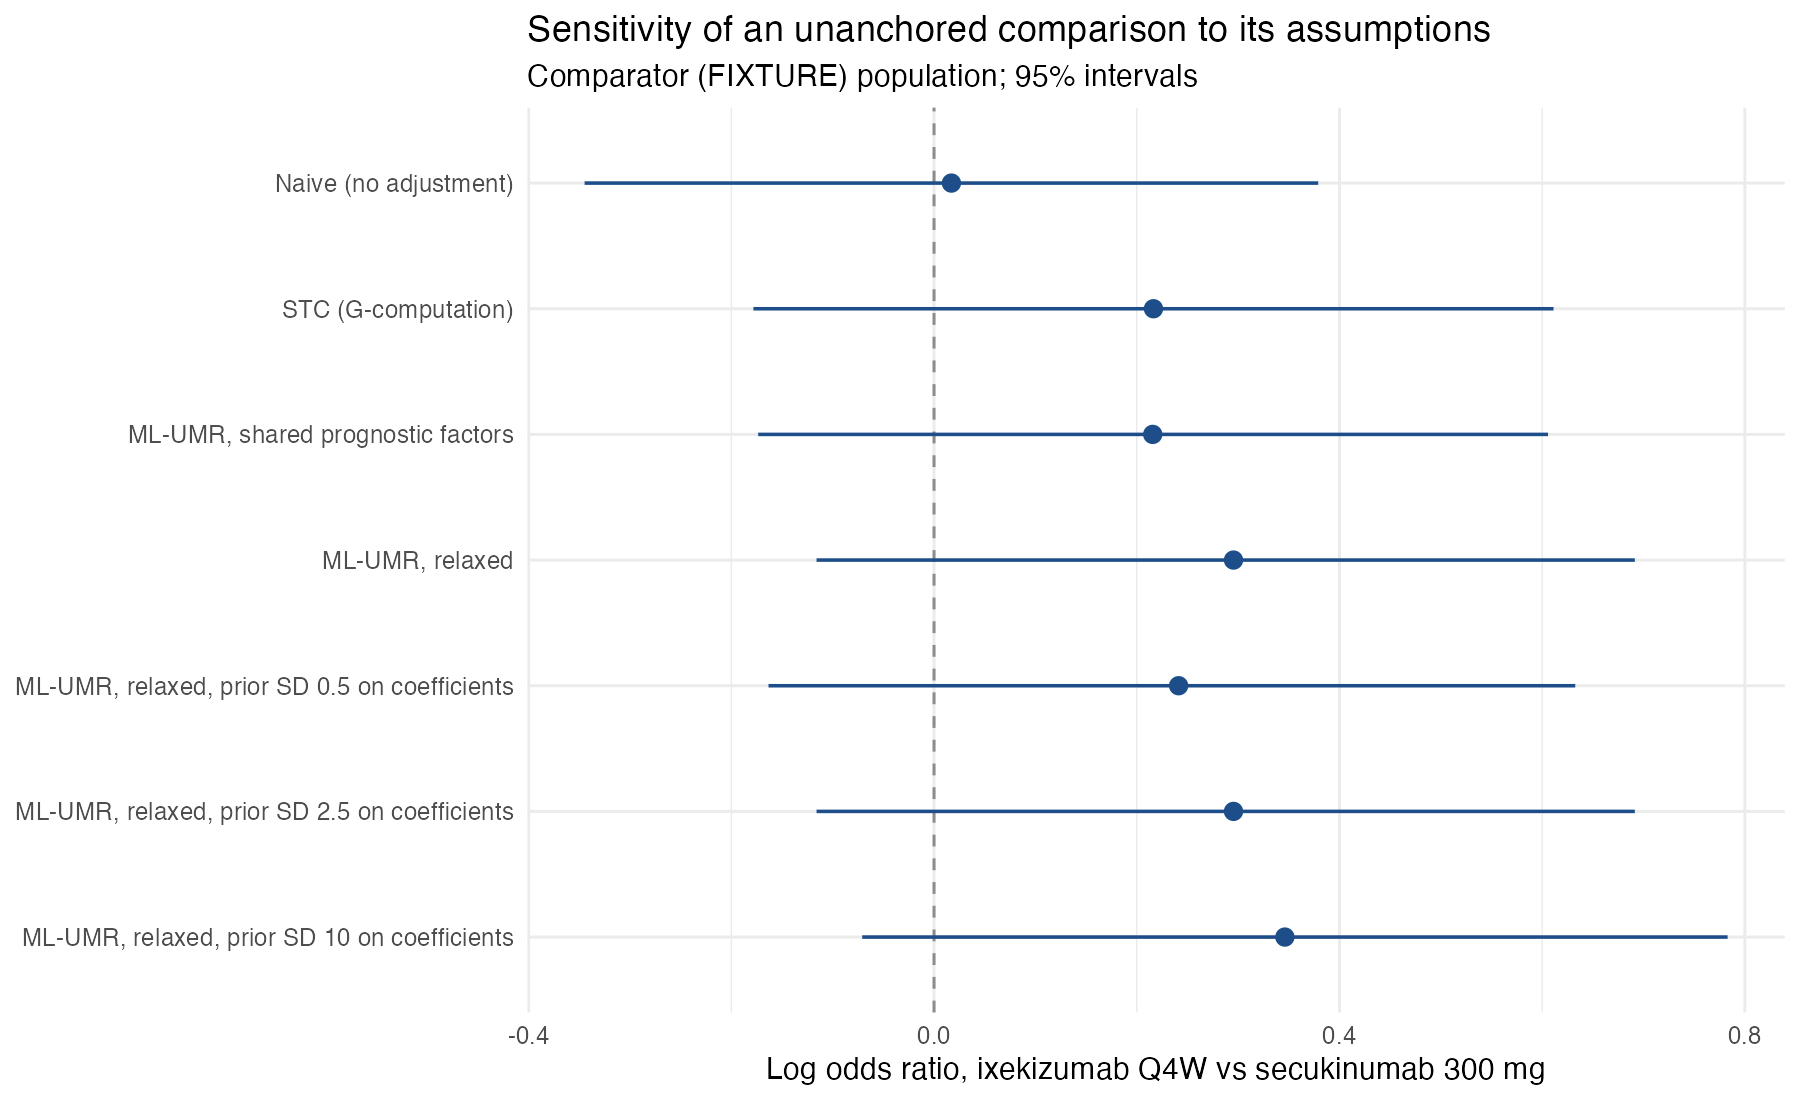
- For unanchored MAIC, an assumption sensitivity plot.
All plots for MAIC
Effect display
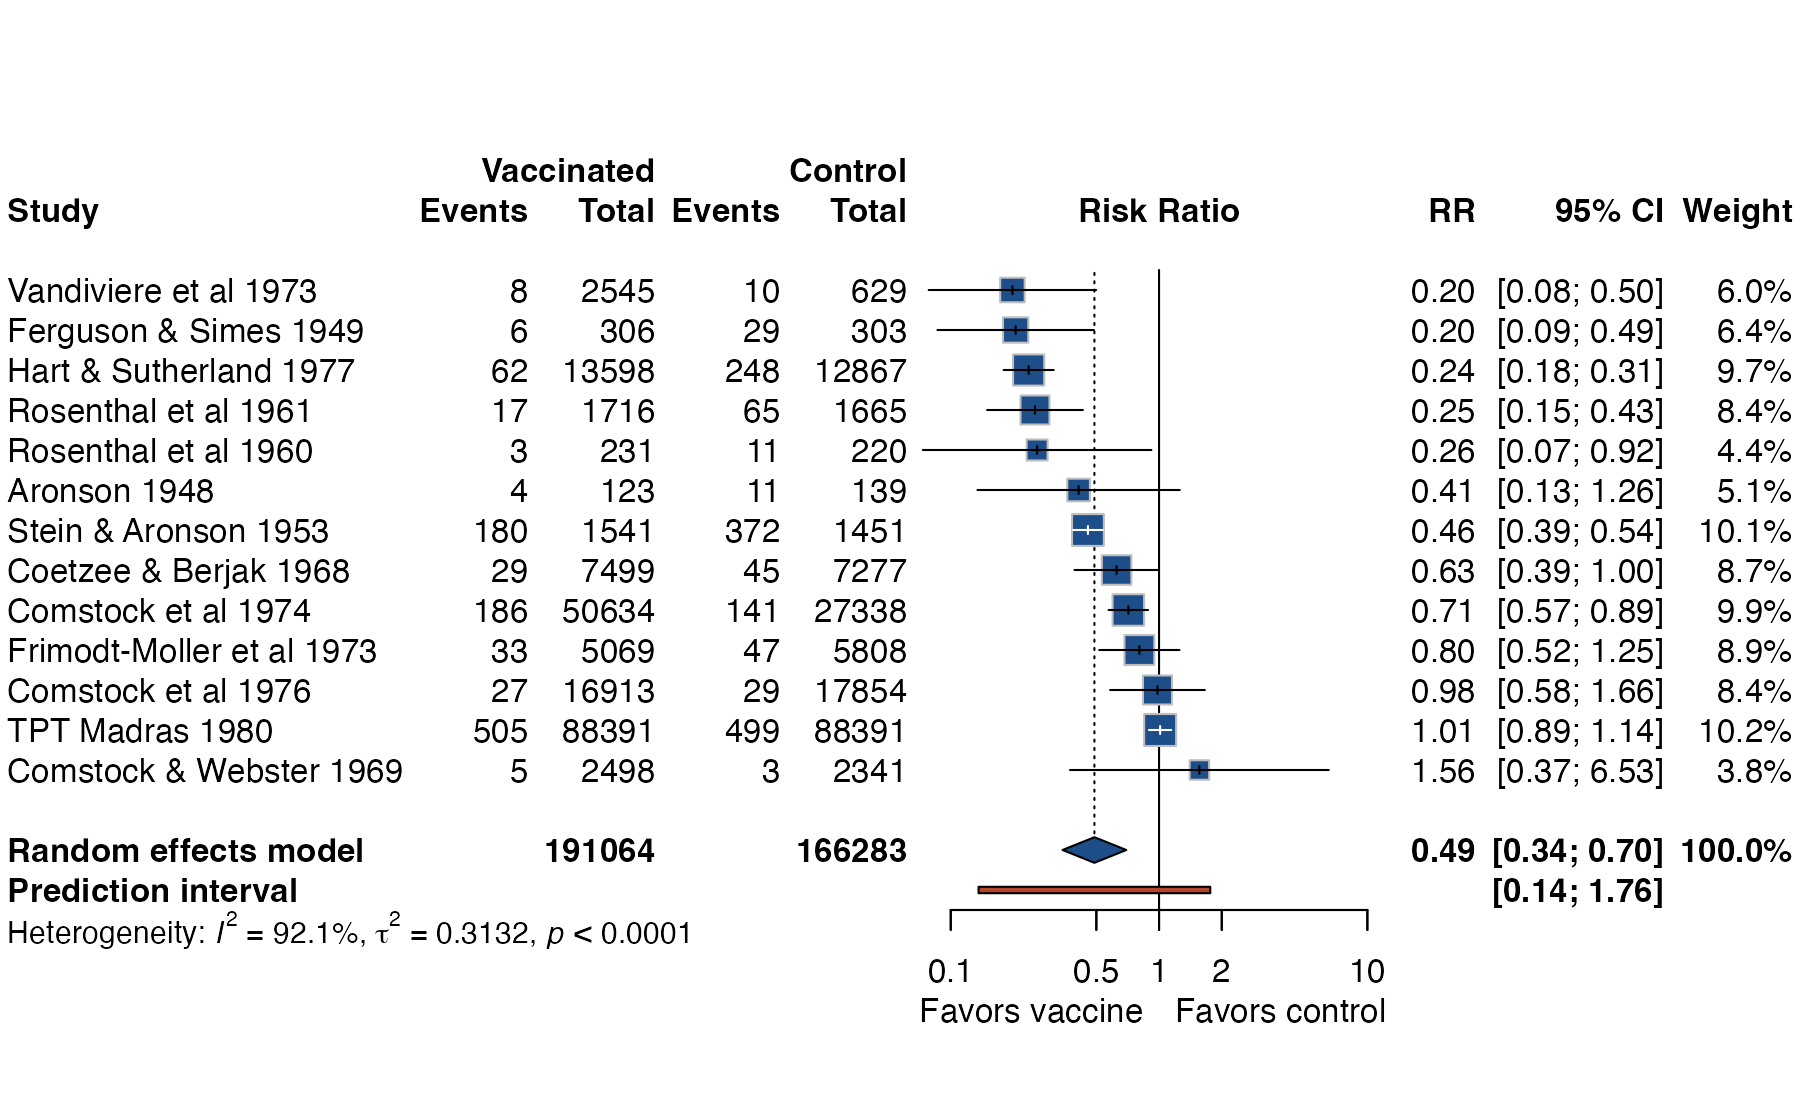
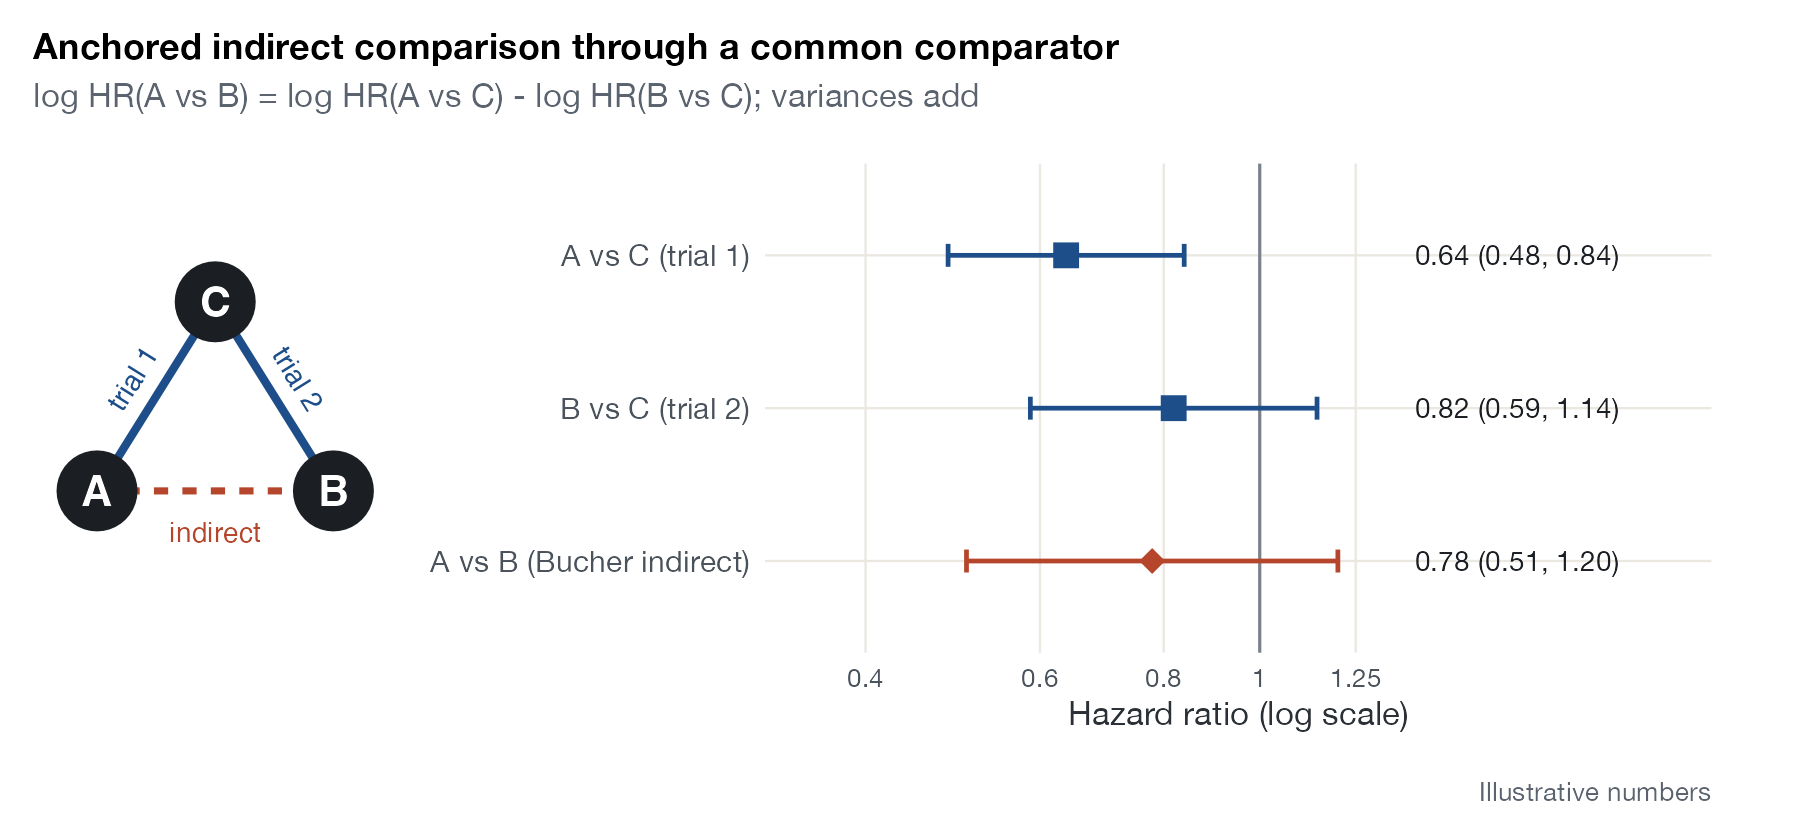
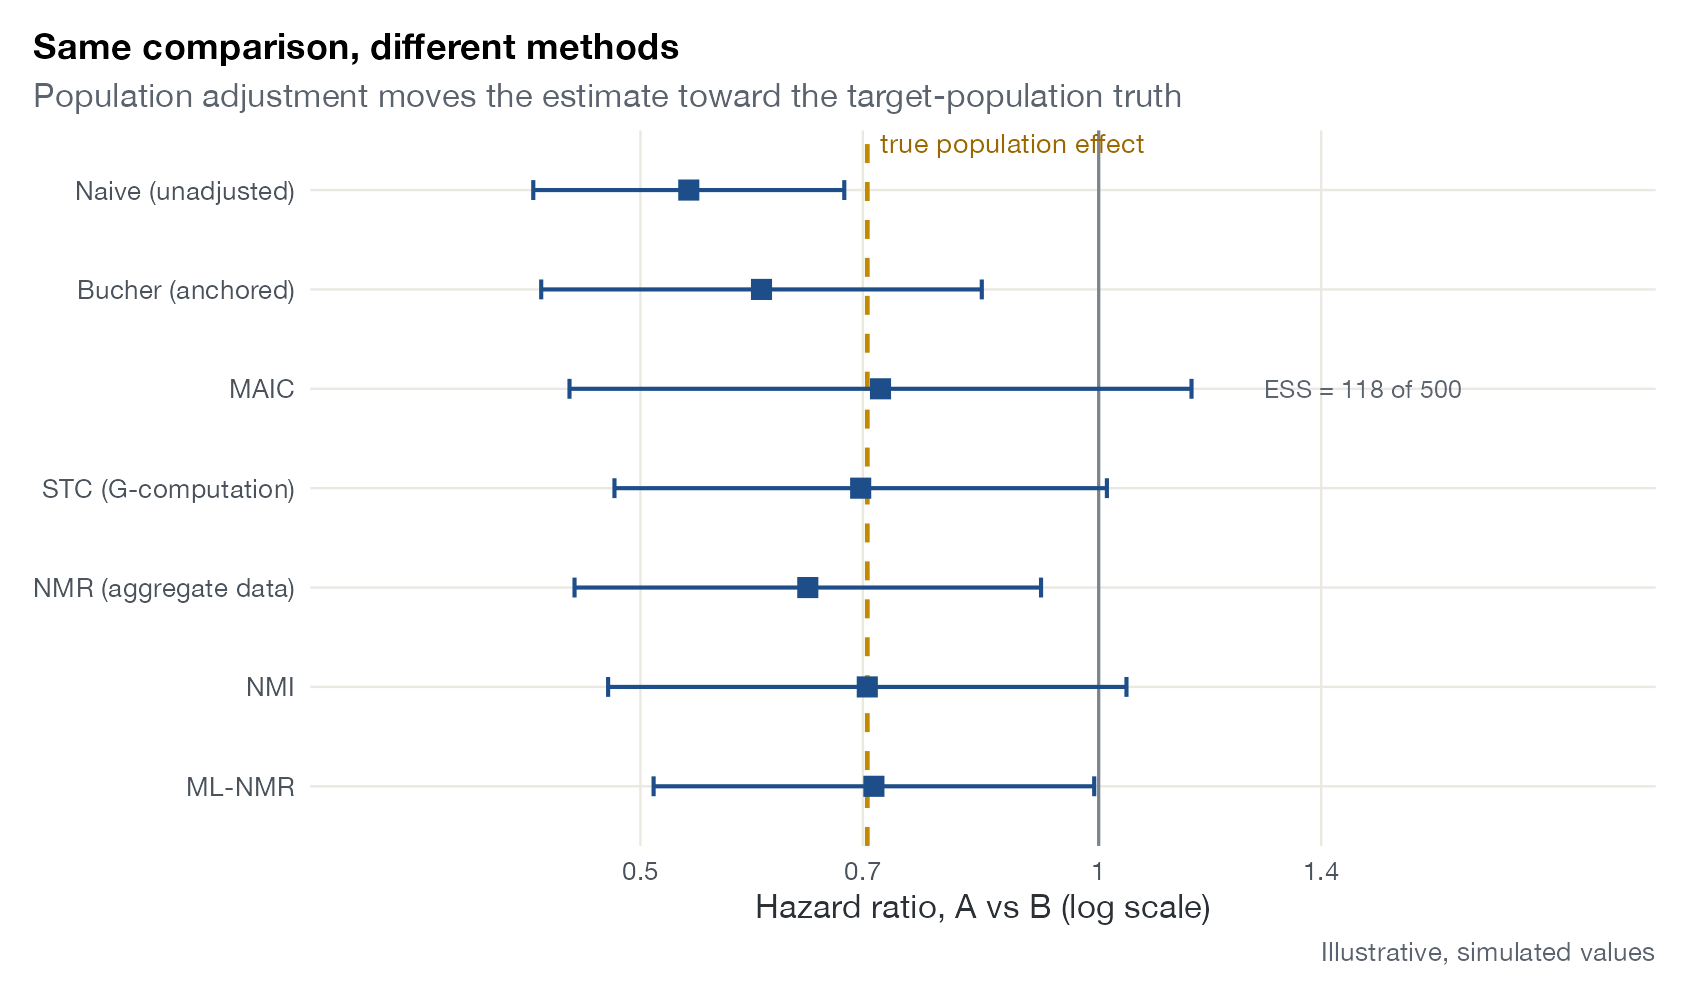
Estimates, intervals, and pooled summaries: the forest plot and its many descendants.
Weighting, balance, and overlap
MAIC diagnostics: what the weights did, how much information survived, and whether populations overlap.
Outcome regression and transportability
STC and G-computation diagnostics: functional form, extrapolation, and effects in a target population.
Unanchored multilevel meta-regression
ML-UMR graphics for disconnected evidence, where prognostic modeling carries the whole comparison.
Survival and time-to-event
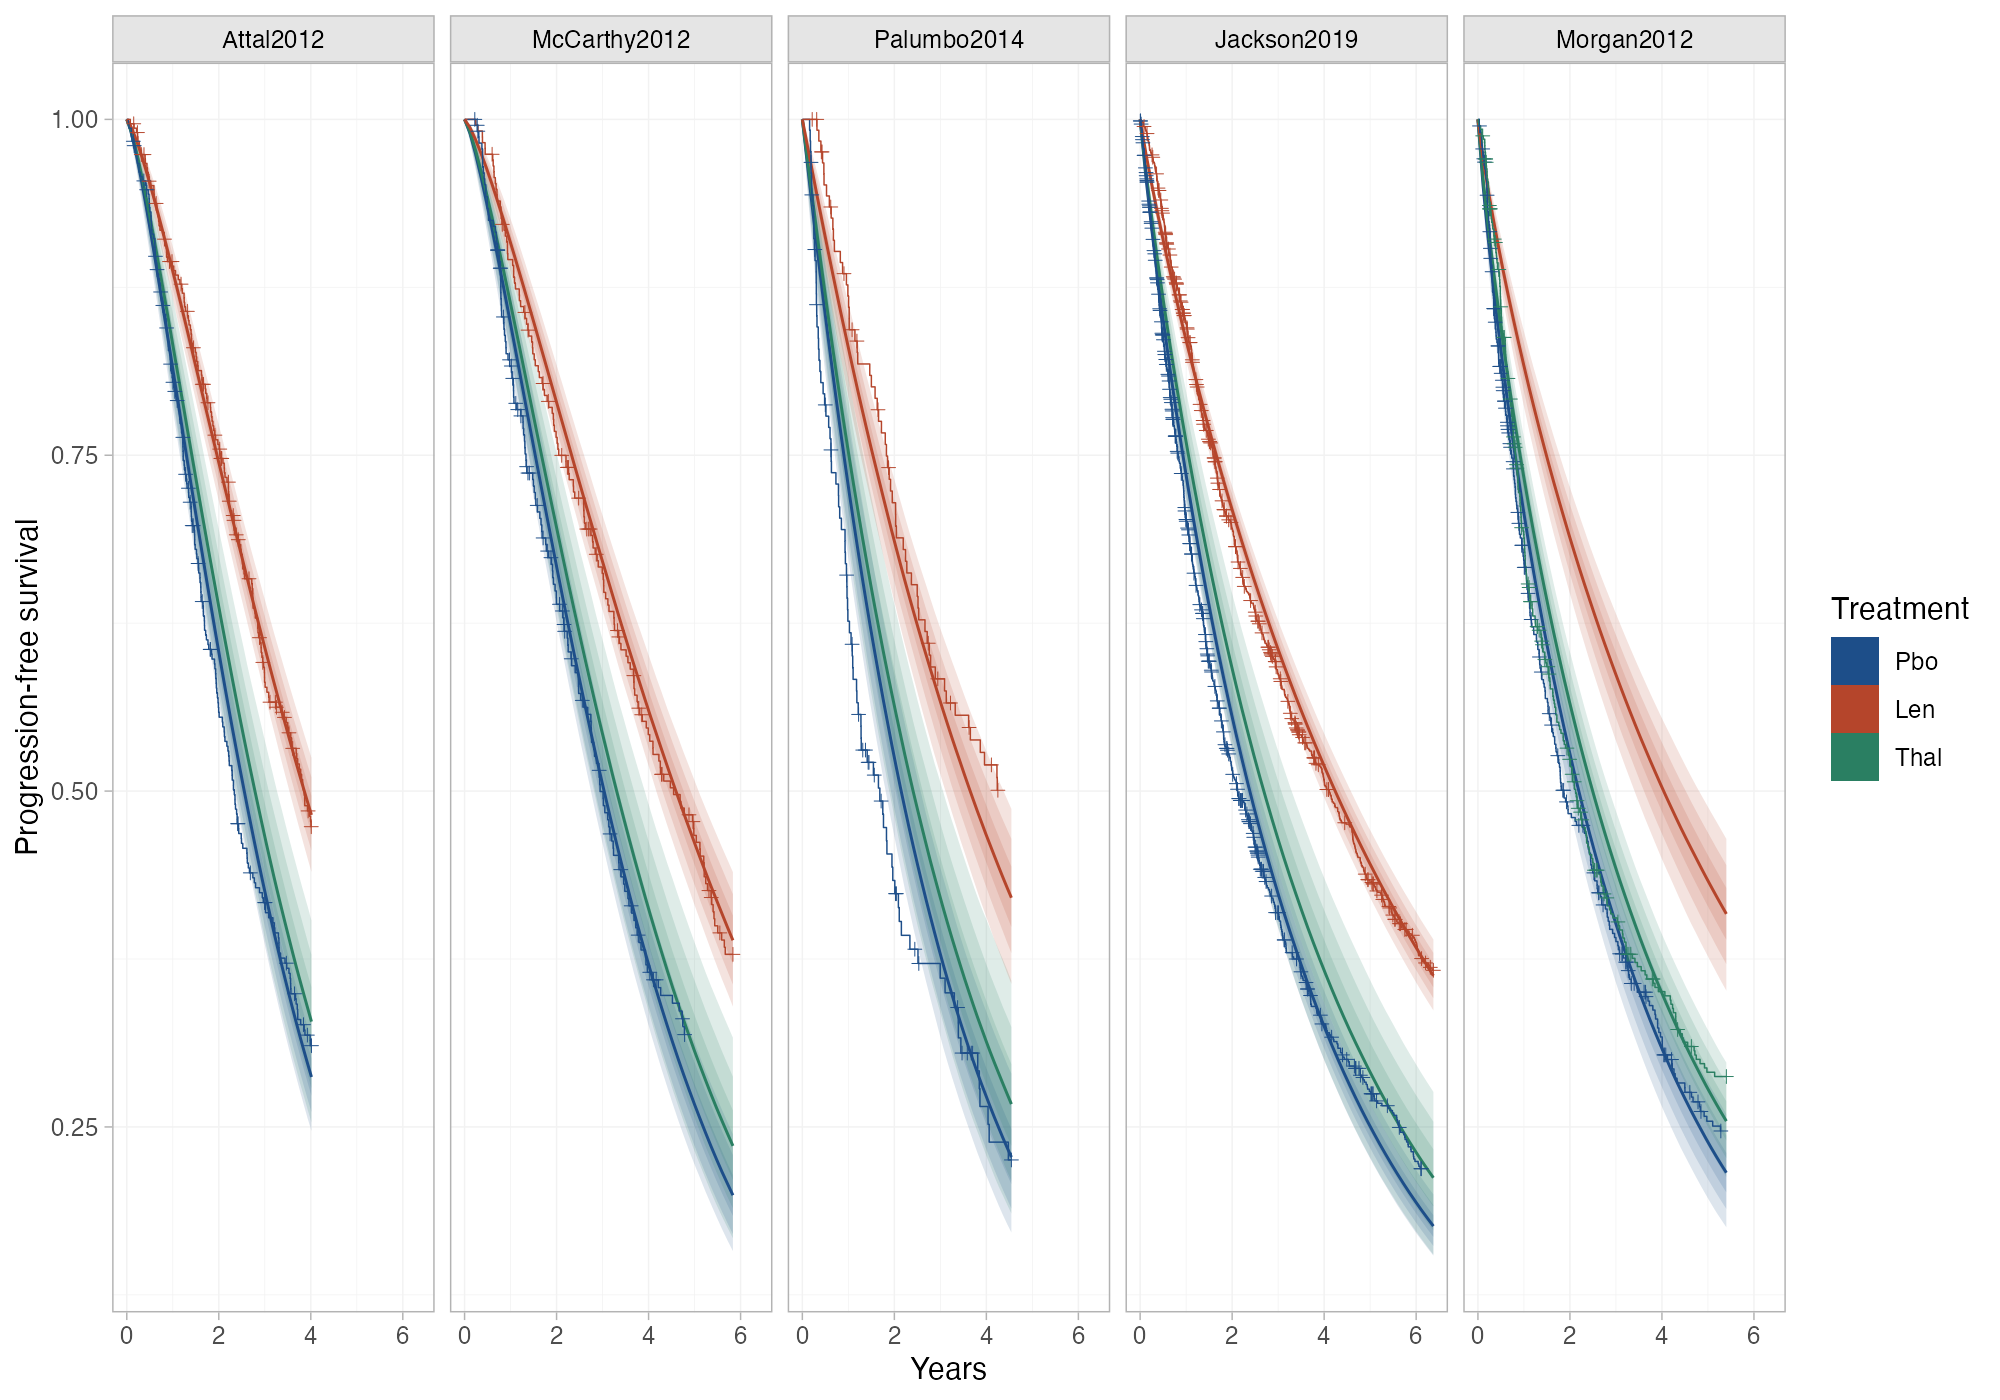
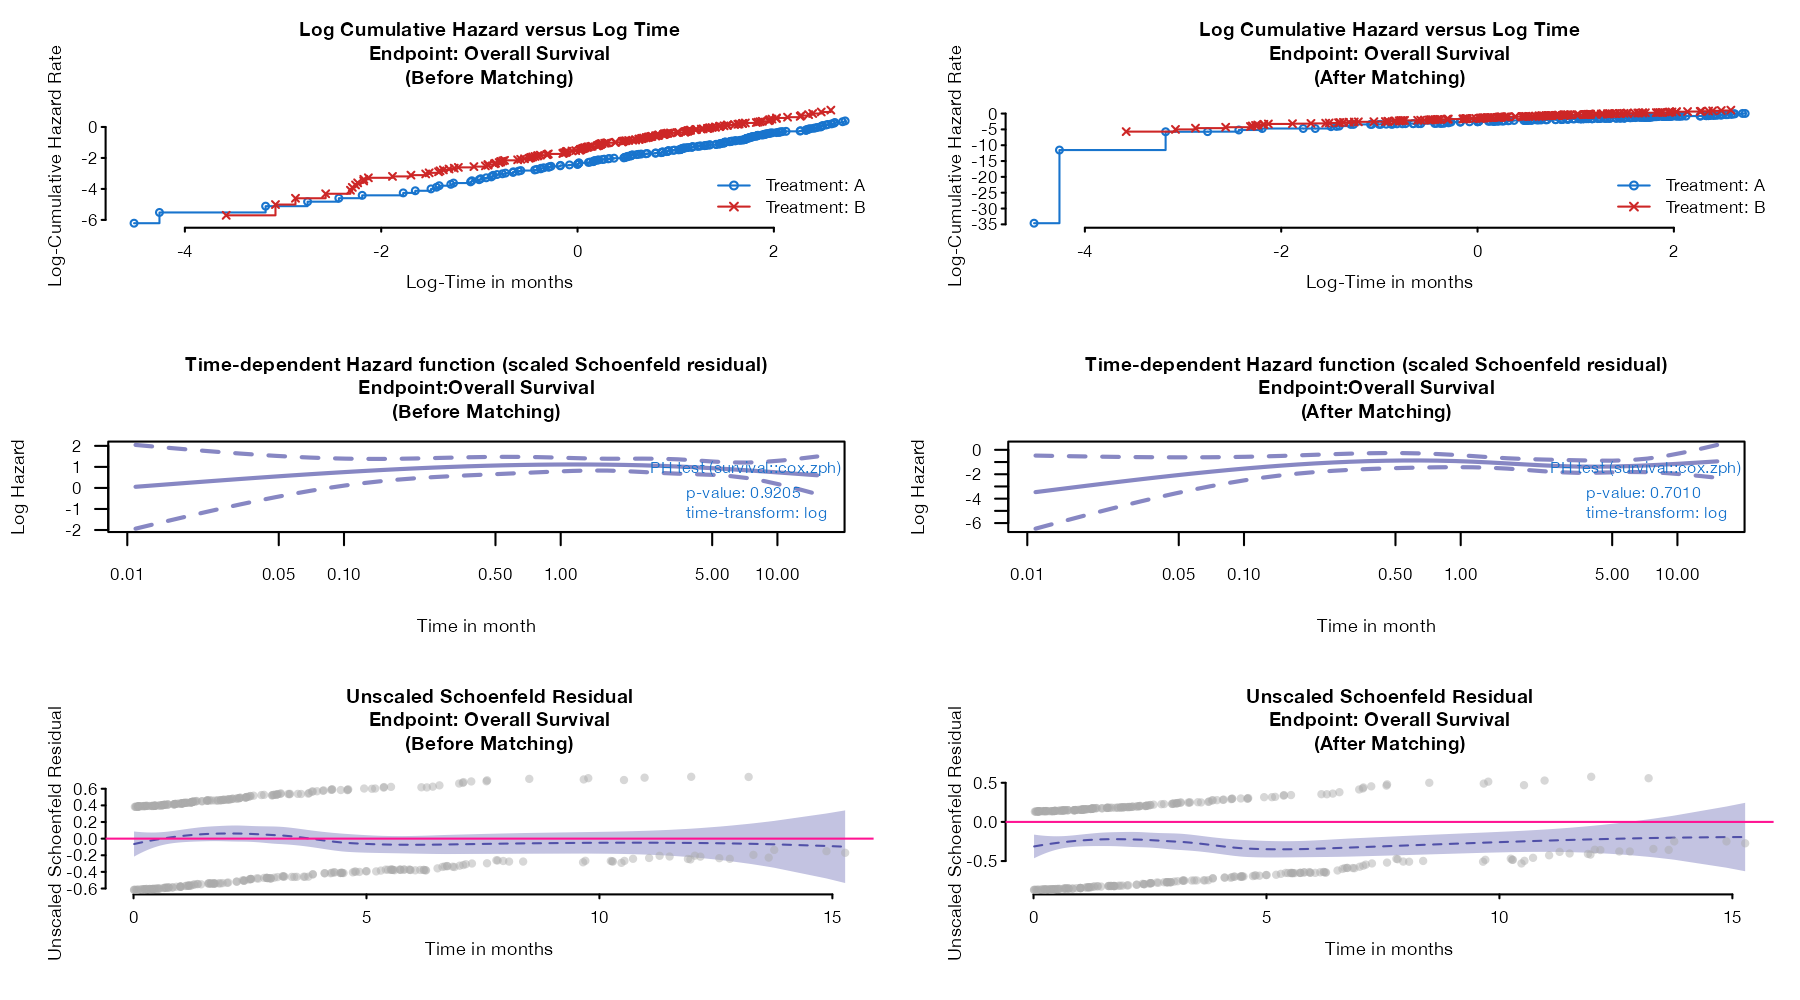
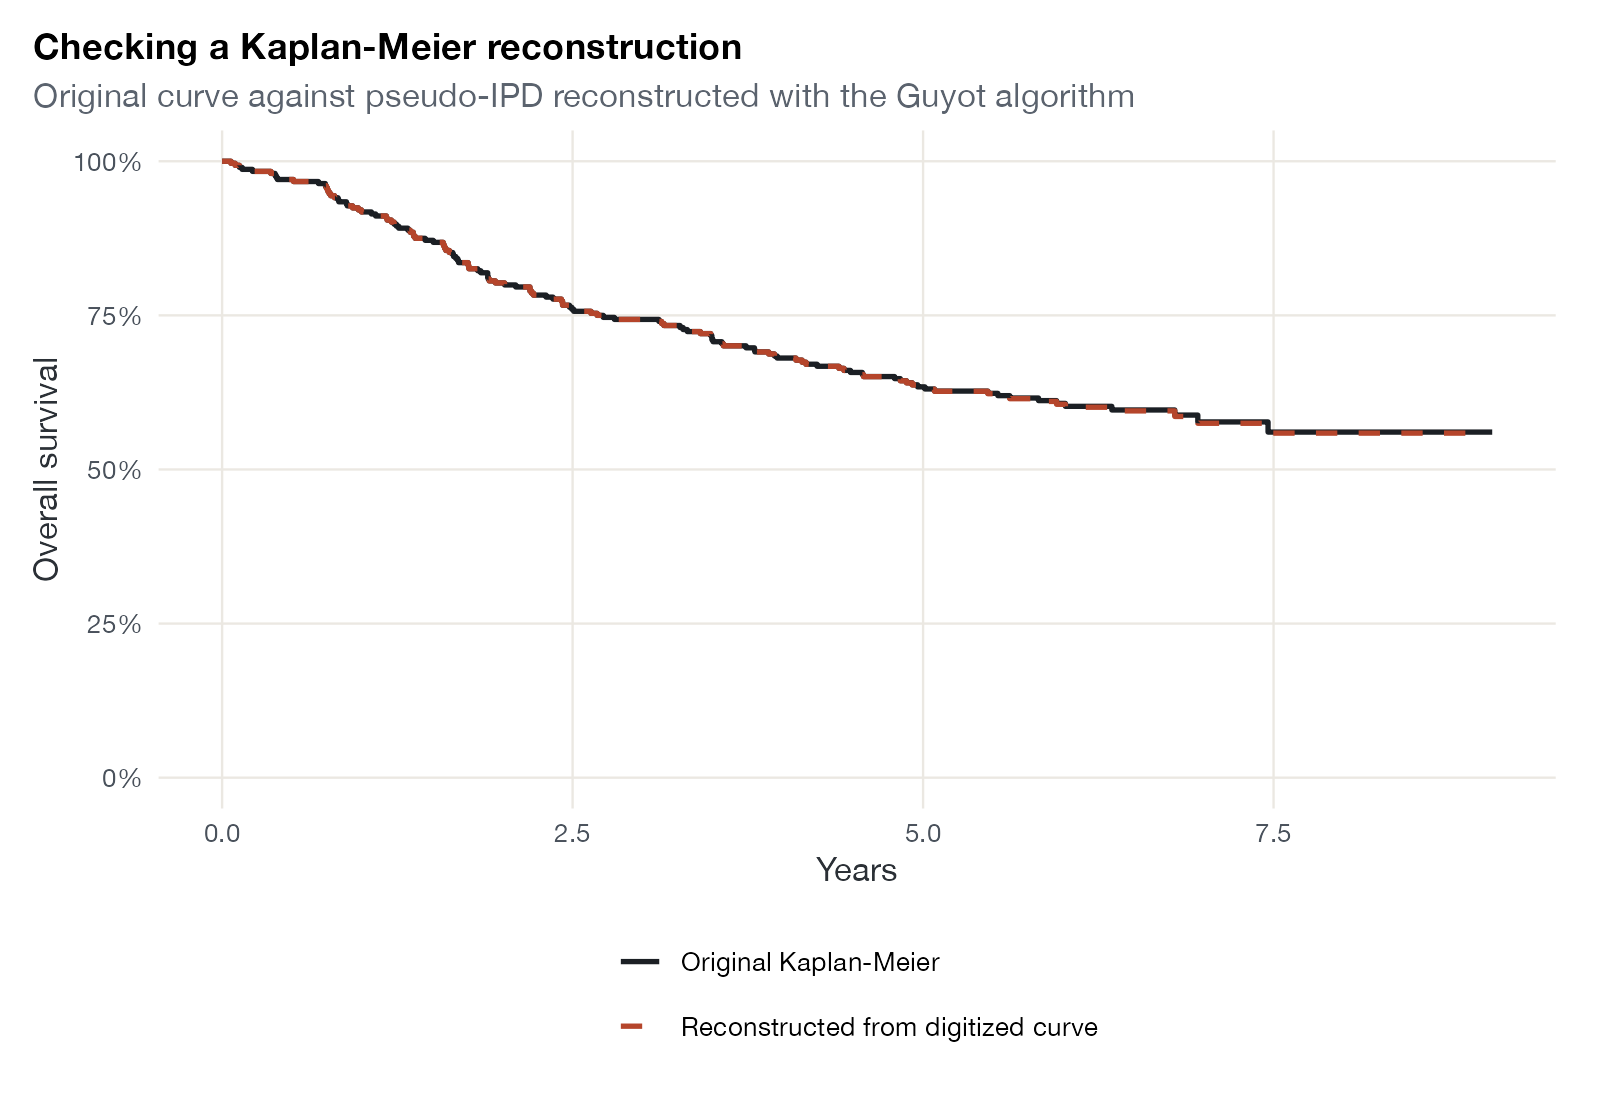
Kaplan-Meier displays, proportional hazards checks, and time-varying effects across ITC methods.
Simulation and method evaluation
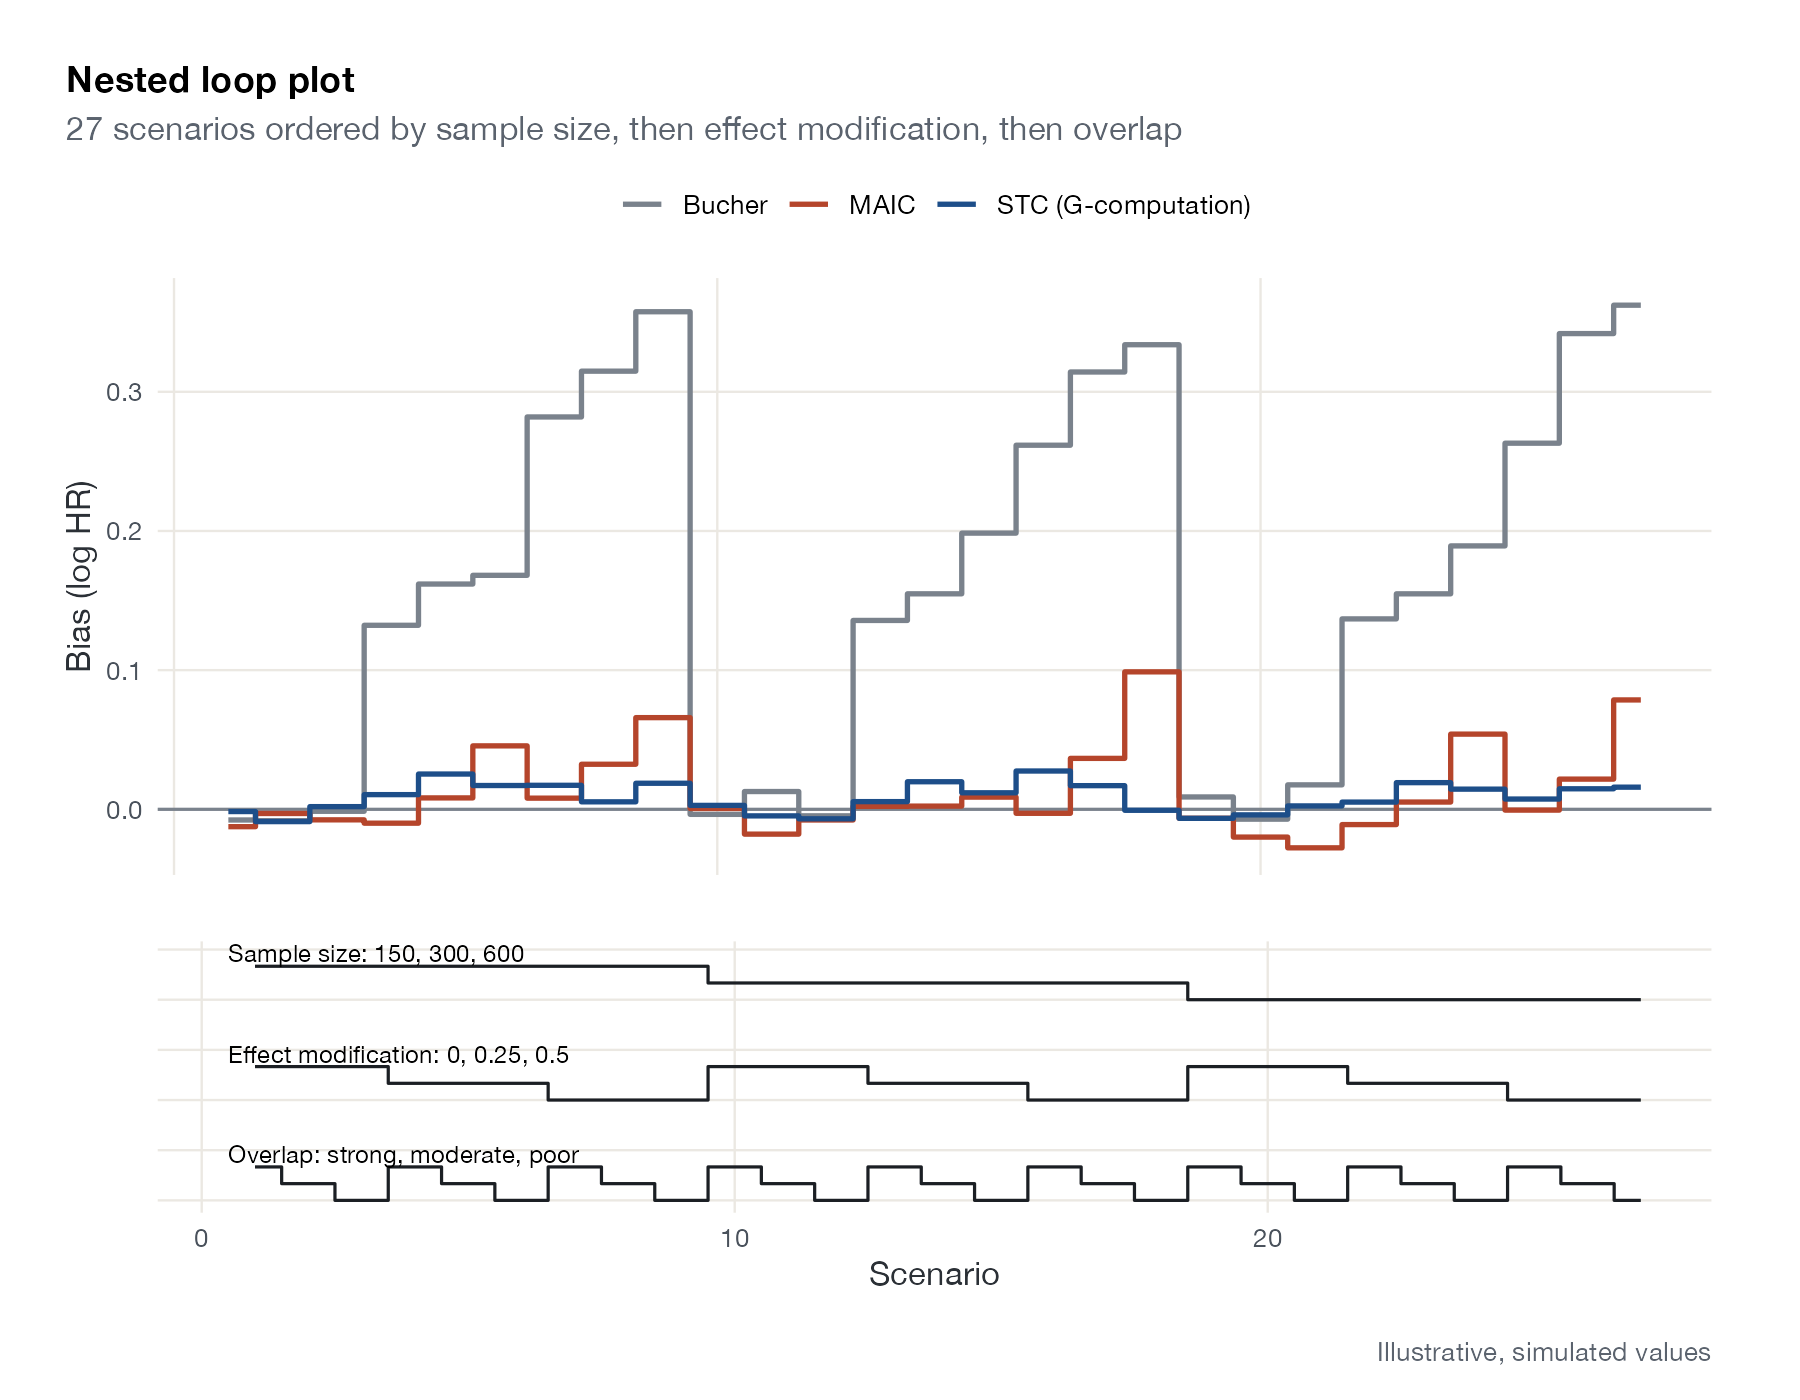
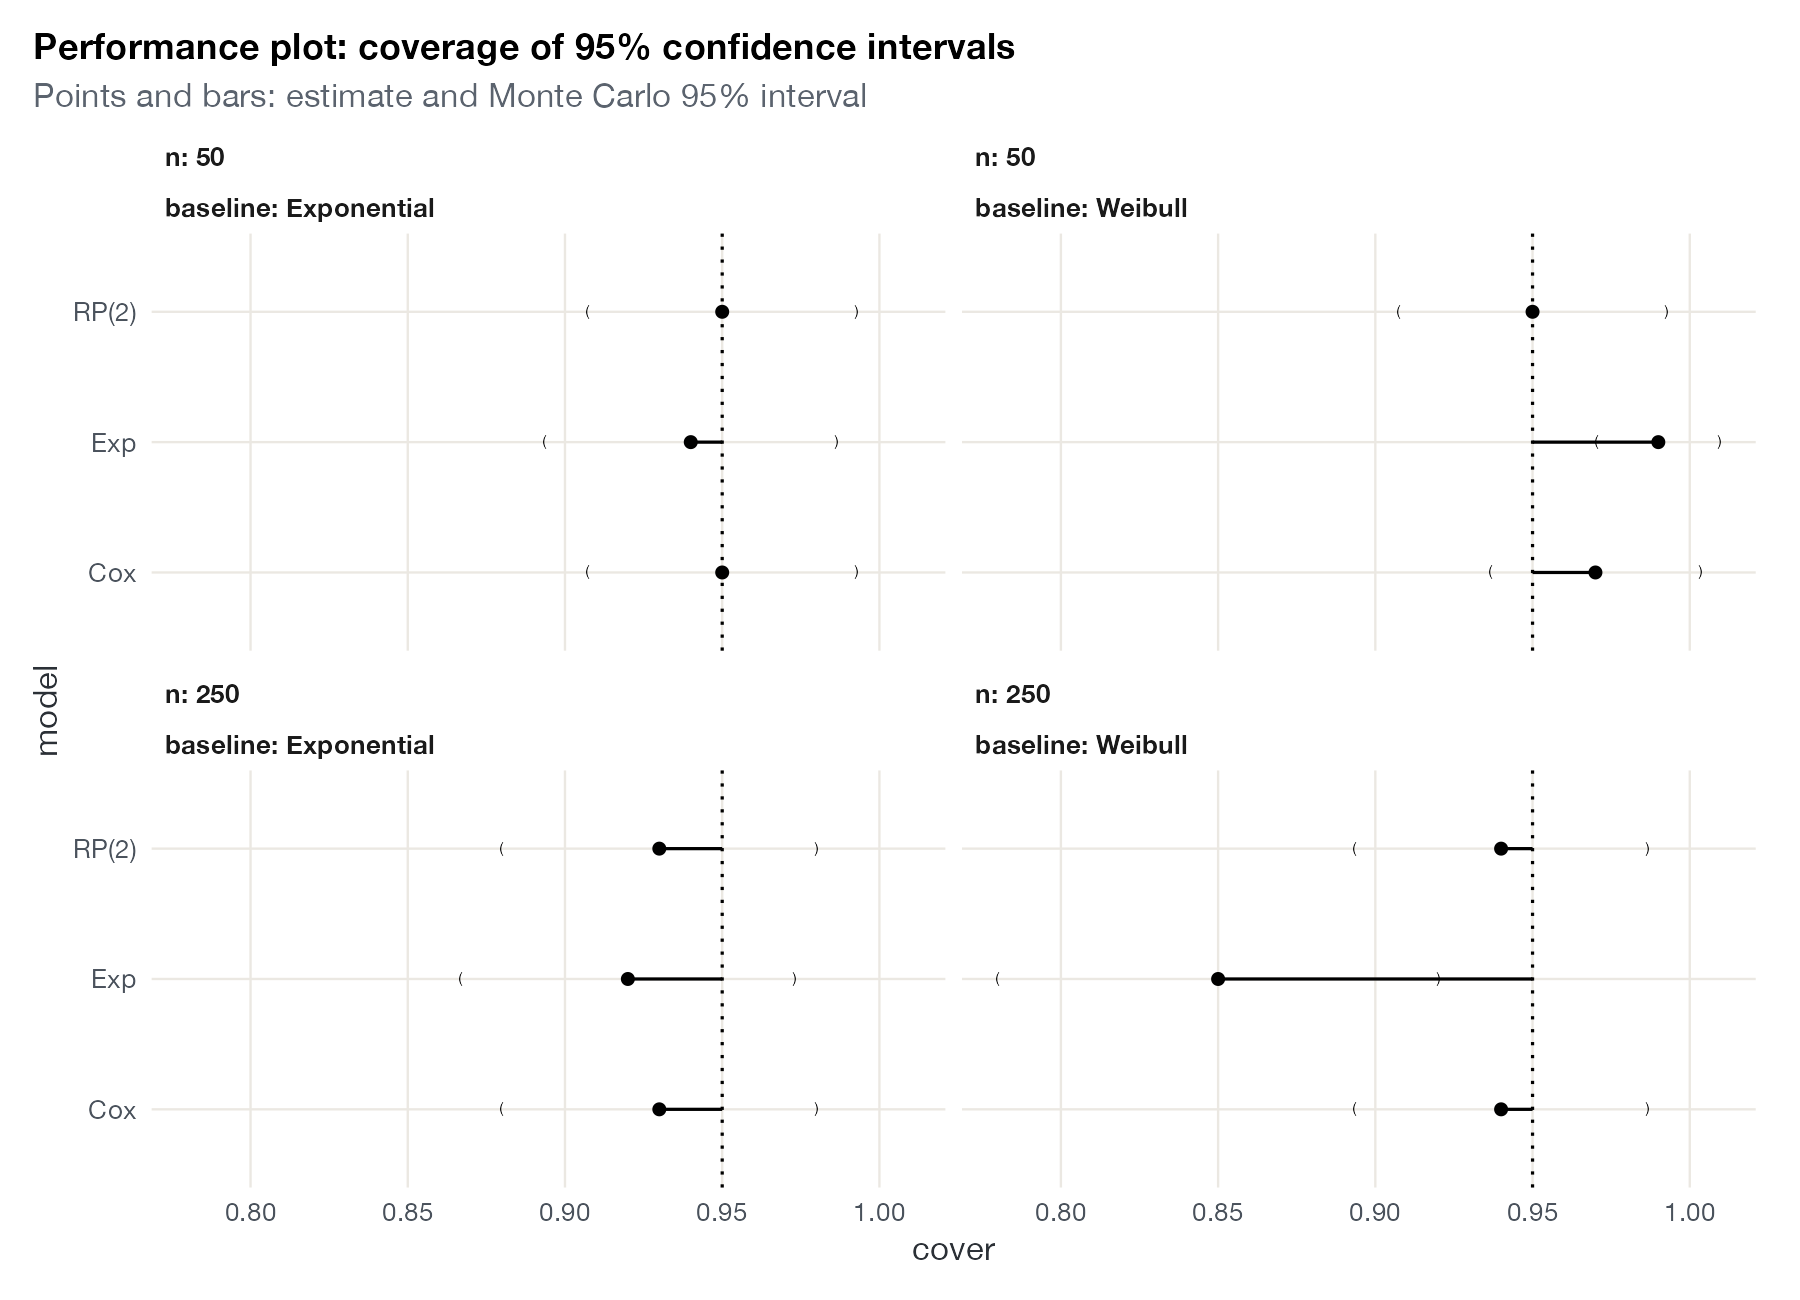
Graphics from the proof-of-concept literature that evaluates methods under known truth.
No plots match this filter. Try another method or search term.