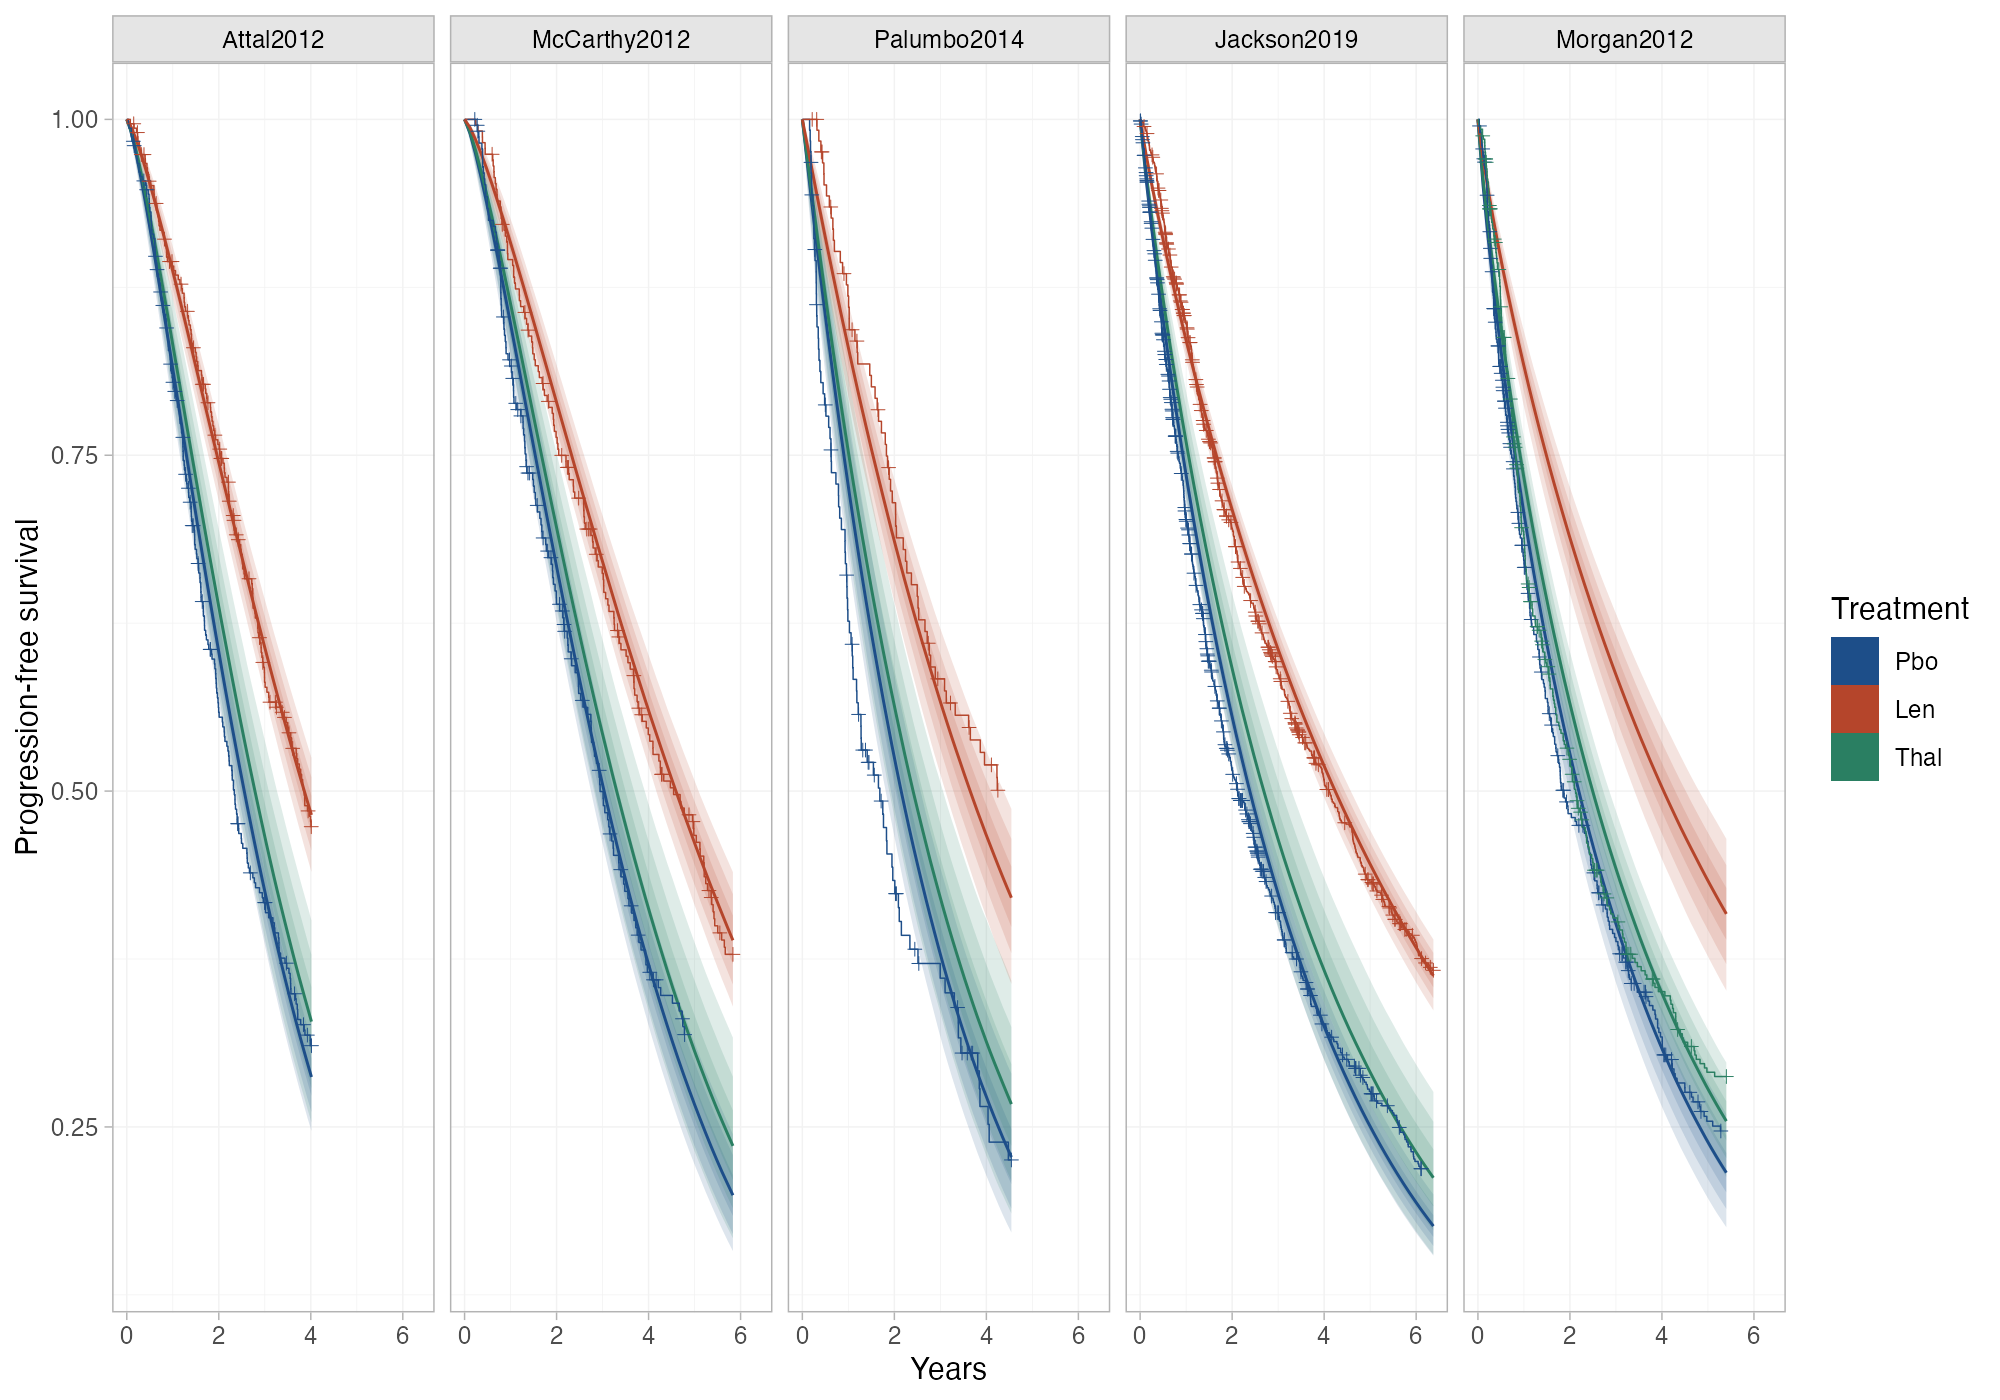
Fitted survival curves with Kaplan-Meier overlay
Model fit check for survival synthesis
multinma::ndmm_ipd, ndmm_agd.
multinma::geom_km() with plot(predict(type = "survival")), mlumr::geom_km(), flexsurv
What it shows
Synthesis of survival data, whether a Weibull or spline NMA, an ML-NMR with a general likelihood, a survival STC, or ML-UMR, rests on a parametric model for the baseline hazard and for how treatments change it. Overlaying each study’s fitted survival curves on its Kaplan-Meier curves is the most direct check that the model describes the data it was fitted to.
How to read it
- Panels: studies.
- Lines and bands: posterior mean fitted survival and credible intervals for each arm.
- Step curves: Kaplan-Meier estimates from IPD or reconstructed pseudo-IPD.
- Look for: systematic departures, such as fitted curves falling too fast early or too slowly late.
Interpretation
The Weibull model tracks the Kaplan-Meier curves closely in Attal 2012, McCarthy 2012, and Jackson 2019, with lenalidomide consistently above placebo. In Palumbo 2014 the placebo curve drops faster than the model predicts during the first two years. Misfit of that kind in individual studies suggests that a flexible baseline hazard (M-splines in multinma) is worth comparing before extrapolating.
Pitfalls
- Good fit over the observed follow-up does not validate long-term extrapolation.
- Reconstructed pseudo-IPD carries digitization error; check the reconstruction.
- With many studies, compare fit statistics (DIC, LOOIC) across candidate models, not only the plots.
Code
library(multinma)

# Newly diagnosed multiple myeloma: progression-free survival for
# lenalidomide, thalidomide, and placebo maintenance (3 IPD trials and
# reconstructed pseudo-IPD from 2 published trials)
ndmm_net <- combine_network(
  set_ipd(ndmm_ipd, study = studyf, trt = trtf, Surv = Surv(eventtime / 12, status)),
  set_agd_surv(ndmm_agd, study = studyf, trt = trtf, Surv = Surv(eventtime / 12, status),
               covariates = ndmm_agd_covs),
  trt_ref = "Pbo"
)

# Fixed-effect NMA with a Weibull likelihood (proportional hazards)
fit <- nma(ndmm_net, likelihood = "weibull",
           prior_intercept = normal(scale = 100), prior_trt = normal(scale = 10),
           prior_aux = half_normal(scale = 10), seed = 2026)

# Fitted survival curves in each study, with the observed Kaplan-Meier curves
plot(predict(fit, type = "survival")) +
  geom_km(ndmm_net) +
  ggplot2::labs(x = "Years", y = "Progression-free survival")
References
- Phillippo DM, Dias S, Ades AE, Welton NJ. Multilevel network meta-regression for general likelihoods: synthesis of individual and aggregate data with applications to survival analysis. J R Stat Soc Ser A. 2025. doi:10.1093/jrsssa/qnaf169
geom_km()reference. multinma documentation. dmphillippo.github.io/multinma- Latimer NR. NICE DSU Technical Support Document 14: Survival analysis for economic evaluations alongside clinical trials, extrapolation with patient-level data. 2011, updated 2013. sheffield.ac.uk/nice-dsu