Cumulative ranking plot
SUCRA curves, cumulative rankogram
NMA
ML-NMR
The probability of each treatment being at or better than each rank; the area under each curve is its SUCRA.
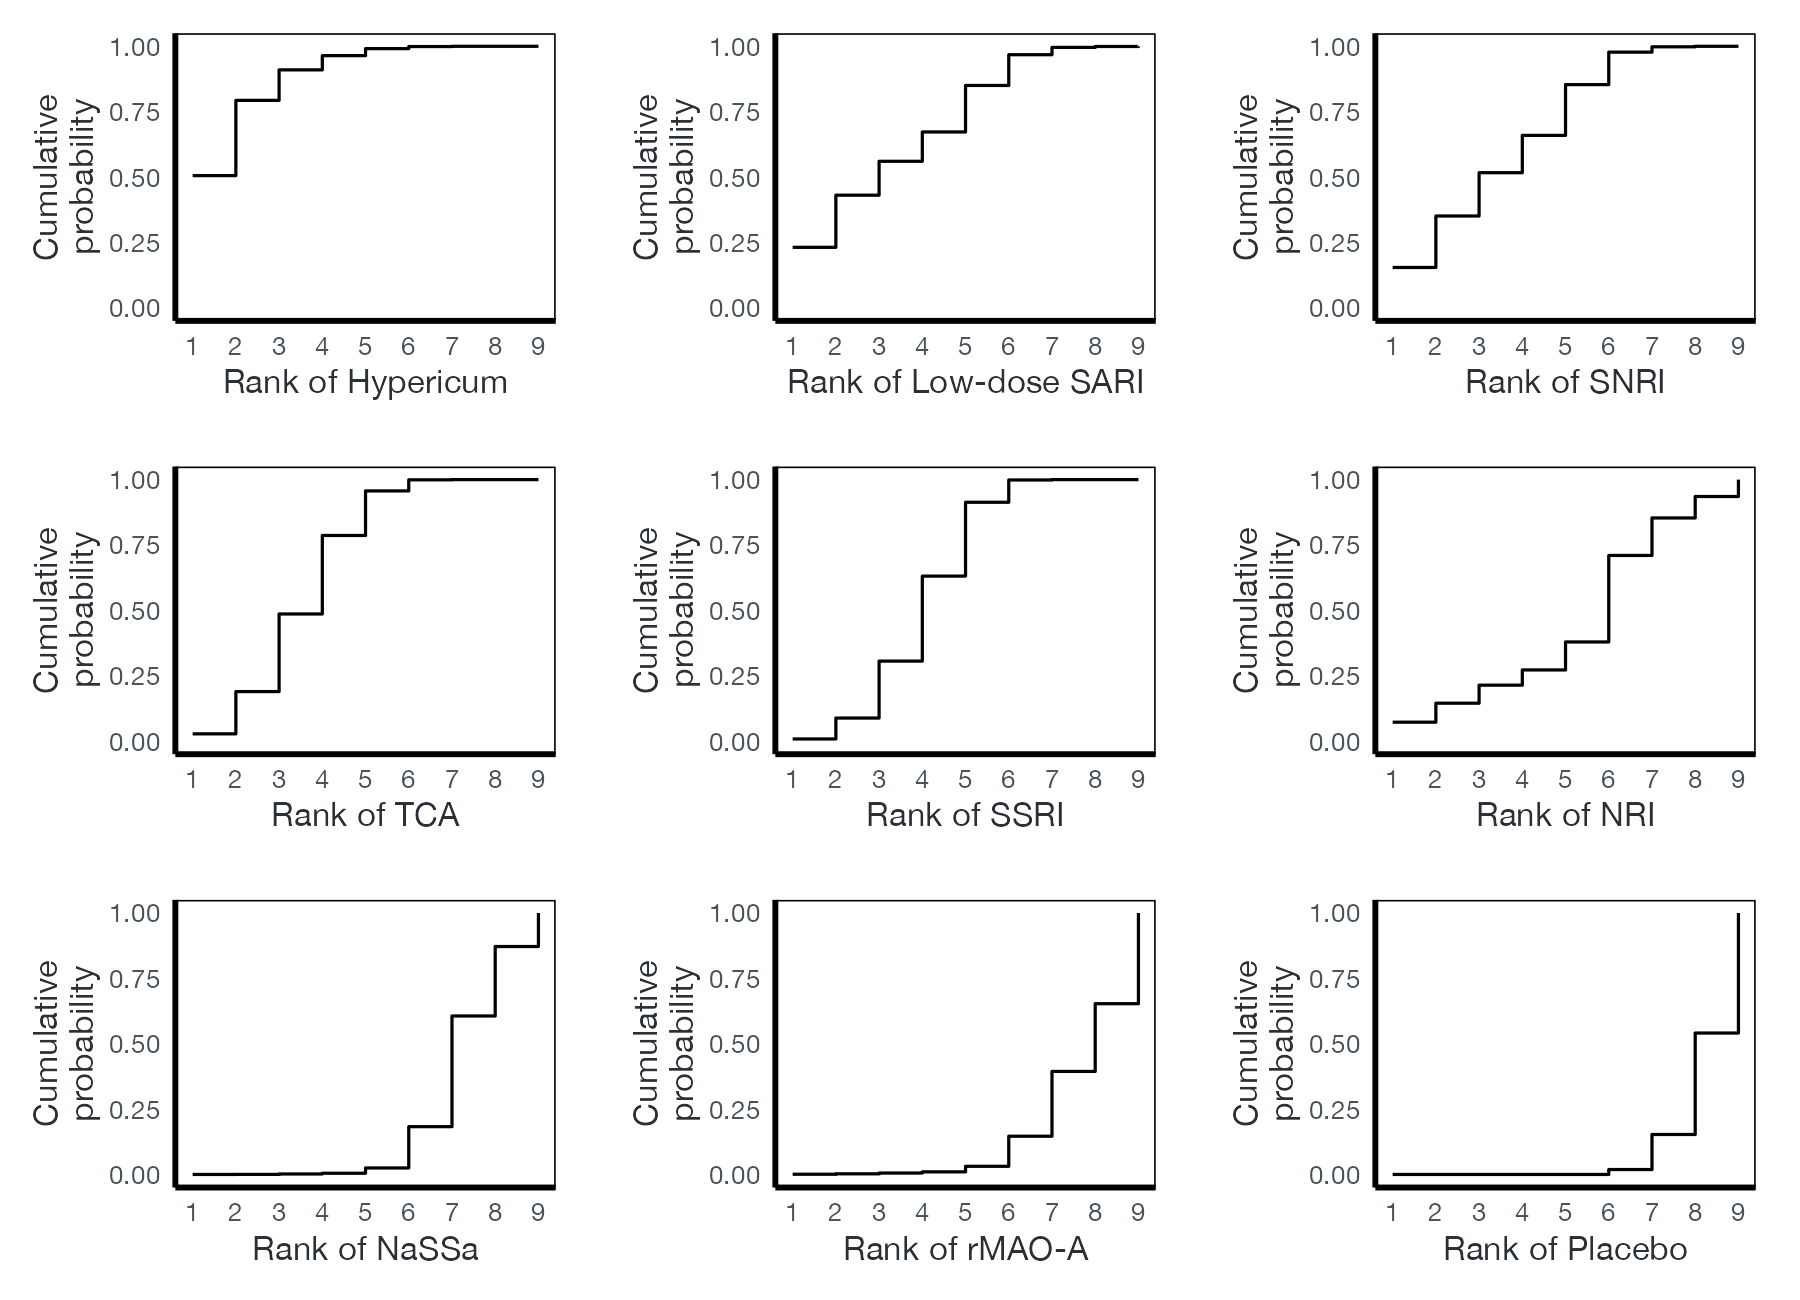
Cumulative rank probabilities for response in the antidepressant network (random effects, 5,000 resamples). The area under each curve, rescaled, is the surface under the cumulative ranking curve (SUCRA). Data:
netmeta::Linde2015.
Family
Treatment ranking
Purpose
Summarize rank distributions and define SUCRA.
Inputs
Rank probabilities.
Software
R
netmeta::rankogram(cumulative.rankprob = TRUE), multinma::posterior_rank_probs(cumulative = TRUE); Stata sucra
What it shows
Cumulating the rankogram gives, for each rank $, the probability that the treatment is among the best $. Salanti and colleagues defined the surface under this curve (SUCRA) as a one-number summary between 0 and 1: 1 if the treatment is certainly best, 0 if certainly worst. The plot shows both the summary and the distribution behind it.
How to read it
- Horizontal axis: rank $.
- Vertical axis: probability of being ranked $ or better.
- Steep early rise: likely to be near the top.
- Area under the curve: proportional to SUCRA.
Interpretation
Hypericum’s curve rises fastest, reaching about 80% by rank 2. The curves of SNRI, TCA, SSRI, and low-dose SARI overlap heavily in the middle ranks, so their ordering is uncertain. Placebo’s curve stays near zero until rank 8.
Pitfalls
- SUCRA does not report effect sizes; a treatment can rank highly when all differences are small.
- SUCRA values from different networks are not comparable.
- A treatment’s SUCRA depends on the other treatments included.
Code
library(netmeta)

# Antidepressants in primary care (Linde et al. 2015): arm-level binary outcomes
data(Linde2015)
d <- Linde2015
nma_for <- function(v, small) {
  p <- pairwise(treat = list(d$treatment1, d$treatment2, d$treatment3),
                event = list(d[[paste0(v, 1)]], d[[paste0(v, 2)]], d[[paste0(v, 3)]]),
                n = list(d$n1, d$n2, d$n3), studlab = d$id, sm = "OR", allstudies = TRUE)
  netmeta(p, common = FALSE, reference.group = "Placebo", small.values = small)
}

resp <- nma_for("resp", small = "undesirable")

# Cumulative rank probabilities; the area under each curve is the SUCRA
rk <- rankogram(resp, nsim = 5000, cumulative.rankprob = TRUE)
plot(rk)
References
- Salanti G, Ades AE, Ioannidis JPA. Graphical methods and numerical summaries for presenting results from multiple-treatment meta-analysis: an overview and tutorial. J Clin Epidemiol. 2011;64:163-171. doi:10.1016/j.jclinepi.2010.03.016
- Rücker G, Schwarzer G. Ranking treatments in frequentist network meta-analysis works without resampling methods. BMC Med Res Methodol. 2015;15:58. doi:10.1186/s12874-015-0060-8