Sunset funnel plot
Power-enhanced funnel plot
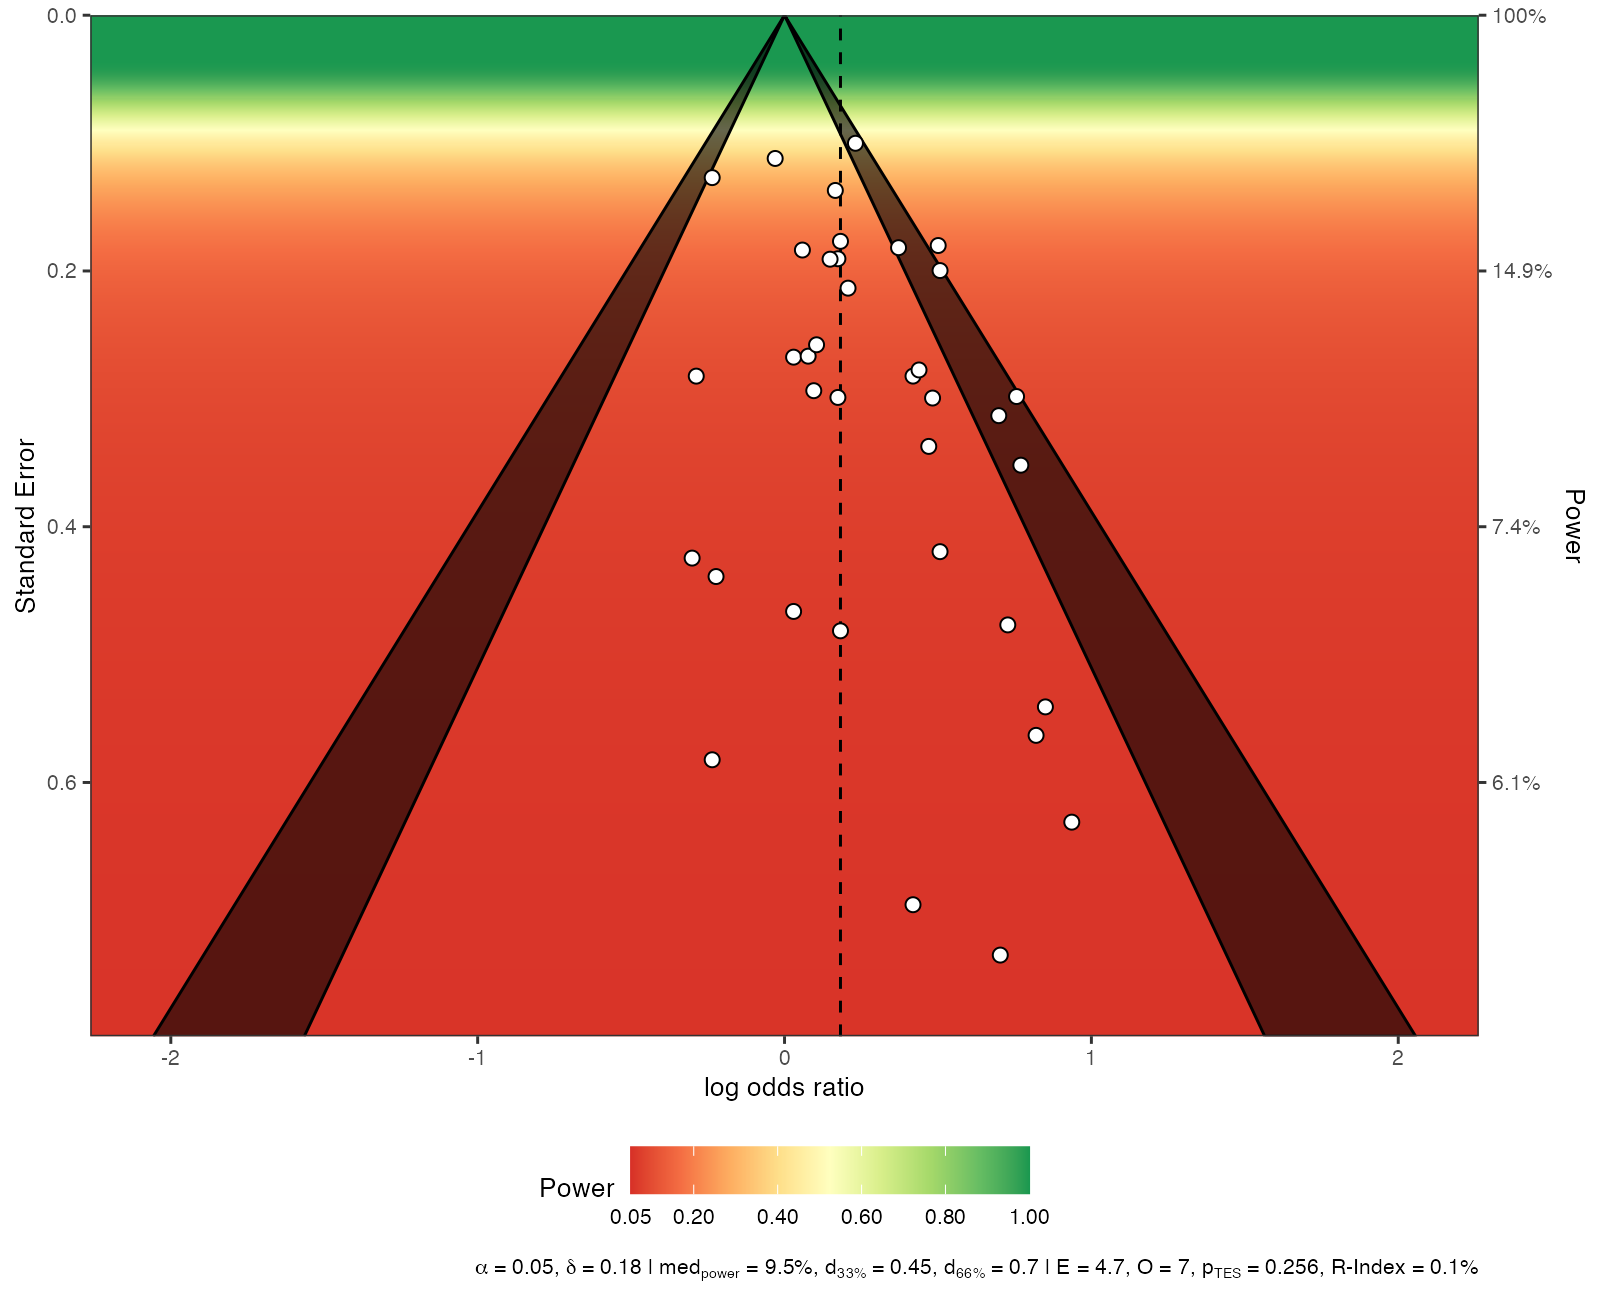
metadat::dat.hackshaw1998.
metaviz::viz_sunset()
What it shows
Kossmeier and colleagues proposed coloring the background of a funnel plot by power: for an assumed true effect, every standard error corresponds to a probability that a study of that precision would reach significance. The plot therefore shows, at a glance, how many of the studies were adequately powered, and it can be paired with tests of excess significance: if studies are underpowered but mostly significant, something other than chance may be at work.
How to read it
- Axes: as in a funnel plot, with standard error on the vertical axis.
- Background color: power to detect the assumed true effect, from red (low) to green (high); the right axis gives power at selected standard errors.
- Dashed line: the assumed true effect.
- Footer statistics: median power, effect sizes detectable with 33% and 66% power, and tests of excess significance.
Interpretation
Assuming a true odds ratio of 1.2, almost every study sits in the red region: the median power is below 10%. Only a very large study would have had a good chance of detecting such an effect. Under these conditions, a literature in which a sizable share of studies reports significant harm deserves scrutiny.
Pitfalls
- Power depends entirely on the assumed true effect; using the possibly biased pooled estimate is circular. Show several plausible values.
- Low power is a property of the evidence base, not proof of bias.
- Excess significance tests have low power themselves with few studies.
Code
library(metaviz)

data(dat.hackshaw1998, package = "metadat")

# Power-enhanced funnel: background shows each study's power to detect
# the assumed true effect (here the pooled OR, about 1.2)
viz_sunset(
  x = data.frame(es = dat.hackshaw1998$yi, se = sqrt(dat.hackshaw1998$vi)),
  true_effect = log(1.2),
  method = "REML",
  xlab = "log odds ratio",
  power_contours = "continuous",
  text_size = 3.4, point_size = 2.2
)
References
- Kossmeier M, Tran US, Voracek M. Power-enhanced funnel plots for meta-analysis: the sunset funnel plot. Z Psychol. 2020;228:43-49. doi:10.1027/2151-2604/a000392
- Ioannidis JPA, Trikalinos TA. An exploratory test for an excess of significant findings. Clin Trials. 2007;4:245-253. doi:10.1177/1740774507079441