Paired forest plot of sensitivity and specificity
Coupled forest plot
DTA
Side-by-side forest plots of each study’s sensitivity and specificity with confidence intervals.
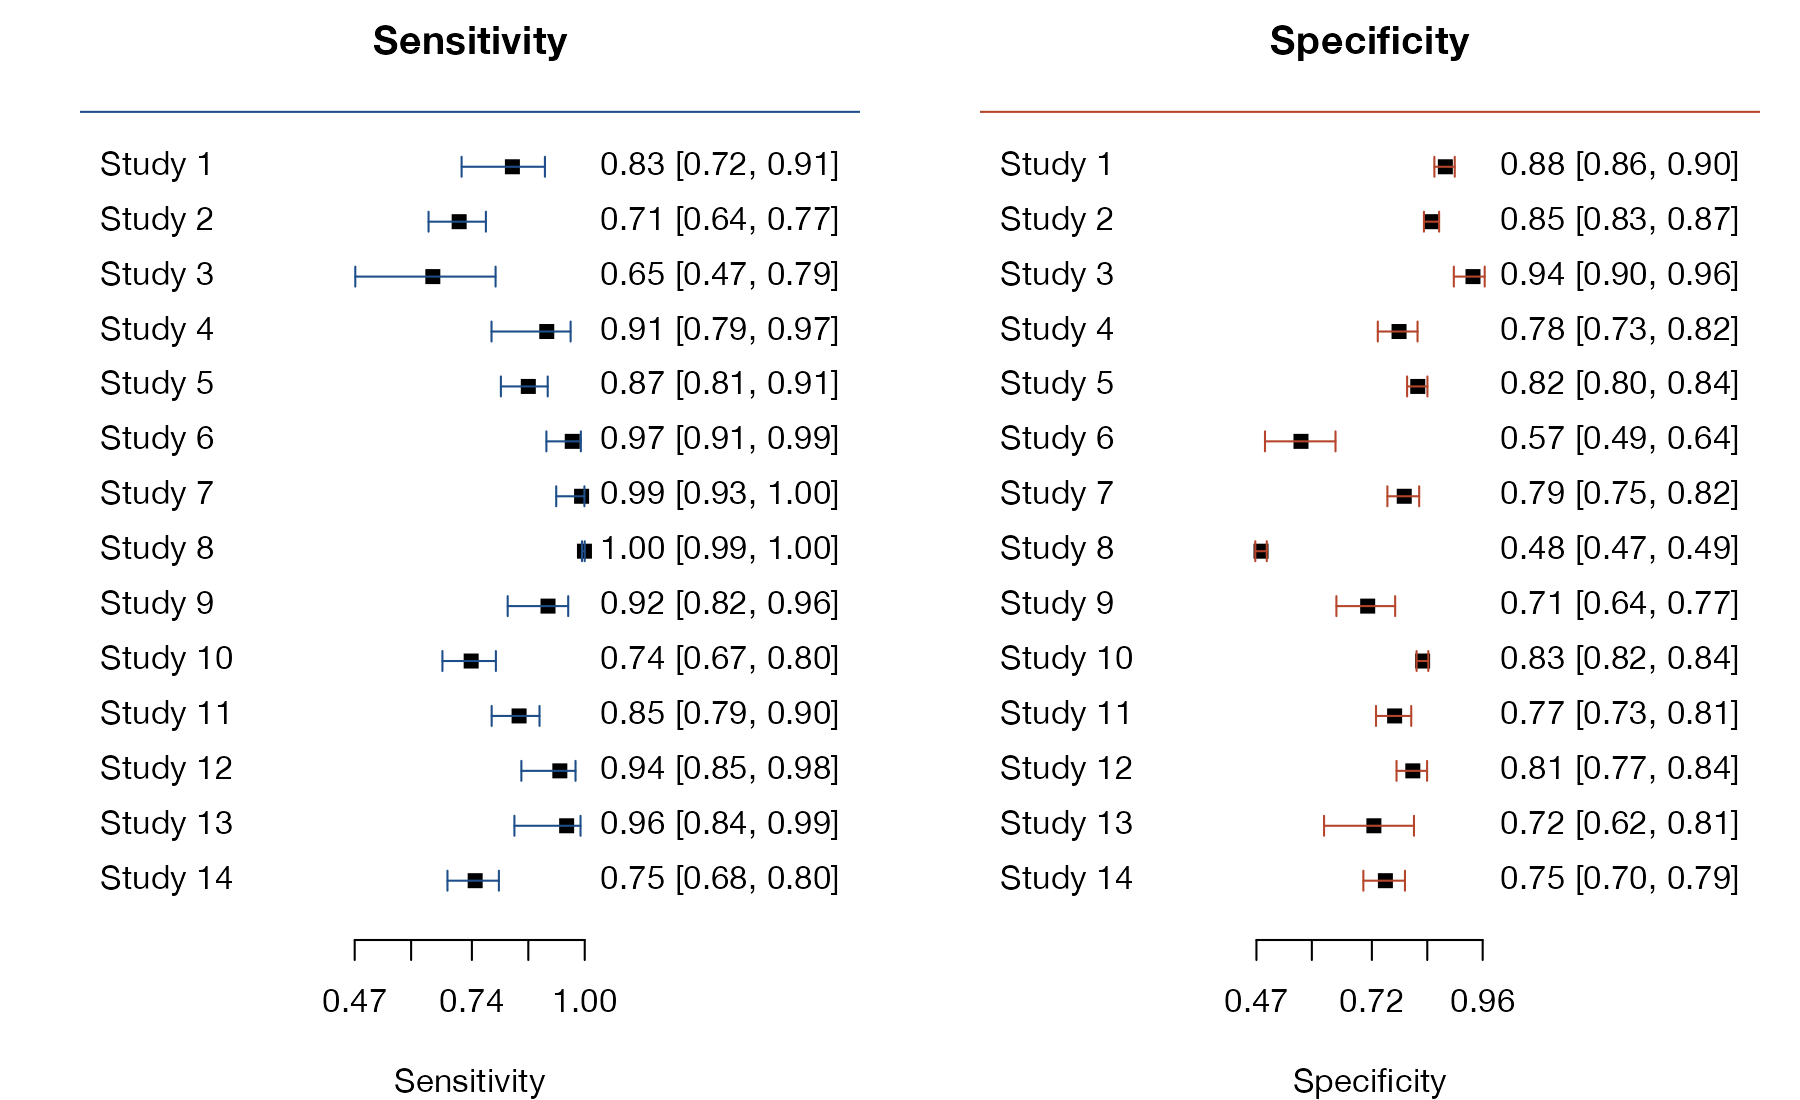
Sensitivity and specificity with 95% confidence intervals for 14 studies of the AUDIT-C questionnaire for detecting unhealthy alcohol use. Data:
mada::AuditC.
Family
Diagnostic test accuracy
Purpose
Display the accuracy results of every study in a diagnostic test accuracy review.
Inputs
2x2 tables (true positives, false negatives, false positives, true negatives) per study.
Software
R
mada::forest(), meta::metaprop(); RevMan; Stata midas, metandi
What it shows
Diagnostic accuracy has two dimensions, sensitivity and specificity, and they must be shown together because they trade off through the positivity threshold. The paired (coupled) forest plot, standard in Cochrane DTA reviews, places each study’s sensitivity and specificity side by side so that heterogeneity in either, and their relationship, is visible.
How to read it
- Rows: studies, in the same order on both sides.
- Left: sensitivity with 95% CI; right: specificity with 95% CI.
- Paired reading: a study with high sensitivity and low specificity may use a lower threshold.
Interpretation
Sensitivity ranges from 0.65 to 1.00 and specificity from 0.48 to 0.94. Studies 6 and 8 have among the highest sensitivities (0.97 and 1.00) and the lowest specificities (0.57 and 0.48), the pattern expected when studies use different AUDIT-C cutoffs, which is why the two must be pooled jointly rather than separately.
Pitfalls
- Pooling sensitivity and specificity separately ignores their correlation and can produce misleading summaries.
- Differences in thresholds, reference standards, and populations drive heterogeneity; report them next to the plot.
- Summary diamonds are usually omitted because a bivariate model is needed for pooling.
Code
library(mada)

# AUDIT-C questionnaire for detecting unhealthy alcohol use: 14 studies
data(AuditC)
d <- madad(AuditC)

# Paired forest plots of sensitivity and specificity with 95% CIs
par(mfrow = c(1, 2), mar = c(4, 2, 2, 1))
forest(d, type = "sens", main = "Sensitivity", xlab = "Sensitivity",
       snames = paste("Study", seq_len(nrow(AuditC))), col = "#1d4e89")
forest(d, type = "spec", main = "Specificity", xlab = "Specificity",
       snames = paste("Study", seq_len(nrow(AuditC))), col = "#b5452b")
References
- Reitsma JB, Glas AS, Rutjes AWS, Scholten RJPM, Bossuyt PM, Zwinderman AH. Bivariate analysis of sensitivity and specificity produces informative summary measures in diagnostic reviews. J Clin Epidemiol. 2005;58:982-990. doi:10.1016/j.jclinepi.2005.02.022
- Macaskill P, Takwoingi Y, Deeks JJ, Gatsonis C. Chapter 10: Undertaking meta-analysis. In: Cochrane Handbook for Systematic Reviews of Diagnostic Test Accuracy. Version 2. Cochrane; 2023. training.cochrane.org