Trim-and-fill funnel plot
Funnel plot with imputed studies
MA
A funnel plot with algorithmically imputed “missing” studies that would make it symmetric, and the adjusted pooled estimate.
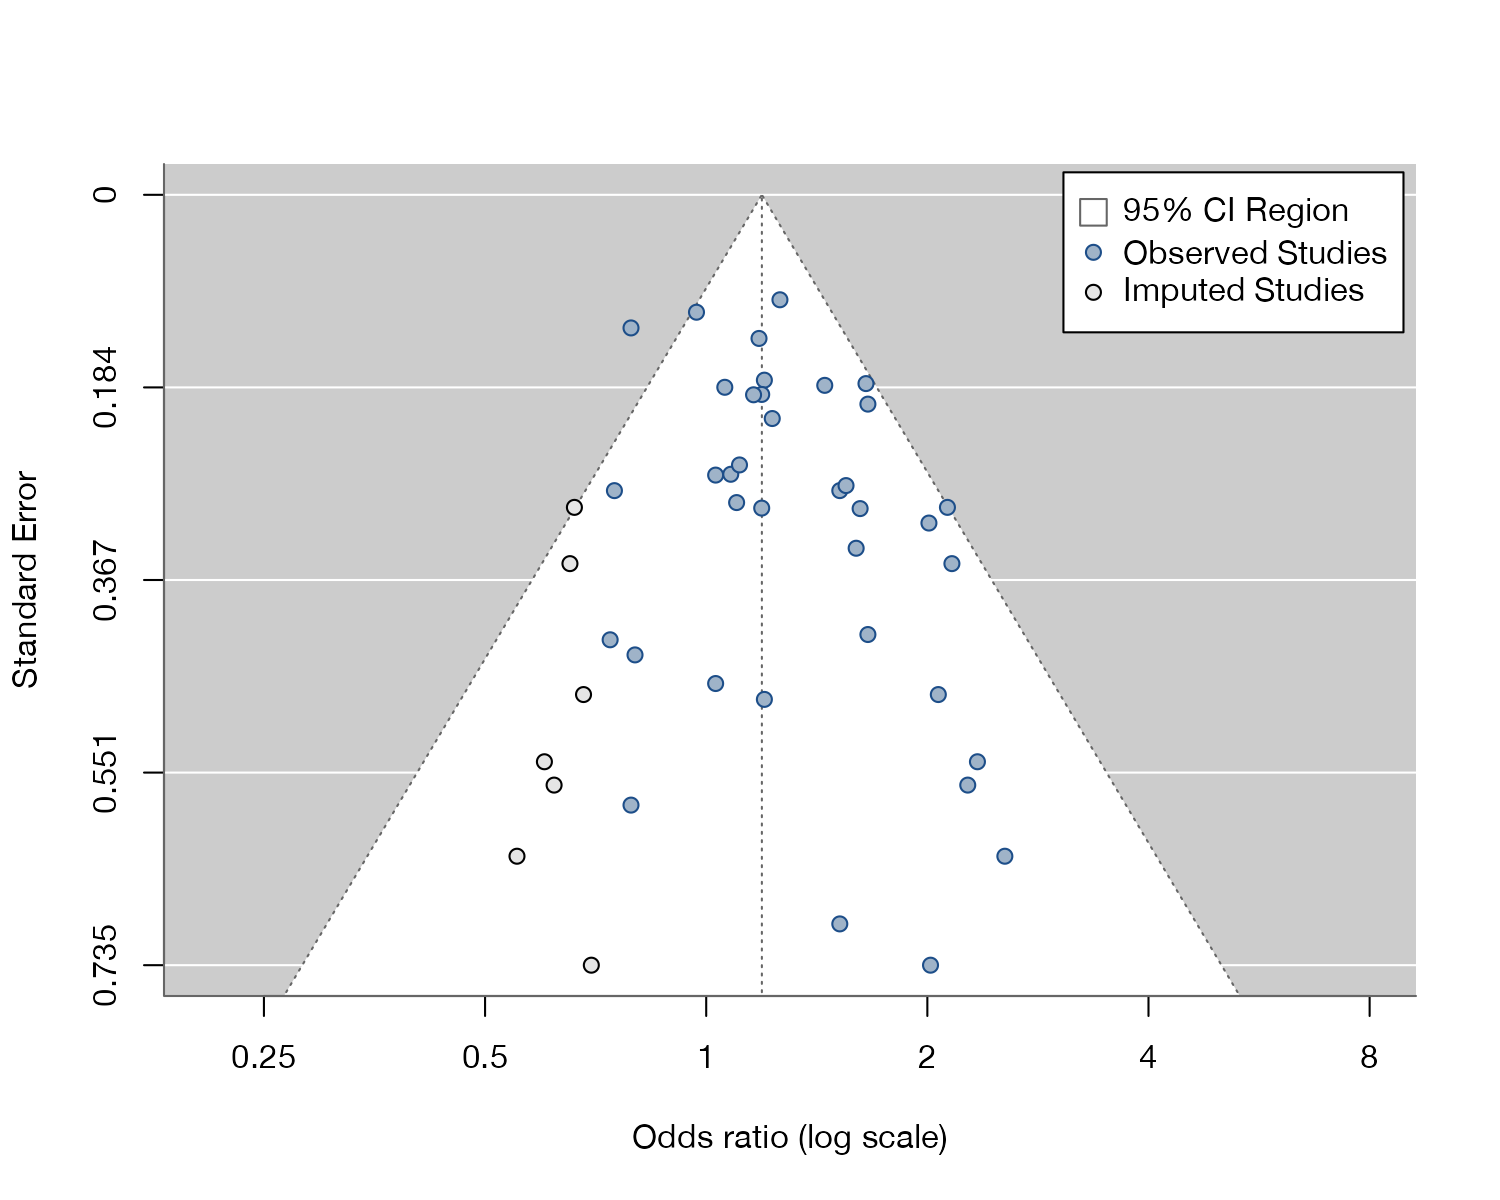
Trim-and-fill funnel plot of the passive smoking studies. Filled circles are observed studies; open circles are the seven studies imputed on the left to restore symmetry. The vertical line is the adjusted pooled estimate. Data:
metadat::dat.hackshaw1998.
Family
Small-study effects and reporting bias
Purpose
Provide a sensitivity analysis for funnel asymmetry by imputing mirror-image studies.
Inputs
Study estimates with standard errors.
Software
R
metafor::trimfill(), meta::trimfill(); Stata meta trimfill
What it shows
Duval and Tweedie’s trim-and-fill method estimates how many studies are missing from the sparse side of the funnel, “trims” the most extreme studies from the other side, re-estimates the center, and then “fills” in mirror images of the trimmed studies. The plot shows the observed studies, the imputed ones in a different symbol, and the adjusted pooled estimate.
How to read it
- Filled points: observed studies.
- Open points: imputed studies, mirror images of observed ones.
- Vertical line: the pooled estimate after filling.
- Funnel: pseudo-confidence limits around the adjusted estimate.
Interpretation
Seven studies are imputed on the left. The pooled odds ratio falls from 1.24 to 1.19 (95% CI 1.08 to 1.31), so the association persists under this adjustment. A reasonable conclusion is that the result is fairly robust to the kind of asymmetry trim-and-fill assumes, not that the true effect is 1.19.
Pitfalls
- Imputed studies are not real missing studies; they are an artifact of the symmetry assumption.
- The adjusted estimate is not a bias-corrected truth. The method performs poorly when heterogeneity is large and when asymmetry has causes other than publication bias.
- Results depend on the estimator of the number of missing studies (\(L_0\) or \(R_0\)) and on the model.
Code
library(metafor)

data(dat.hackshaw1998, package = "metadat")

fit <- rma(yi, vi, data = dat.hackshaw1998, method = "REML")

# Trim-and-fill imputes "missing" studies to make the funnel symmetric
tf <- trimfill(fit)

funnel(tf, atransf = exp, at = log(c(0.25, 0.5, 1, 2, 4, 8)),
       pch = 21, bg = "#9fb3c8", col = "#1d4e89",
       pch.fill = 21, col.fill = "#b5452b",
       legend = list(show = "cis"),
       xlab = "Odds ratio (log scale)")
meta set yi sei
meta trimfill, funnelReferences
- Duval S, Tweedie R. Trim and fill: a simple funnel-plot-based method of testing and adjusting for publication bias in meta-analysis. Biometrics. 2000;56:455-463. doi:10.1111/j.0006-341X.2000.00455.x
- Peters JL, Sutton AJ, Jones DR, Abrams KR, Rushton L. Performance of the trim and fill method in the presence of publication bias and between-study heterogeneity. Stat Med. 2007;26:4544-4562. doi:10.1002/sim.2889