Beading plot
Multi-outcome ranking bead plot
NMA
One horizontal thread per outcome, with each treatment as a colored bead positioned at its ranking score.
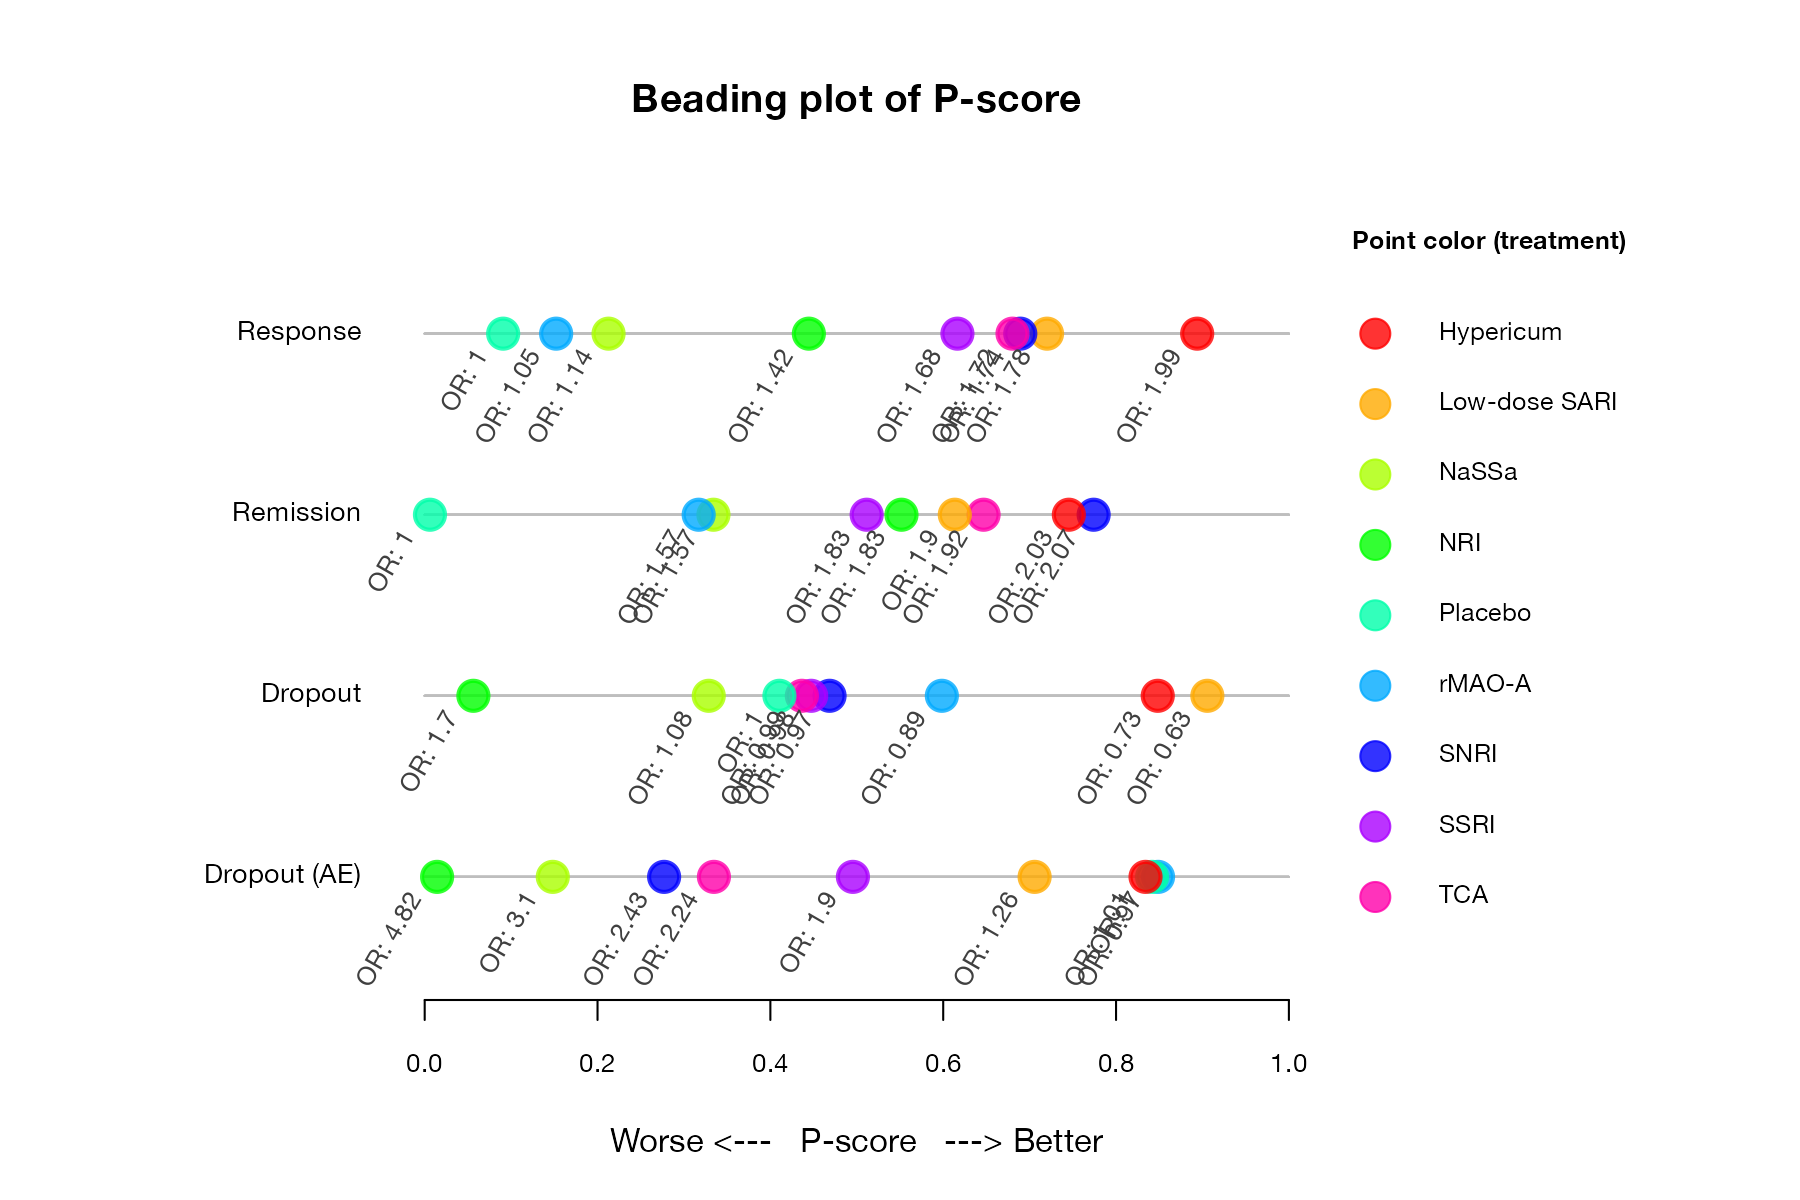
Beading plot of P-scores for four outcomes in the antidepressant network. Each thread is an outcome, each bead a treatment (colored consistently), labeled with its odds ratio against placebo. Data:
netmeta::Linde2015.
Family
Treatment ranking
Purpose
Compare how each treatment’s ranking changes across outcomes.
Inputs
Ranking metrics (P-score, SUCRA, or probability of being best) per outcome.
Software
R
rankinma::PlotBeads()
What it shows
The beading plot, implemented in the rankinma package, draws each outcome as a horizontal line on a common 0 to 1 scale of a ranking metric. Each treatment is a bead of a fixed color, placed at its score for that outcome and annotated with its effect estimate. Following one color down the threads shows how a treatment’s standing shifts from outcome to outcome.
How to read it
- Threads: outcomes.
- Horizontal position: ranking metric, worse to the left and better to the right.
- Bead color: treatment, consistent across threads.
- Labels: the effect estimate for each treatment on that outcome.
Interpretation
The red bead (hypericum) sits far right on every thread. NRI (bright green) slides from mid-thread for response to the far left for both dropout outcomes. Placebo (turquoise) moves from the left end for efficacy to the right for dropout due to adverse events, showing the expected trade-off between benefit and tolerability.
Pitfalls
- Many colors are hard to tell apart; beyond about eight treatments, consider highlighting a subset.
- Ranking metrics are not effect sizes; the labels help but can crowd.
Code
library(netmeta)

# Antidepressants in primary care (Linde et al. 2015): arm-level binary outcomes
data(Linde2015)
d <- Linde2015
nma_for <- function(v, small) {
  p <- pairwise(treat = list(d$treatment1, d$treatment2, d$treatment3),
                event = list(d[[paste0(v, 1)]], d[[paste0(v, 2)]], d[[paste0(v, 3)]]),
                n = list(d$n1, d$n2, d$n3), studlab = d$id, sm = "OR", allstudies = TRUE)
  netmeta(p, common = FALSE, reference.group = "Placebo", small.values = small)
}
library(rankinma)

resp <- nma_for("resp", small = "undesirable")
remi <- nma_for("remi", small = "undesirable")
loss <- nma_for("loss", small = "desirable")
lossae <- nma_for("loss.ae", small = "desirable")

# Collect P-scores for each outcome, then draw one "thread" per outcome
# with each treatment as a colored bead at its P-score
m <- rbind(GetMetrics(resp, outcome = "Response", prefer = "large", metrics = "P-score"),
           GetMetrics(remi, outcome = "Remission", prefer = "large", metrics = "P-score"),
           GetMetrics(loss, outcome = "Dropout", prefer = "small", metrics = "P-score"),
           GetMetrics(lossae, outcome = "Dropout (AE)", prefer = "small", metrics = "P-score"))
beads <- SetMetrics(m, tx = tx, outcome = outcome, metrics = P.score, metrics.name = "P-score")
PlotBeads(beads, scaleX = "Numeric", txtValue = "Effects")
References
- rankinma: Rank in network meta-analysis. R package. cran.r-project.org/package=rankinma
- Linde K, Kriston L, Rücker G, et al. Efficacy and acceptability of pharmacological treatments for depressive disorders in primary care: systematic review and network meta-analysis. Ann Fam Med. 2015;13:69-79. doi:10.1370/afm.1687