Integration error plot
Numerical integration diagnostic for ML-NMR
multinma plaque psoriasis example.
int_thin > 0).
multinma::plot_integration_error()
What it shows
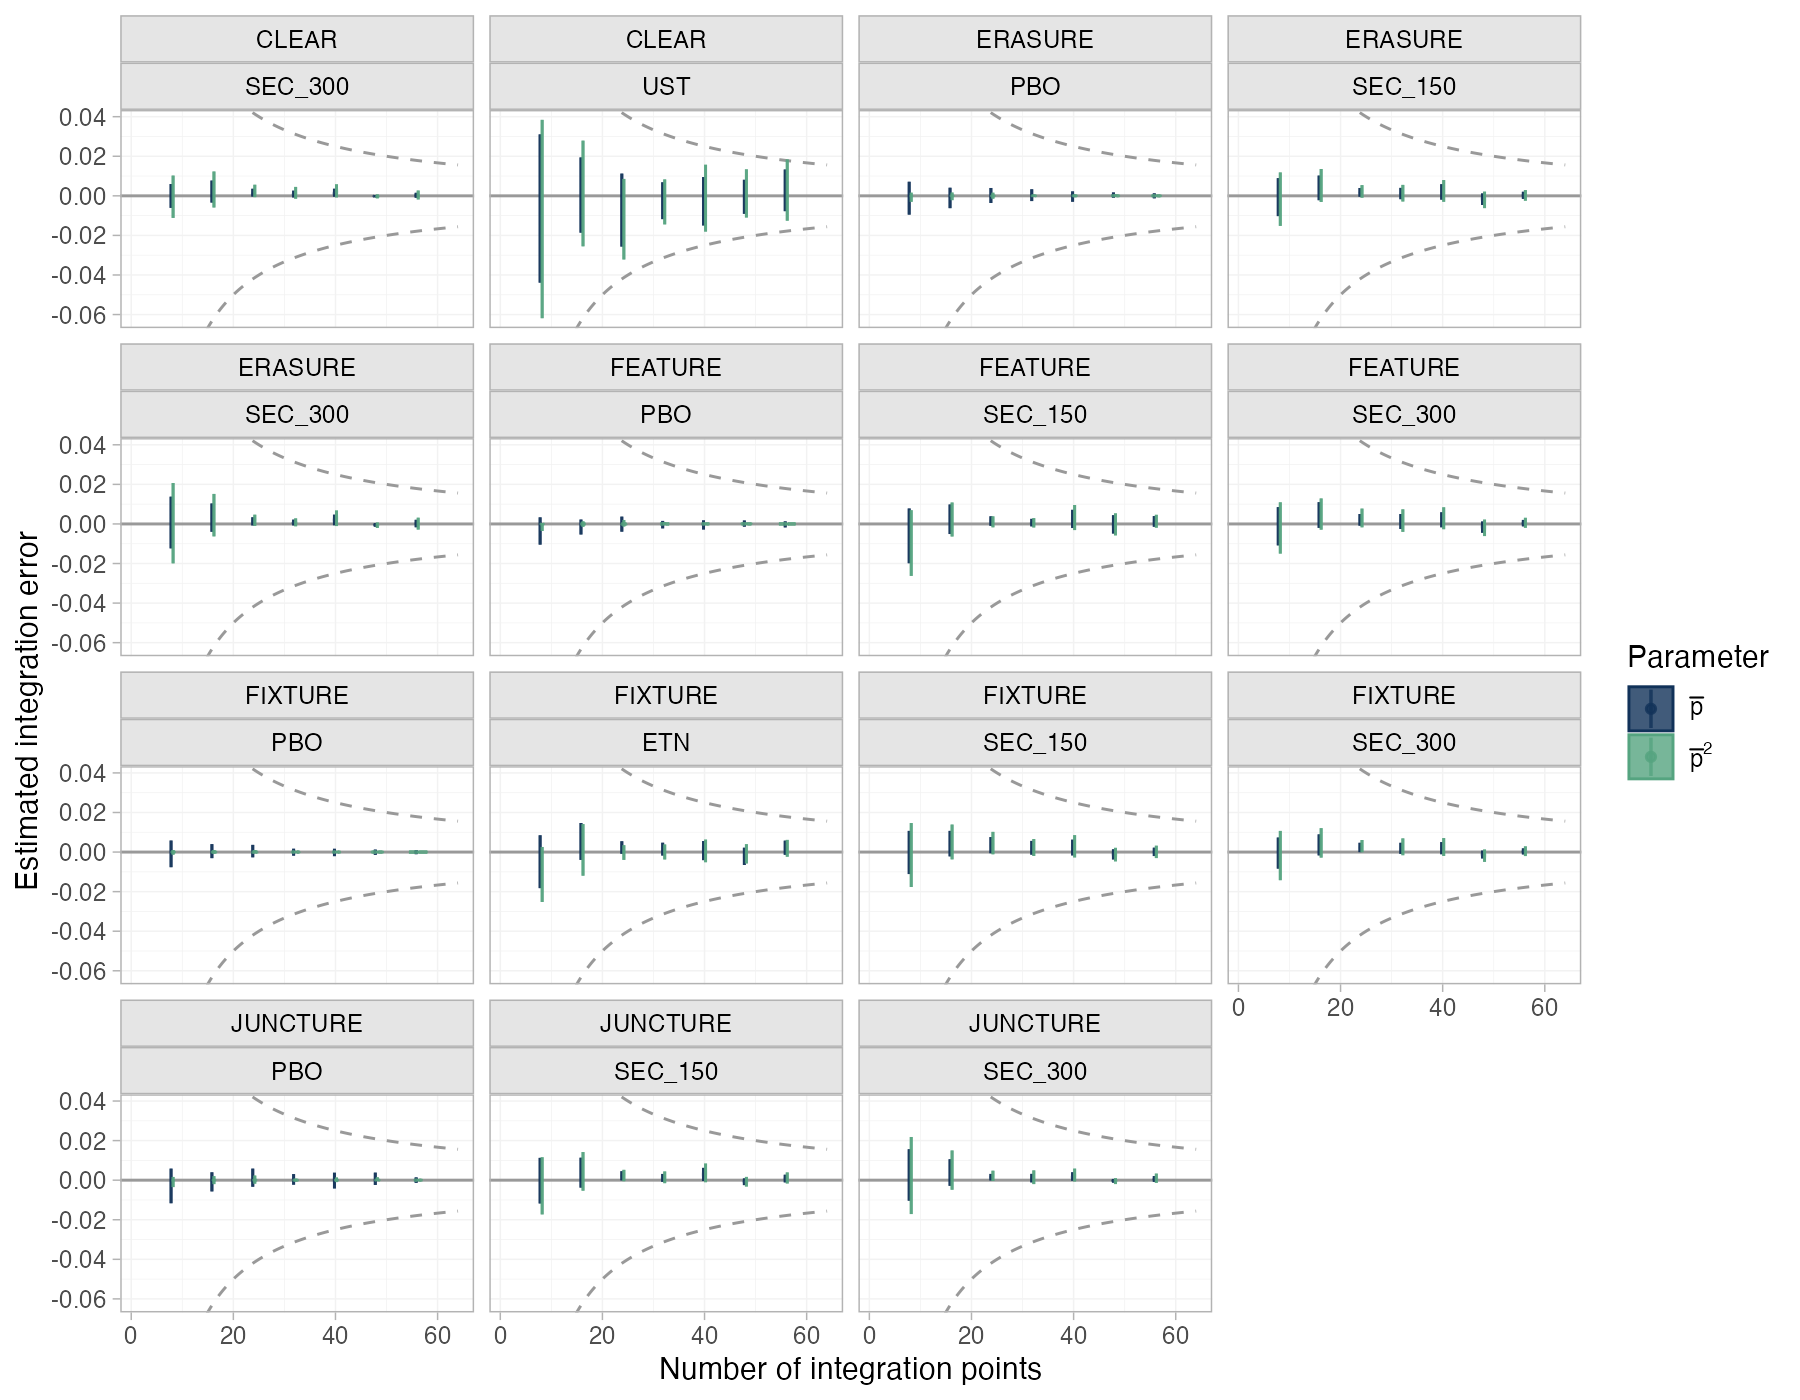
ML-NMR fits an individual-level model to aggregate studies by integrating it over each study’s covariate distribution, using quasi-Monte Carlo integration points. Too few points add numerical error that ordinary MCMC diagnostics cannot detect: the chains converge perfectly to the wrong answer. The integration error plot, one of the few diagnostics that is genuinely specific to one method, estimates that error by comparing the integral from the first \(n\) points with the integral from all of them, across the posterior.
How to read it
- Panels: aggregate-data study arms.
- Horizontal axis: number of integration points used.
- Vertical axis: estimated error relative to the final integral.
- Violins: posterior distribution of the error.
- Dashed curves: the expected \(1/N\) rate of quasi-Monte Carlo convergence.
Interpretation
Errors are largest with 8 points and shrink quickly toward zero, staying within the expected convergence envelope in every arm. By 64 points they are negligible for all arms, including the ustekinumab arm of CLEAR, which has the largest early errors. The number of integration points is adequate.
Pitfalls
- The model must be refitted with
int_thin > 0andint_check = FALSEto save the partial integrals. - Errors should be judged against the posterior uncertainty of the quantities of interest, not in isolation.
- More covariates, or skewed and correlated covariate distributions, need more points.
Code
Shared model (R/models/plaque-psoriasis-mlnmr.R)
# ML-NMR of PASI 75 response in plaque psoriasis (Phillippo et al. 2020):
# IPD from 4 ixekizumab trials, aggregate data from 5 secukinumab trials.
library(multinma)
library(dplyr)

trt_class <- function(trtc) case_when(
  trtc == "PBO" ~ "Placebo",
  trtc %in% c("IXE_Q2W", "IXE_Q4W", "SEC_150", "SEC_300") ~ "IL-17 blocker",
  trtc == "ETN" ~ "TNFa blocker",
  trtc == "UST" ~ "IL-12/23 blocker"
)

# Rescale covariates: BSA as a proportion, weight in 10 kg, duration in decades
pso_ipd <- plaque_psoriasis_ipd |>
  mutate(bsa = bsa / 100, weight = weight / 10, durnpso = durnpso / 10,
         prevsys = as.numeric(prevsys), psa = as.numeric(psa),
         trtclass = trt_class(trtc)) |>
  filter(complete.cases(durnpso, prevsys, bsa, weight, psa, pasi75))
pso_agd <- plaque_psoriasis_agd |>
  mutate(bsa_mean = bsa_mean / 100, bsa_sd = bsa_sd / 100,
         weight_mean = weight_mean / 10, weight_sd = weight_sd / 10,
         durnpso_mean = durnpso_mean / 10, durnpso_sd = durnpso_sd / 10,
         prevsys = prevsys / 100, psa = psa / 100,
         trtclass = trt_class(trtc))

pso_net <- combine_network(
  set_ipd(pso_ipd, study = studyc, trt = trtc, r = pasi75, trt_class = trtclass),
  set_agd_arm(pso_agd, study = studyc, trt = trtc, r = pasi75_r, n = pasi75_n,
              trt_class = trtclass),
  trt_ref = "PBO"
)

# Quasi-Monte Carlo integration points over each aggregate study's covariates
pso_net <- add_integration(pso_net,
  durnpso = distr(qgamma, mean = durnpso_mean, sd = durnpso_sd),
  prevsys = distr(qbern, prob = prevsys),
  bsa = distr(qlogitnorm, mean = bsa_mean, sd = bsa_sd),
  weight = distr(qgamma, mean = weight_mean, sd = weight_sd),
  psa = distr(qbern, prob = psa),
  n_int = 64
)

# Fixed-effect ML-NMR, probit link, effect modifiers shared within treatment class
pso_fit <- nma(pso_net, trt_effects = "fixed", link = "probit", likelihood = "bernoulli2",
               regression = ~ (durnpso + prevsys + bsa + weight + psa) * .trt,
               class_interactions = "common",
               prior_intercept = normal(scale = 10), prior_trt = normal(scale = 10),
               prior_reg = normal(scale = 10), init_r = 0.1, QR = TRUE, seed = 2026,
               int_thin = 8, int_check = FALSE)  # save partial integrals for the error plot
Figure
library(multinma)
source("R/models/plaque-psoriasis-mlnmr.R")  # builds pso_net and fits pso_fit

# Estimated error of the quasi-Monte Carlo integration over each aggregate
# study's covariate distribution, as the number of integration points grows
plot_integration_error(pso_fit, stat = "violin", show_expected_rate = TRUE)
References
- Phillippo DM, Dias S, Ades AE, et al. Multilevel network meta-regression for population-adjusted treatment comparisons. J R Stat Soc Ser A. 2020;183:1189-1210. doi:10.1111/rssa.12579
plot_integration_error()reference. multinma documentation. dmphillippo.github.io/multinma