Kaplan-Meier reconstruction check
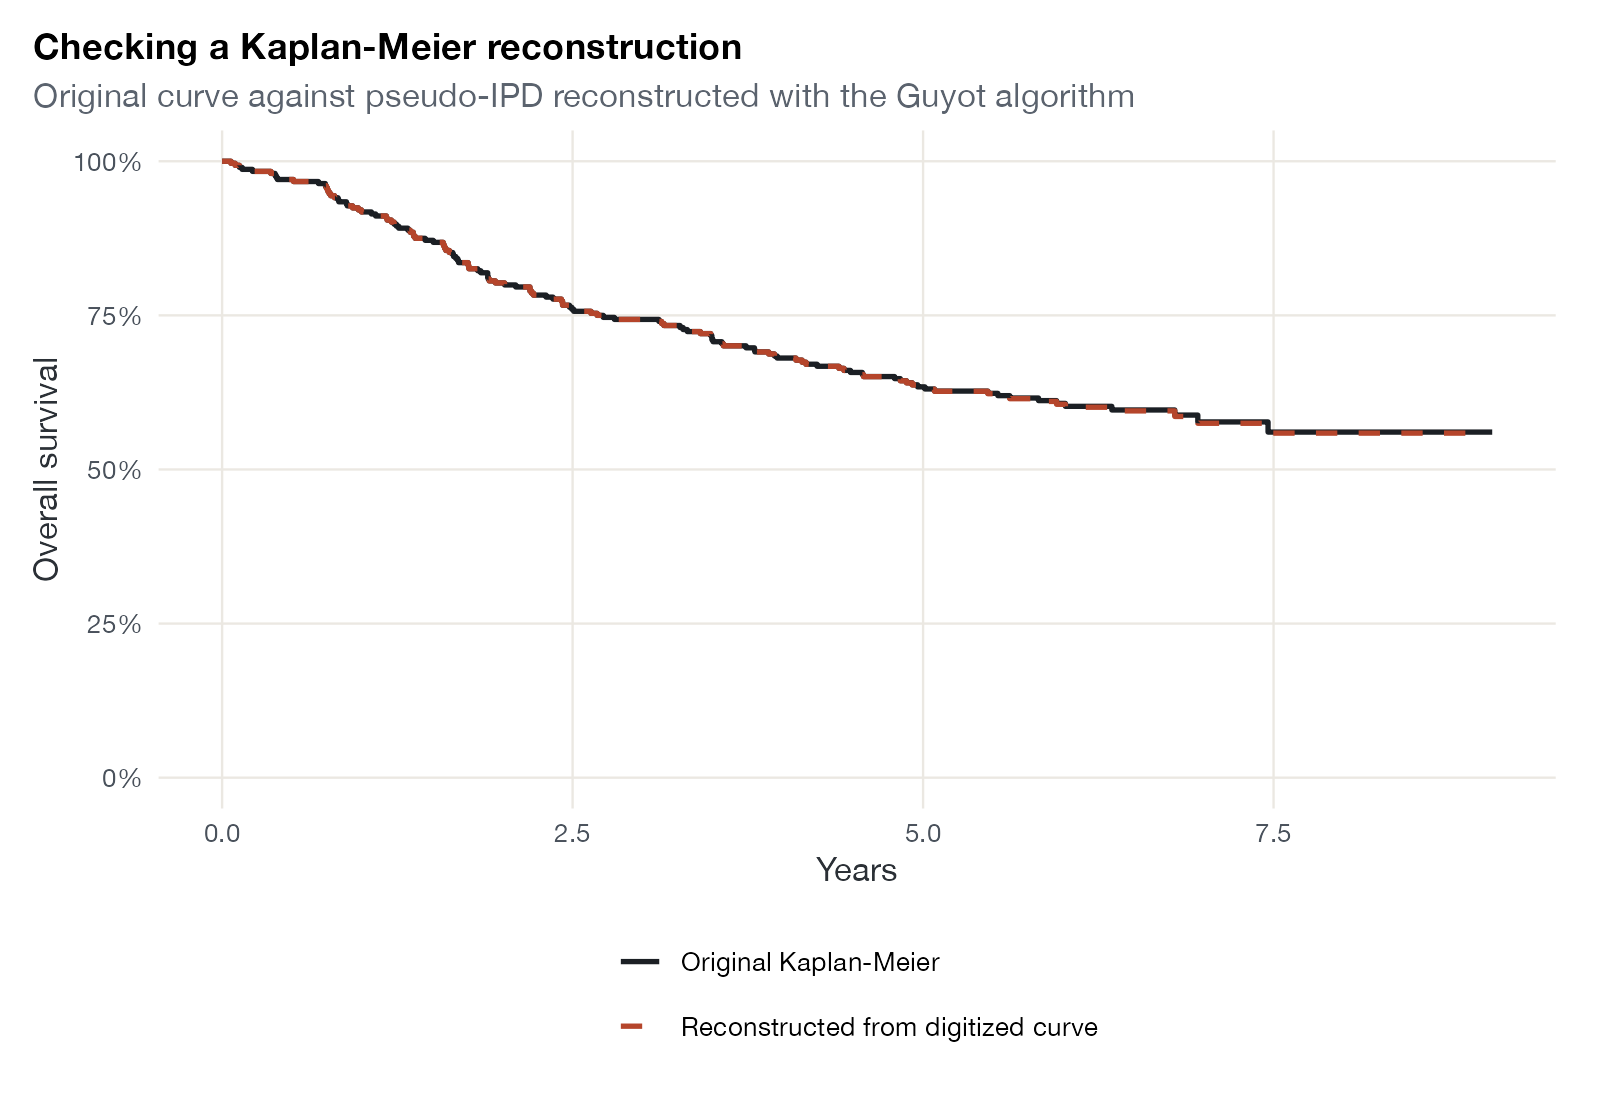
Digitized versus reconstructed survival curve
survival::colon.
IPDfromKM (shown), survHE::digitise(); Stata ipdfc
What it shows
Population-adjusted and survival syntheses often need patient-level survival data for a comparator that has only been published as a Kaplan-Meier curve. The Guyot algorithm reconstructs pseudo-IPD from digitized curve coordinates and the numbers at risk. Plotting the reconstructed Kaplan-Meier curve over the original, and comparing medians and hazard ratios where published, is the standard check that the reconstruction is faithful.
How to read it
- Solid curve: the original published curve (here, the true Kaplan-Meier from the trial data).
- Dashed curve: Kaplan-Meier estimate from the reconstructed pseudo-IPD.
- Agreement: the curves should overlap closely at every time.
Interpretation
With exact coordinates and a yearly risk table, the reconstruction is essentially perfect: the two curves overlap throughout, and 5-year survival (63%) is reproduced. Real digitization introduces error, particularly where the published curve is steep or the risk table sparse, so the check matters more in practice than here.
Pitfalls
- Reconstruction quality depends on the resolution of the digitized figure and on the numbers at risk; without a risk table, censoring must be assumed.
- Pseudo-IPD contain no covariates; they cannot support adjustment on their own.
- Report the reconstructed medians and hazard ratios against the published ones.
Code
library(survival)
library(IPDfromKM)
library(ggplot2)

# Start from a known Kaplan-Meier curve (colon cancer trial, levamisole + 5-FU)
data(colon, package = "survival")
arm <- subset(colon, etype == 2 & rx == "Lev+5FU")
km <- survfit(Surv(time / 365.25, status) ~ 1, data = arm)

# "Digitize" it: coordinates at the steps, plus numbers at risk every year,
# as would be read from a published figure
coords <- data.frame(time = km$time, surv = km$surv)
trisk <- 0:8
nrisk <- summary(km, times = trisk, extend = TRUE)$n.risk

# Guyot algorithm: reconstruct pseudo-IPD from the curve and risk table
prep <- preprocess(dat = coords, trisk = trisk, nrisk = nrisk, maxy = 1)
ipd <- getIPD(prep = prep, armID = 1)$IPD
rec <- survfit(Surv(time, status) ~ 1, data = ipd)

curves <- rbind(
  data.frame(time = c(0, km$time), surv = c(1, km$surv), source = "Original Kaplan-Meier"),
  data.frame(time = c(0, rec$time), surv = c(1, rec$surv), source = "Reconstructed from digitized curve")
)
ggplot(curves, aes(time, surv, colour = source, linetype = source)) +
  geom_step(linewidth = 0.9) +
  scale_colour_manual(values = c("#1b1f24", "#b5452b"), name = NULL) +
  scale_linetype_manual(values = c("solid", "dashed"), name = NULL) +
  scale_y_continuous(labels = scales::percent, limits = c(0, 1)) +
  labs(x = "Years", y = "Overall survival",
       title = "Checking a Kaplan-Meier reconstruction",
       subtitle = "Original curve against pseudo-IPD reconstructed with the Guyot algorithm") +
  guides(colour = guide_legend(ncol = 1))
References
- Guyot P, Ades AE, Ouwens MJNM, Welton NJ. Enhanced secondary analysis of survival data: reconstructing the data from published Kaplan-Meier survival curves. BMC Med Res Methodol. 2012;12:9. doi:10.1186/1471-2288-12-9
- Liu N, Zhou Y, Lee JJ. IPDfromKM: reconstruct individual patient data from published Kaplan-Meier survival curves. BMC Med Res Methodol. 2021;21:111. doi:10.1186/s12874-021-01308-8