PET-PEESE plot
Precision-effect regression plot, Egger regression plot
metadat::dat.hackshaw1998.
metafor::rma(mods = ~ sei), custom ggplot2; Stata meta regress _se
What it shows
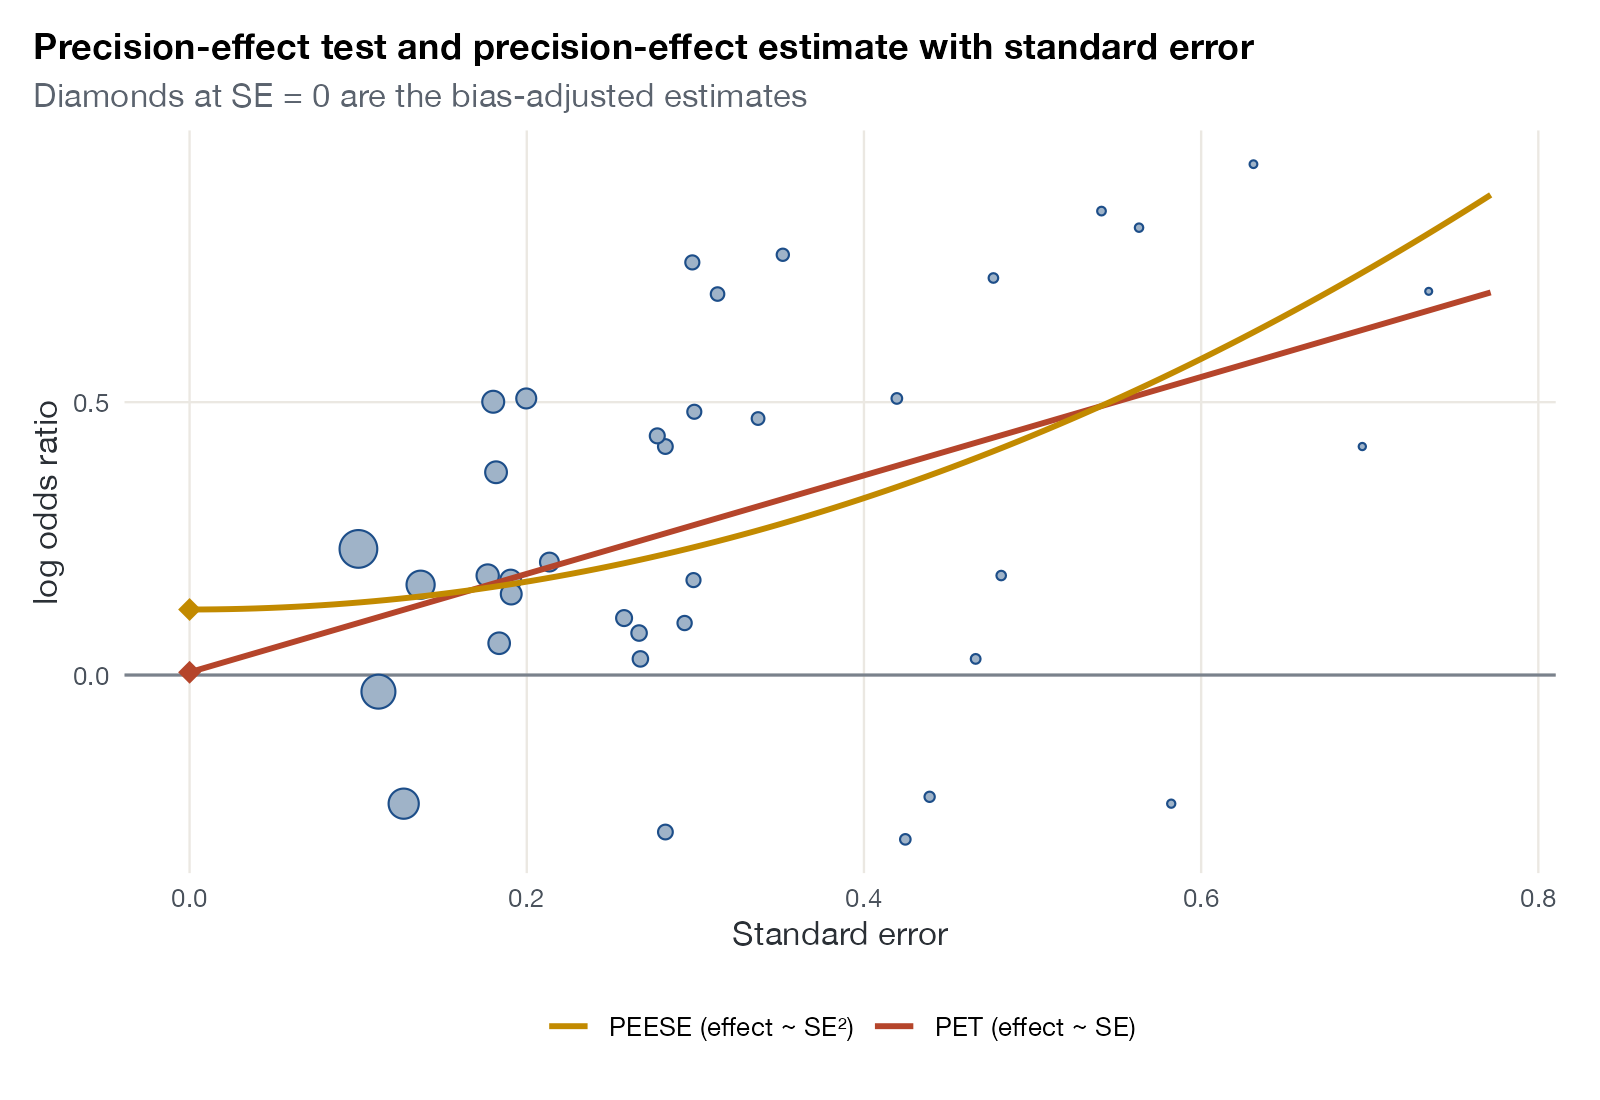
If small studies report larger effects, the effect estimate is correlated with its standard error. Regressing the effects on the standard error (the precision-effect test, PET, closely related to Egger’s test) and extrapolating to a standard error of zero estimates what an infinitely large study would show. Because PET is biased downward when a true effect exists, Stanley and Doucouliagos proposed using the regression on the variance (PEESE) when PET indicates a nonzero effect. The plot makes both regressions and their intercepts visible.
How to read it
- Horizontal axis: standard error, so the most precise studies are on the left.
- Vertical axis: effect estimate.
- Bubbles: studies, sized by inverse variance.
- Lines: weighted linear fits of effect on SE (PET) and on SE² (PEESE).
- Diamonds at SE = 0: adjusted estimates.
Interpretation
Both lines slope upward: less precise studies report larger odds ratios. The PET intercept is an odds ratio of 1.01 (\(p = 0.95\)), so PET finds no effect remaining at infinite precision; the conditional rule would then report PET rather than PEESE. PEESE gives 1.13 (95% CI 1.03 to 1.24). The two bracket a plausible range but disagree on whether any association remains.
Pitfalls
- The intercept is an extrapolation beyond the observed studies; with few precise studies it is very uncertain.
- Heterogeneity correlated with study size produces the same slope as publication bias.
- PET-PEESE performs poorly with high heterogeneity and small numbers of studies in simulations.
- For odds ratios the estimate and its standard error are mathematically correlated, which biases the regression.
Code
library(metafor)
library(ggplot2)

data(dat.hackshaw1998, package = "metadat")
dat <- dat.hackshaw1998
dat$sei <- sqrt(dat$vi)

# PET: weighted regression of effect on SE; PEESE: on SE^2.
# The intercept (SE = 0) estimates the effect of an infinitely precise study.
pet <- rma(yi, vi, mods = ~ sei, data = dat, method = "FE")
peese <- rma(yi, vi, mods = ~ vi, data = dat, method = "FE")

grid <- data.frame(sei = seq(0, max(dat$sei) * 1.05, length.out = 100))
grid$pet <- coef(pet)[1] + coef(pet)[2] * grid$sei
grid$peese <- coef(peese)[1] + coef(peese)[2] * grid$sei^2

ggplot(dat, aes(x = sei, y = yi)) +
  geom_hline(yintercept = 0, colour = "#7a828c") +
  geom_point(aes(size = 1 / vi), shape = 21, fill = "#9fb3c8", colour = "#1d4e89") +
  geom_line(data = grid, aes(y = pet, colour = "PET (effect ~ SE)"), linewidth = 1) +
  geom_line(data = grid, aes(y = peese, colour = "PEESE (effect ~ SE²)"), linewidth = 1) +
  annotate("point", x = 0, y = coef(pet)[1], colour = "#b5452b", size = 3.5, shape = 18) +
  annotate("point", x = 0, y = coef(peese)[1], colour = "#c28a00", size = 3.5, shape = 18) +
  scale_colour_manual(values = c("PET (effect ~ SE)" = "#b5452b",
                                 "PEESE (effect ~ SE²)" = "#c28a00"), name = NULL) +
  scale_size_area(max_size = 6, guide = "none") +
  labs(x = "Standard error", y = "log odds ratio",
       title = "Precision-effect test and precision-effect estimate with standard error",
       subtitle = "Diamonds at SE = 0 are the bias-adjusted estimates")
meta set yi sei
meta regress _meta_se, fixed // PET
generate var = sei^2
meta regress var, fixed // PEESEReferences
- Stanley TD, Doucouliagos H. Meta-regression approximations to reduce publication selection bias. Res Synth Methods. 2014;5:60-78. doi:10.1002/jrsm.1095
- Egger M, Davey Smith G, Schneider M, Minder C. Bias in meta-analysis detected by a simple, graphical test. BMJ. 1997;315:629-634. doi:10.1136/bmj.315.7109.629
- Moreno SG, Sutton AJ, Ades AE, et al. Assessment of regression-based methods to adjust for publication bias through a comprehensive simulation study. BMC Med Res Methodol. 2009;9:2. doi:10.1186/1471-2288-9-2