P-score plot
Ranking score dot plot, multi-outcome ranking heat plot
netmeta::Linde2015.
netmeta::plot.netrank(), rankinma::PlotHeat()
What it shows
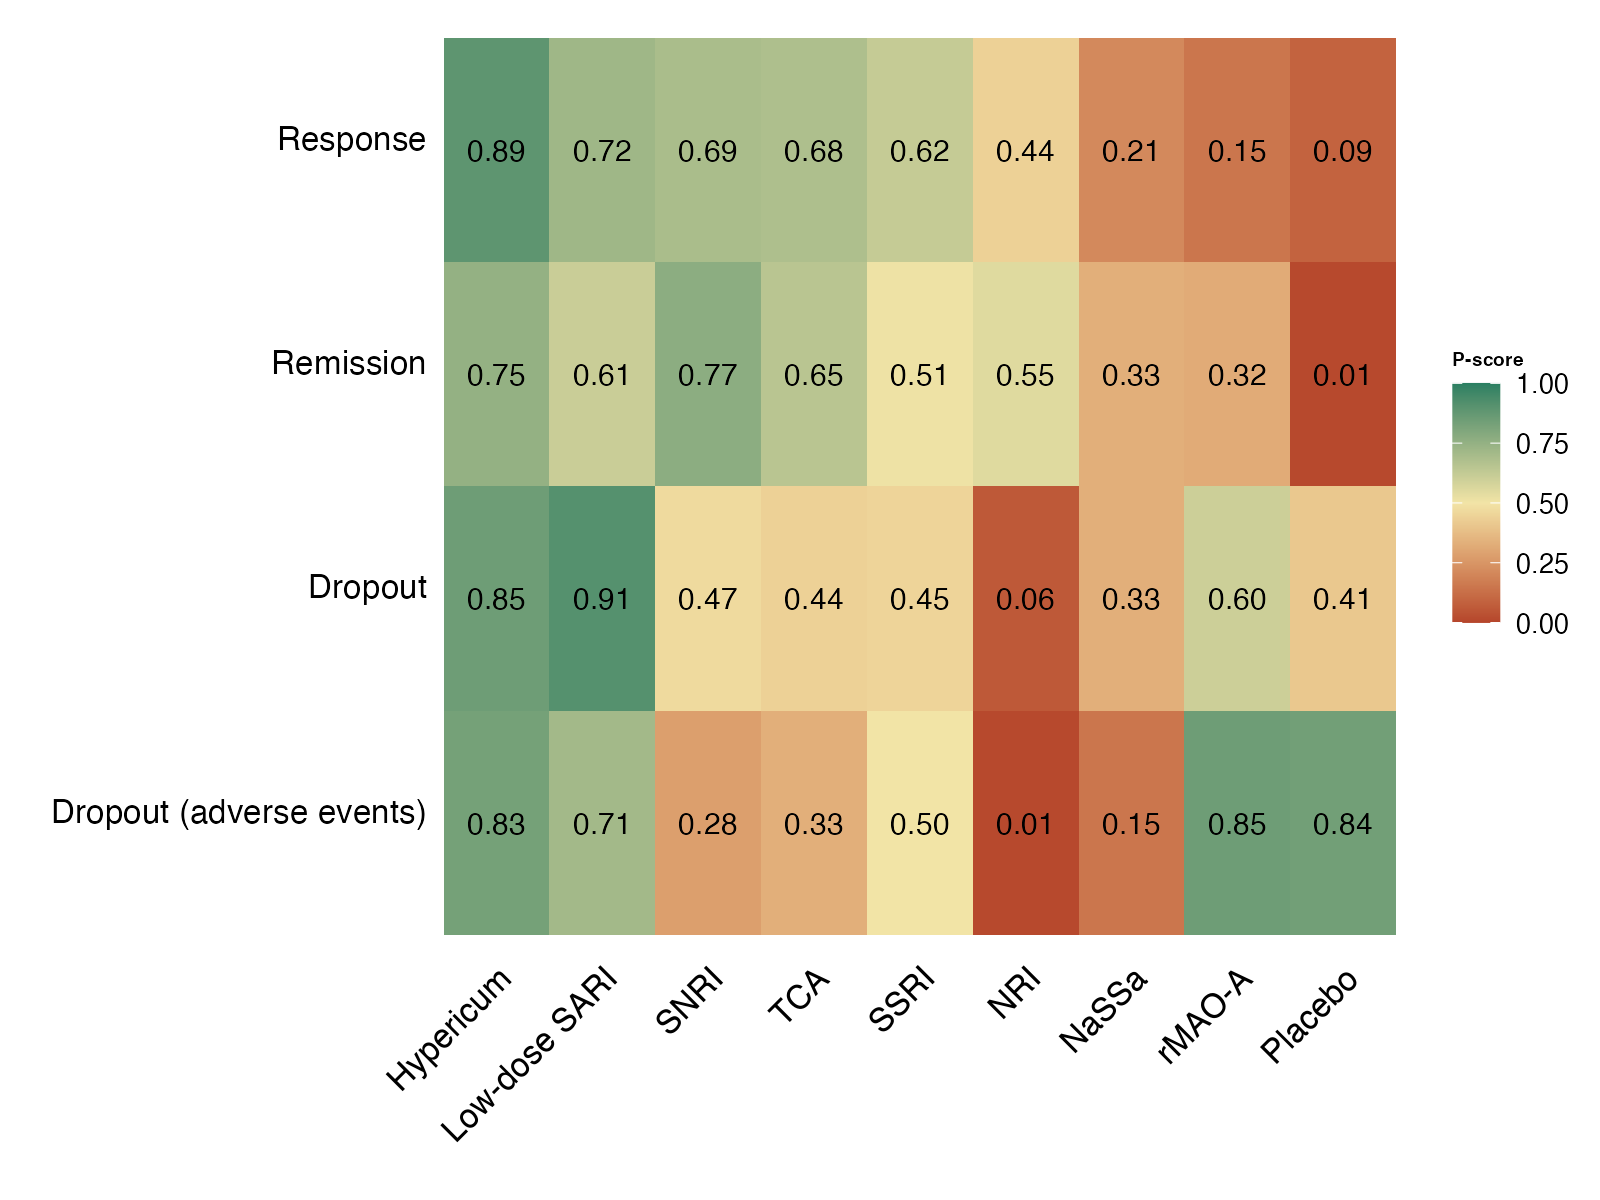
The P-score (Rücker and Schwarzer) is the frequentist analogue of SUCRA: the mean certainty that a treatment is better than the others, computed from the network estimates and their standard errors without resampling. Plotting P-scores for several outcomes side by side shows at a glance which treatments do well on benefits and which on harms.
How to read it
- Rows: treatments; columns: outcomes.
- Numbers and colors: P-scores from 0 (worst) to 1 (best), oriented so that higher is always better.
Interpretation
Hypericum and low-dose SARI score highly on response and on both dropout outcomes, so they look attractive for efficacy and acceptability. NRI ranks mid-table for response but last for dropout. Placebo ranks bottom for response, as expected, but mid-table for dropout. Rankings that conflict across outcomes are exactly the situation that a Hasse diagram or clustered ranking plot handles more honestly.
Pitfalls
- The same caveats as SUCRA: no effect sizes, dependence on the set of treatments.
- Colors can make near-ties look like large differences.
Code
library(netmeta)

# Antidepressants in primary care (Linde et al. 2015): arm-level binary outcomes
data(Linde2015)
d <- Linde2015
nma_for <- function(v, small) {
  p <- pairwise(treat = list(d$treatment1, d$treatment2, d$treatment3),
                event = list(d[[paste0(v, 1)]], d[[paste0(v, 2)]], d[[paste0(v, 3)]]),
                n = list(d$n1, d$n2, d$n3), studlab = d$id, sm = "OR", allstudies = TRUE)
  netmeta(p, common = FALSE, reference.group = "Placebo", small.values = small)
}

resp <- nma_for("resp", small = "undesirable")
remi <- nma_for("remi", small = "undesirable")
loss <- nma_for("loss", small = "desirable")
lossae <- nma_for("loss.ae", small = "desirable")

# P-scores for four outcomes side by side
plot(netrank(resp), netrank(remi), netrank(loss), netrank(lossae),
     name = c("Response", "Remission", "Dropout", "Dropout (adverse events)"),
     digits = 2, low = "#b5452b", mid = "#f2e4a6", high = "#2a7f62",
     main.legend = "P-score")
References
- Rücker G, Schwarzer G. Ranking treatments in frequentist network meta-analysis works without resampling methods. BMC Med Res Methodol. 2015;15:58. doi:10.1186/s12874-015-0060-8
- Linde K, Kriston L, Rücker G, et al. Efficacy and acceptability of pharmacological treatments for depressive disorders in primary care: systematic review and network meta-analysis. Ann Fam Med. 2015;13:69-79. doi:10.1370/afm.1687