Local inconsistency scatter plot
Bland-Altman plot of direct and indirect evidence
netmeta::Senn2013.
netmeta::plot.netsplit() (netmeta 3.5-0 and later)
What it shows
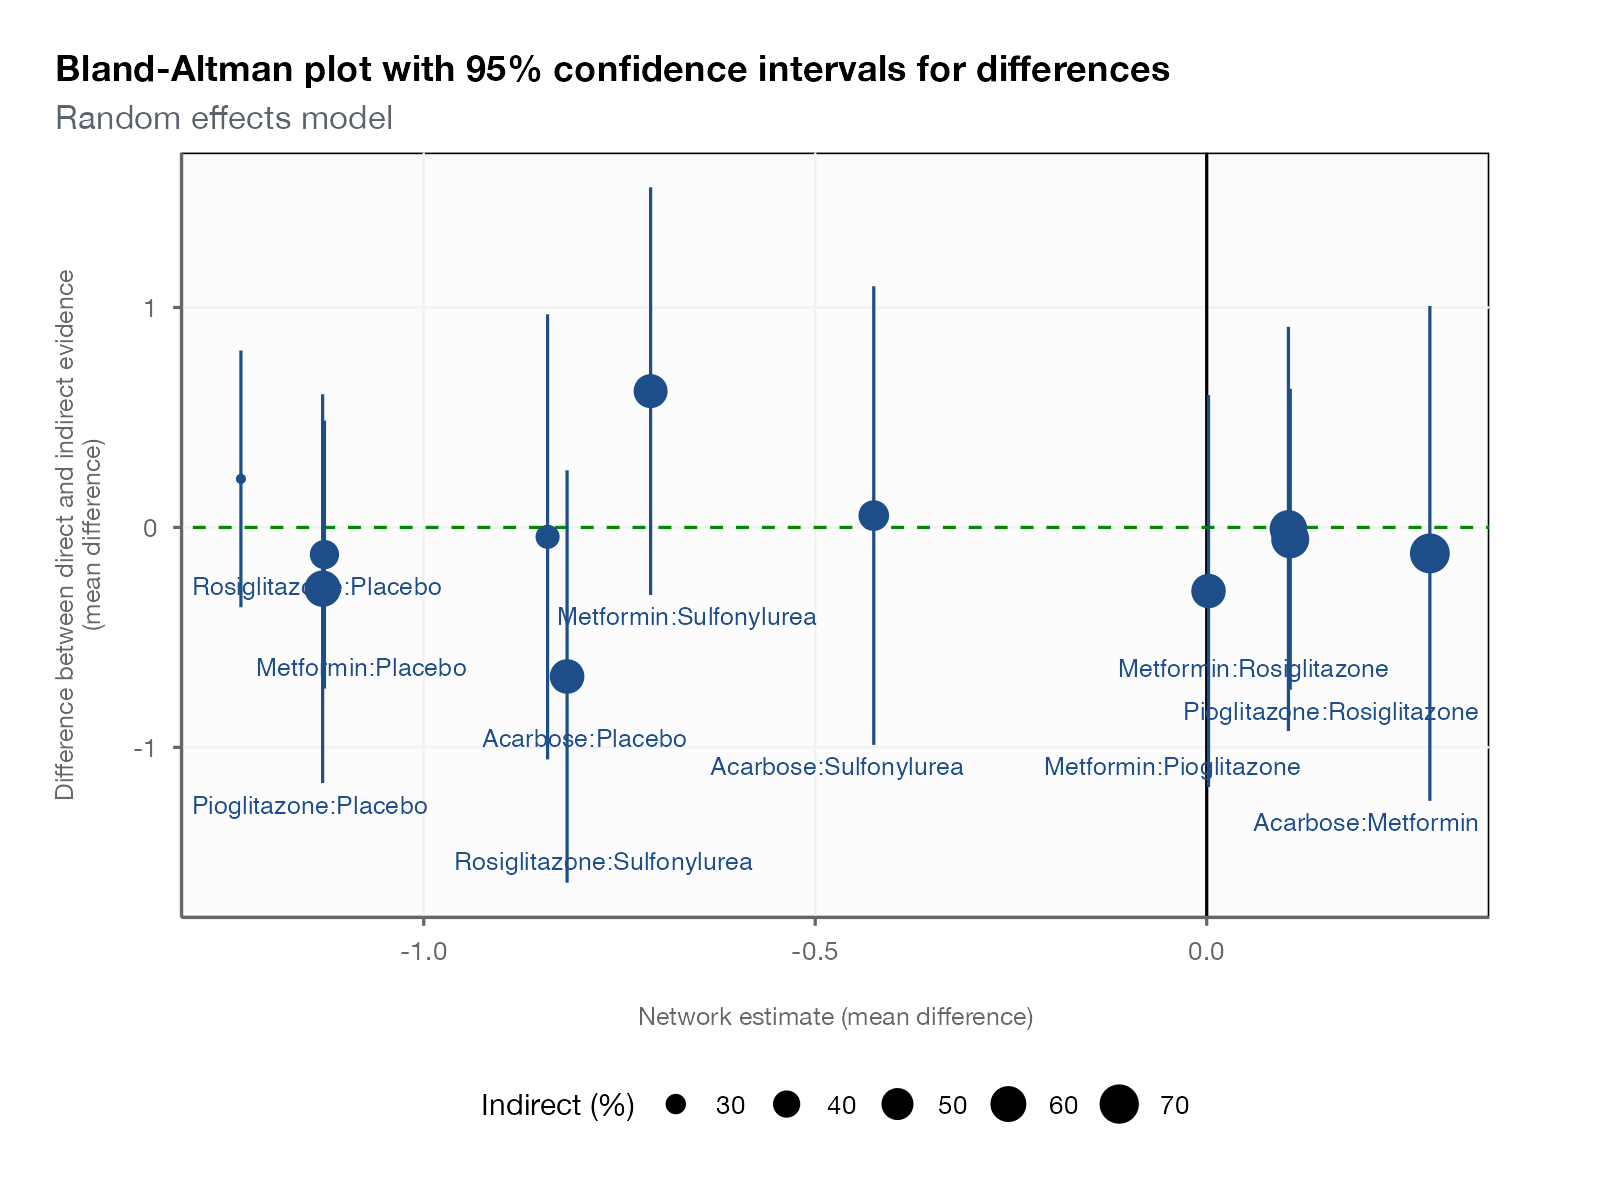
When a network has many comparisons, a node-splitting forest plot becomes long. This compact alternative, added in netmeta 3.5-0 to implement the method of Wilson and colleagues (2026), draws each split comparison as one point: the horizontal position is the network estimate and the vertical position is the difference between direct and indirect evidence, with its confidence interval. Points far from the zero line, with intervals that exclude it, are the local inconsistencies that deserve attention.
How to read it
- Horizontal axis: network estimate for the comparison.
- Vertical axis: direct minus indirect estimate; zero means agreement.
- Vertical lines: 95% confidence intervals of the difference.
- Point size: proportion of indirect evidence.
- Color: significant inconsistency (red) versus not (default color).
Interpretation
Every interval crosses zero, so no comparison shows statistically significant local inconsistency. Metformin versus sulfonylurea and rosiglitazone versus sulfonylurea have the largest differences (about +0.6 and −0.7) but also the widest intervals, the pattern seen in the node-splitting forest plot.
Pitfalls
- Same caveats as node splitting: low power and multiplicity.
- The horizontal axis mixes comparisons on the same scale only if the outcome and orientation are comparable.
- This display is new; conventions for its axes and highlighting may still change.
Code
library(netmeta)

data(Senn2013)

net <- netmeta(
  TE, seTE, treat1.long, treat2.long, studlab,
  data = Senn2013, sm = "MD",
  common = FALSE, reference.group = "Placebo"
)

# Bland-Altman type scatter of direct versus indirect estimates: difference
# (direct minus indirect) against their mean, one point per comparison;
# red points show significant local inconsistency
ns <- netsplit(net)
plot(ns, col = "#1d4e89", col.inc = "#b5452b", size.labels = 3.2)
References
- Balduzzi S, Rücker G, Nikolakopoulou A, et al. netmeta: an R package for network meta-analysis using frequentist methods. J Stat Softw. 2023;106(2):1-40. doi:10.18637/jss.v106.i02
- netmeta package, current CRAN release. cran.r-project.org/package=netmeta