Dose-response NMA plot
Model-based NMA dose-response curves
NMA
Fitted dose-response curves for several agents from a model-based network meta-analysis.
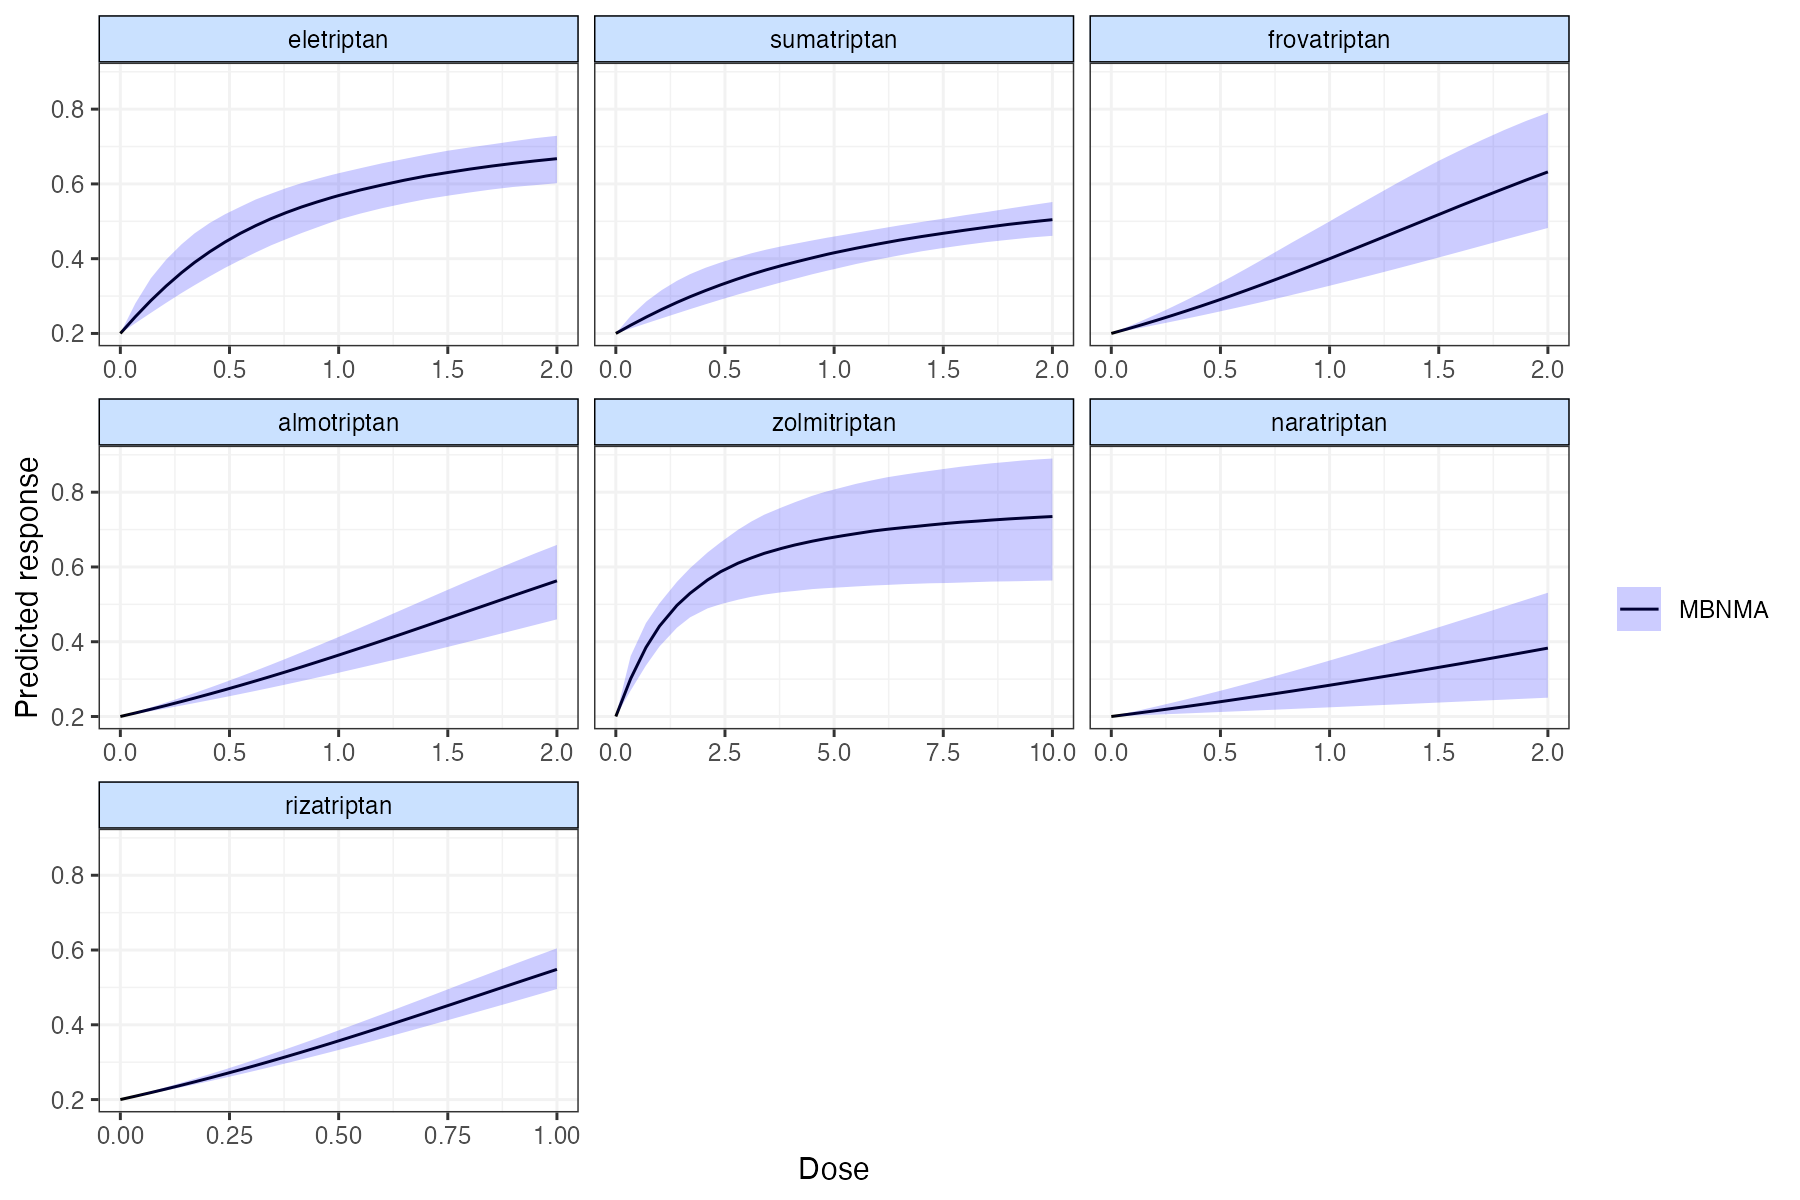
Predicted probability of headache relief at 2 hours by dose for seven triptans, from a random-effects model-based NMA with an Emax dose-response function, assuming a placebo response of 20%. Data:
MBNMAdose::triptans.
Family
Component, dose-response, and threshold NMA
Purpose
Compare agents across their dose ranges while borrowing strength across doses.
Inputs
Arm-level data with agent and dose for each arm.
Software
R
MBNMAdose (JAGS); multinma with dose models
What it shows
Treating every agent-dose combination as a separate node fragments a network. Model-based NMA (Mawdsley and colleagues; Pedder and colleagues) instead fits a dose-response function, such as Emax, for each agent, connecting doses within agents and agents through the network. The plot shows each agent’s fitted curve with credible intervals across its dose range.
How to read it
- Panels: agents.
- Horizontal axis: dose (in agent-specific units, often standardized).
- Vertical axis: predicted outcome, given an assumed placebo response.
- Curve and band: posterior median and 95% credible interval.
Interpretation
Eletriptan and zolmitriptan rise steeply and plateau, the classic Emax shape: higher doses add little. Sumatriptan and naratriptan rise more slowly within their licensed ranges. Frovatriptan and almotriptan curves are nearly linear because the data do not reach their plateaus.
Pitfalls
- The chosen dose-response function is an assumption; compare functions (Emax, exponential, splines) by fit.
- Extrapolation beyond the studied dose range is not supported.
- Absolute predictions depend on the assumed placebo response.
Code
library(MBNMAdose)

# Triptans for migraine: headache relief at 2 hours, several agents and doses
network <- mbnma.network(triptans)

# Model-based NMA with an Emax dose-response function for each agent
fit <- mbnma.run(network, fun = demax(), method = "random", n.iter = 4000,
                 jags.seed = 2026)

# Fitted dose-response curves with 95% credible intervals, one panel per agent
pred <- predict(fit, E0 = 0.2)
plot(pred, overlay.split = FALSE, method = "common")
References
- Mawdsley D, Bennetts M, Dias S, Boucher M, Welton NJ. Model-based network meta-analysis: a framework for evidence synthesis of clinical trial data. CPT Pharmacometrics Syst Pharmacol. 2016;5:393-401. doi:10.1002/psp4.12091
- Pedder H, Dias S, Bennetts M, Boucher M, Welton NJ. Joining the dots: linking disconnected networks of evidence using dose-response model-based network meta-analysis. Med Decis Making. 2021;41:194-208. doi:10.1177/0272989X20983315