NMA forest plot
Network forest plot versus a common comparator
netmeta::Senn2013.
netmeta::forest(), multinma::plot(relative_effects()), gemtc::forest(); Stata network forest
What it shows
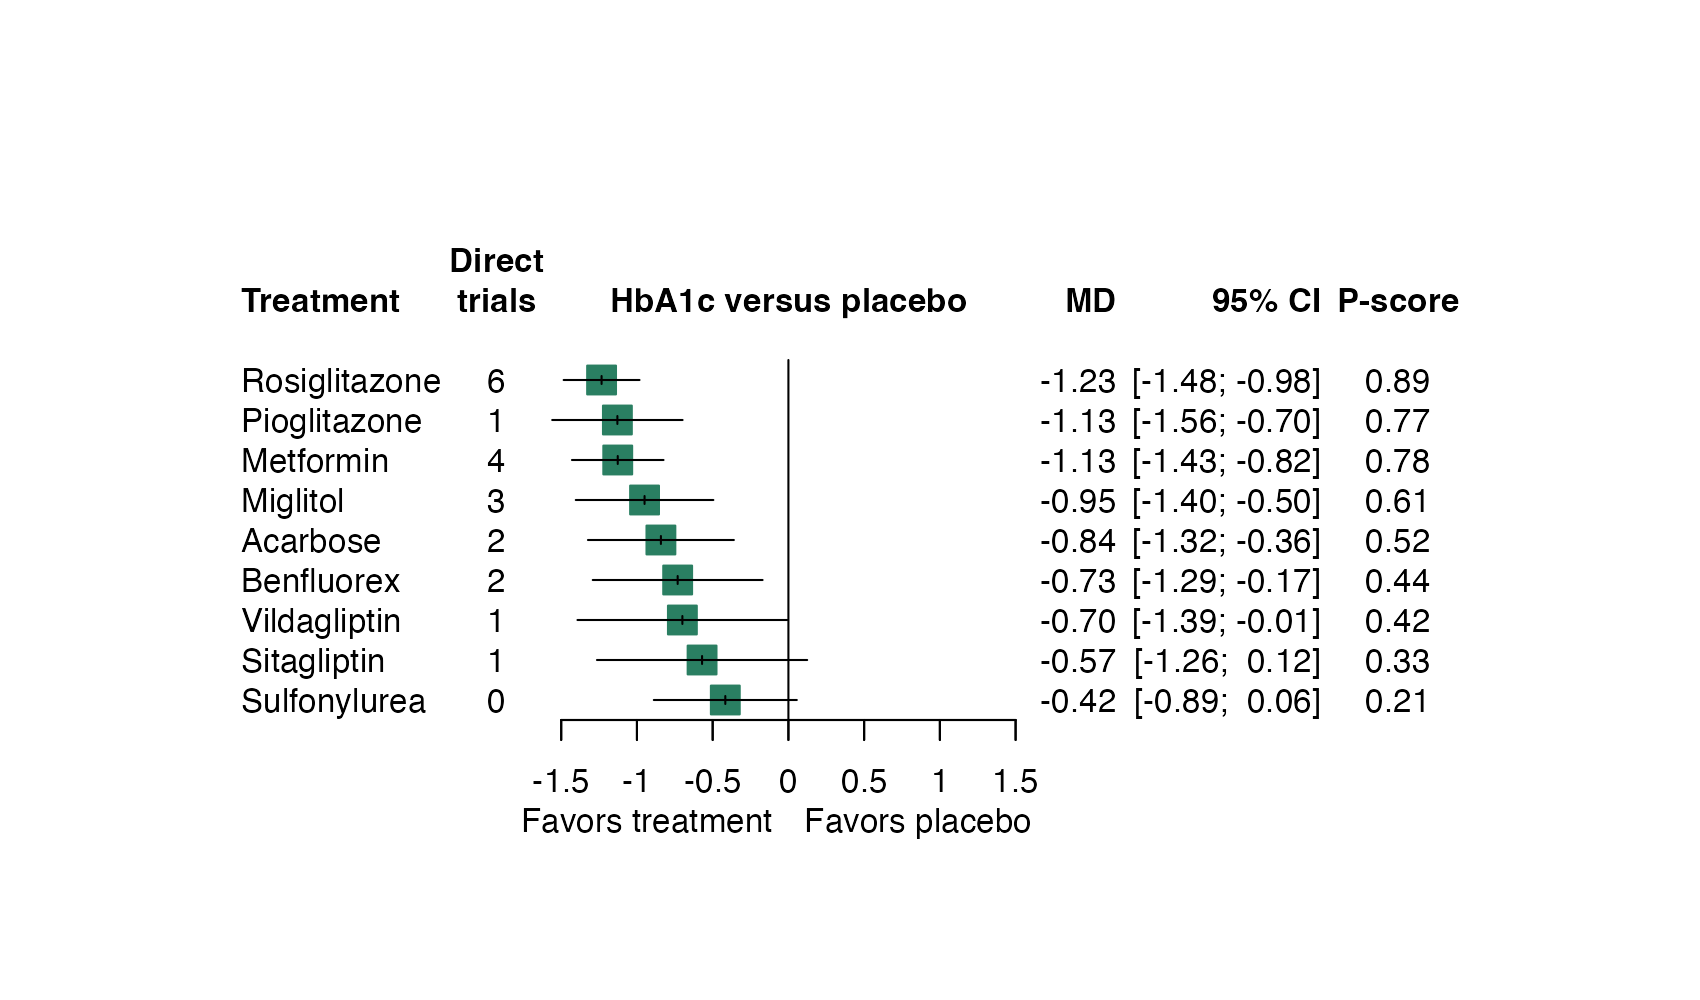
The NMA forest plot shows one row per treatment: the network estimate of that treatment against a common reference (usually placebo or standard care). Each estimate combines direct and indirect evidence. Extra columns often report how much direct evidence exists and a ranking summary. It is the most common headline figure of a network meta-analysis.
How to read it
- Rows: treatments, here sorted by effect.
- Squares and whiskers: network estimate and 95% confidence interval versus the reference.
- Direct trials: number of studies comparing that treatment directly with the reference; zero means the estimate is entirely indirect.
- P-score: frequentist analogue of SUCRA, from 0 (certainly worst) to 1 (certainly best).
Interpretation
Every drug lowers HbA1c relative to placebo; rosiglitazone, pioglitazone, and metformin by more than one percentage point. Sulfonylurea has no direct placebo-controlled trial in this network, so its estimate is entirely indirect, and its interval includes zero. The between-study standard deviation is 0.33 and \(I^2 = 81\%\), so the ordering of the top three drugs is fragile.
Pitfalls
- Comparisons against the reference say nothing directly about comparisons between active drugs; use a league table or interval plot.
- The choice of reference changes the appearance but not the model.
- Ranking columns invite over-interpretation; look at the overlap of intervals first.
- Report whether intervals are confidence, credible, or prediction intervals.
Code
library(netmeta)

# Glucose-lowering agents (Senn et al. 2013): HbA1c mean differences
data(Senn2013)

net <- netmeta(
  TE, seTE, treat1.long, treat2.long, studlab,
  data = Senn2013, sm = "MD",
  common = FALSE, reference.group = "Placebo"
)

# Network estimates of every treatment against placebo, with P-scores
forest(
  net,
  sortvar = TE,
  leftcols = c("studlab", "k"),
  leftlabs = c("Treatment", "Direct\ntrials"),
  rightcols = c("effect", "ci", "Pscore"),
  rightlabs = c("MD", "95% CI", "P-score"),
  smlab = "HbA1c versus placebo",
  label.left = "Favors treatment", label.right = "Favors placebo",
  col.square = "#2a7f62", col.square.lines = "#2a7f62"
)
network meta consistency
network forestReferences
- Rücker G. Network meta-analysis, electrical networks and graph theory. Res Synth Methods. 2012;3:312-324. doi:10.1002/jrsm.1058
- Senn S, Gavini F, Magrez D, Scheen A. Issues in performing a network meta-analysis. Stat Methods Med Res. 2013;22:169-189. doi:10.1177/0962280211432220
- Rücker G, Schwarzer G. Ranking treatments in frequentist network meta-analysis works without resampling methods. BMC Med Res Methodol. 2015;15:58. doi:10.1186/s12874-015-0060-8