Component NMA forest plot
Additive CNMA forest plot
NMA
Effects of complex interventions estimated from an additive component network meta-analysis, where each intervention’s effect is the sum of its components.
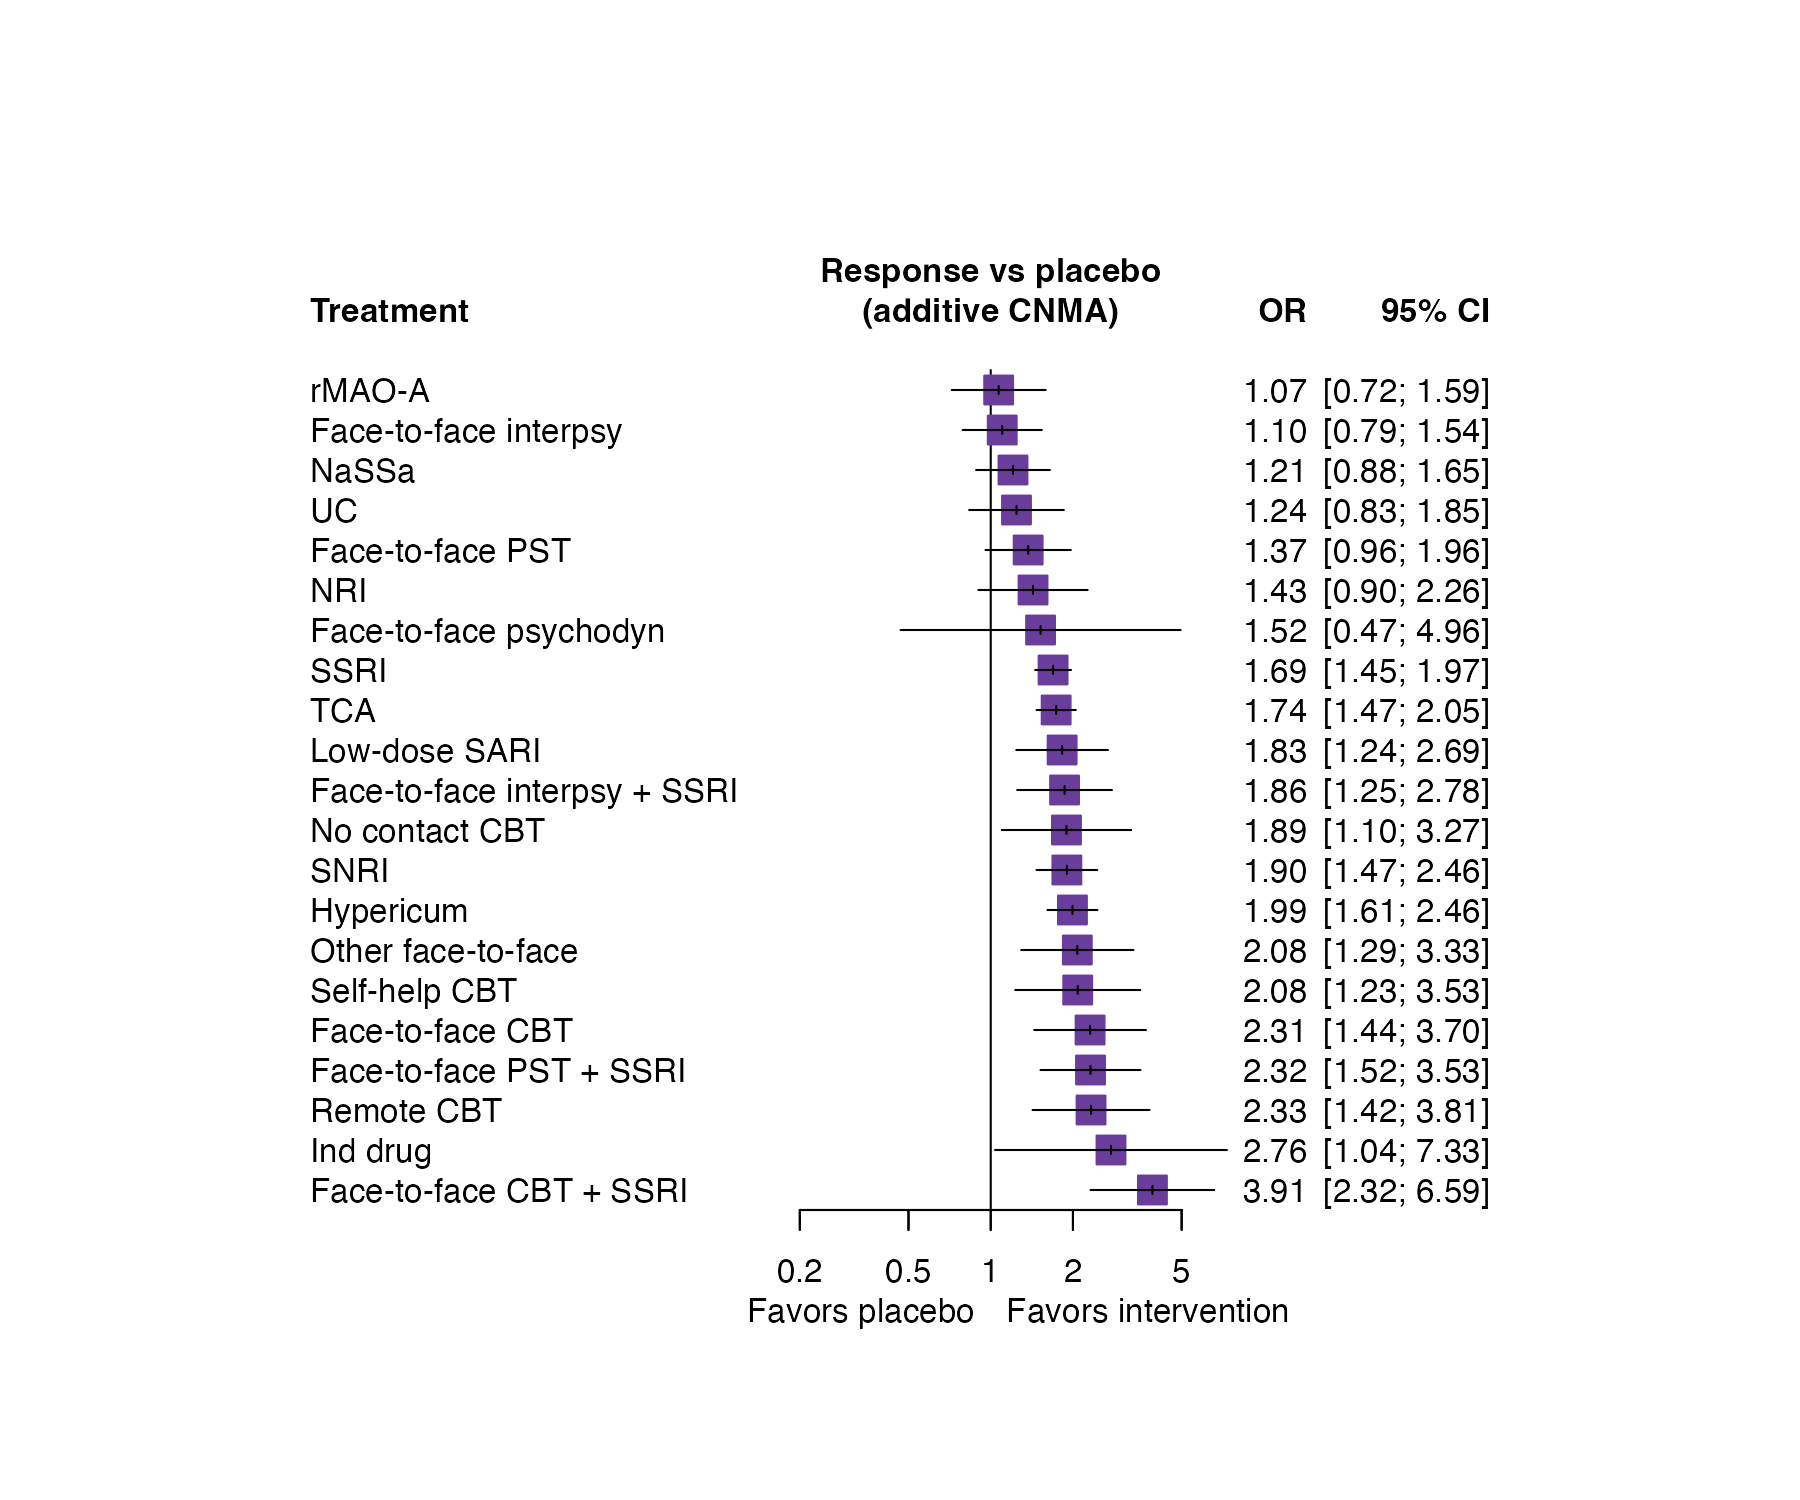
Additive component NMA of response in depression (Linde et al. 2016): odds ratios against placebo for 22 interventions, including combinations of psychological therapies with SSRIs, with placebo as the inactive component. Data:
netmeta::Linde2016.
Family
Component, dose-response, and threshold NMA
Purpose
Report effects of complex, multicomponent interventions, including combinations never tested directly.
Inputs
A network of interventions defined as combinations of components.
Software
R
netmeta::netcomb() + forest(), viscomp; Bayesian CNMA in multinma or JAGS
What it shows
Many interventions are combinations of components (for example, a psychological therapy plus a drug). Component network meta-analysis (Welton and colleagues; Rücker and colleagues) models each intervention’s effect as the sum of its components’ effects, optionally with interactions. The forest plot shows the resulting effects for every intervention, including combinations whose components were studied separately but never together.
How to read it
- Rows: interventions, sorted by effect.
- Squares and whiskers: effect against the reference with 95% CI, from the additive model.
- Combinations: intervention names joined by
+; their effect is the sum of the component effects.
Interpretation
Face-to-face CBT combined with an SSRI has the largest estimated odds ratio for response (3.91, 95% CI 2.32 to 6.59), in line with the additive model: the effects of face-to-face CBT and SSRI (2.31 and 1.69) roughly multiply. Most single drug classes have odds ratios between 1.5 and 2.
Pitfalls
- Additivity is an assumption; test it against the standard NMA (for example with a Q statistic for the difference) and consider interaction terms.
- The inactive component (here placebo) must truly contribute nothing.
- Effects for combinations never observed are extrapolations from the additive model.
Code
library(netmeta)

# Depression in primary care (Linde et al. 2016): drug, psychological, and
# combined interventions
data(Linde2016)
net <- netmeta(lnOR, selnOR, treat1, treat2, id, data = Linde2016,
               sm = "OR", common = FALSE, reference.group = "Placebo")

# Additive component NMA: each intervention's effect is the sum of the
# effects of its components (placebo as the inactive treatment)
cnma <- netcomb(net, inactive = "Placebo")
forest(cnma, sortvar = TE, col.square = "#6a3d9a", col.square.lines = "#6a3d9a",
       smlab = "Response vs placebo\n(additive CNMA)", label.left = "Favors placebo",
       label.right = "Favors intervention")
References
- Rücker G, Petropoulou M, Schwarzer G. Network meta-analysis of multicomponent interventions. Biom J. 2020;62:808-821. doi:10.1002/bimj.201800167
- Welton NJ, Caldwell DM, Adamopoulos E, Vedhara K. Mixed treatment comparison meta-analysis of complex interventions: psychological interventions in coronary heart disease. Am J Epidemiol. 2009;169:1158-1165. doi:10.1093/aje/kwp014
- Linde K, Rücker G, Schneider A, Kriston L. Questionable assumptions hampered interpretation of a network meta-analysis of primary care depression treatments. J Clin Epidemiol. 2016;71:86-96. doi:10.1016/j.jclinepi.2015.10.010