Mixed IPD and aggregate-data network plot
ML-NMR network diagram
multinma::plaque_psoriasis_ipd, plaque_psoriasis_agd.
multinma::plot() on a network object
What it shows
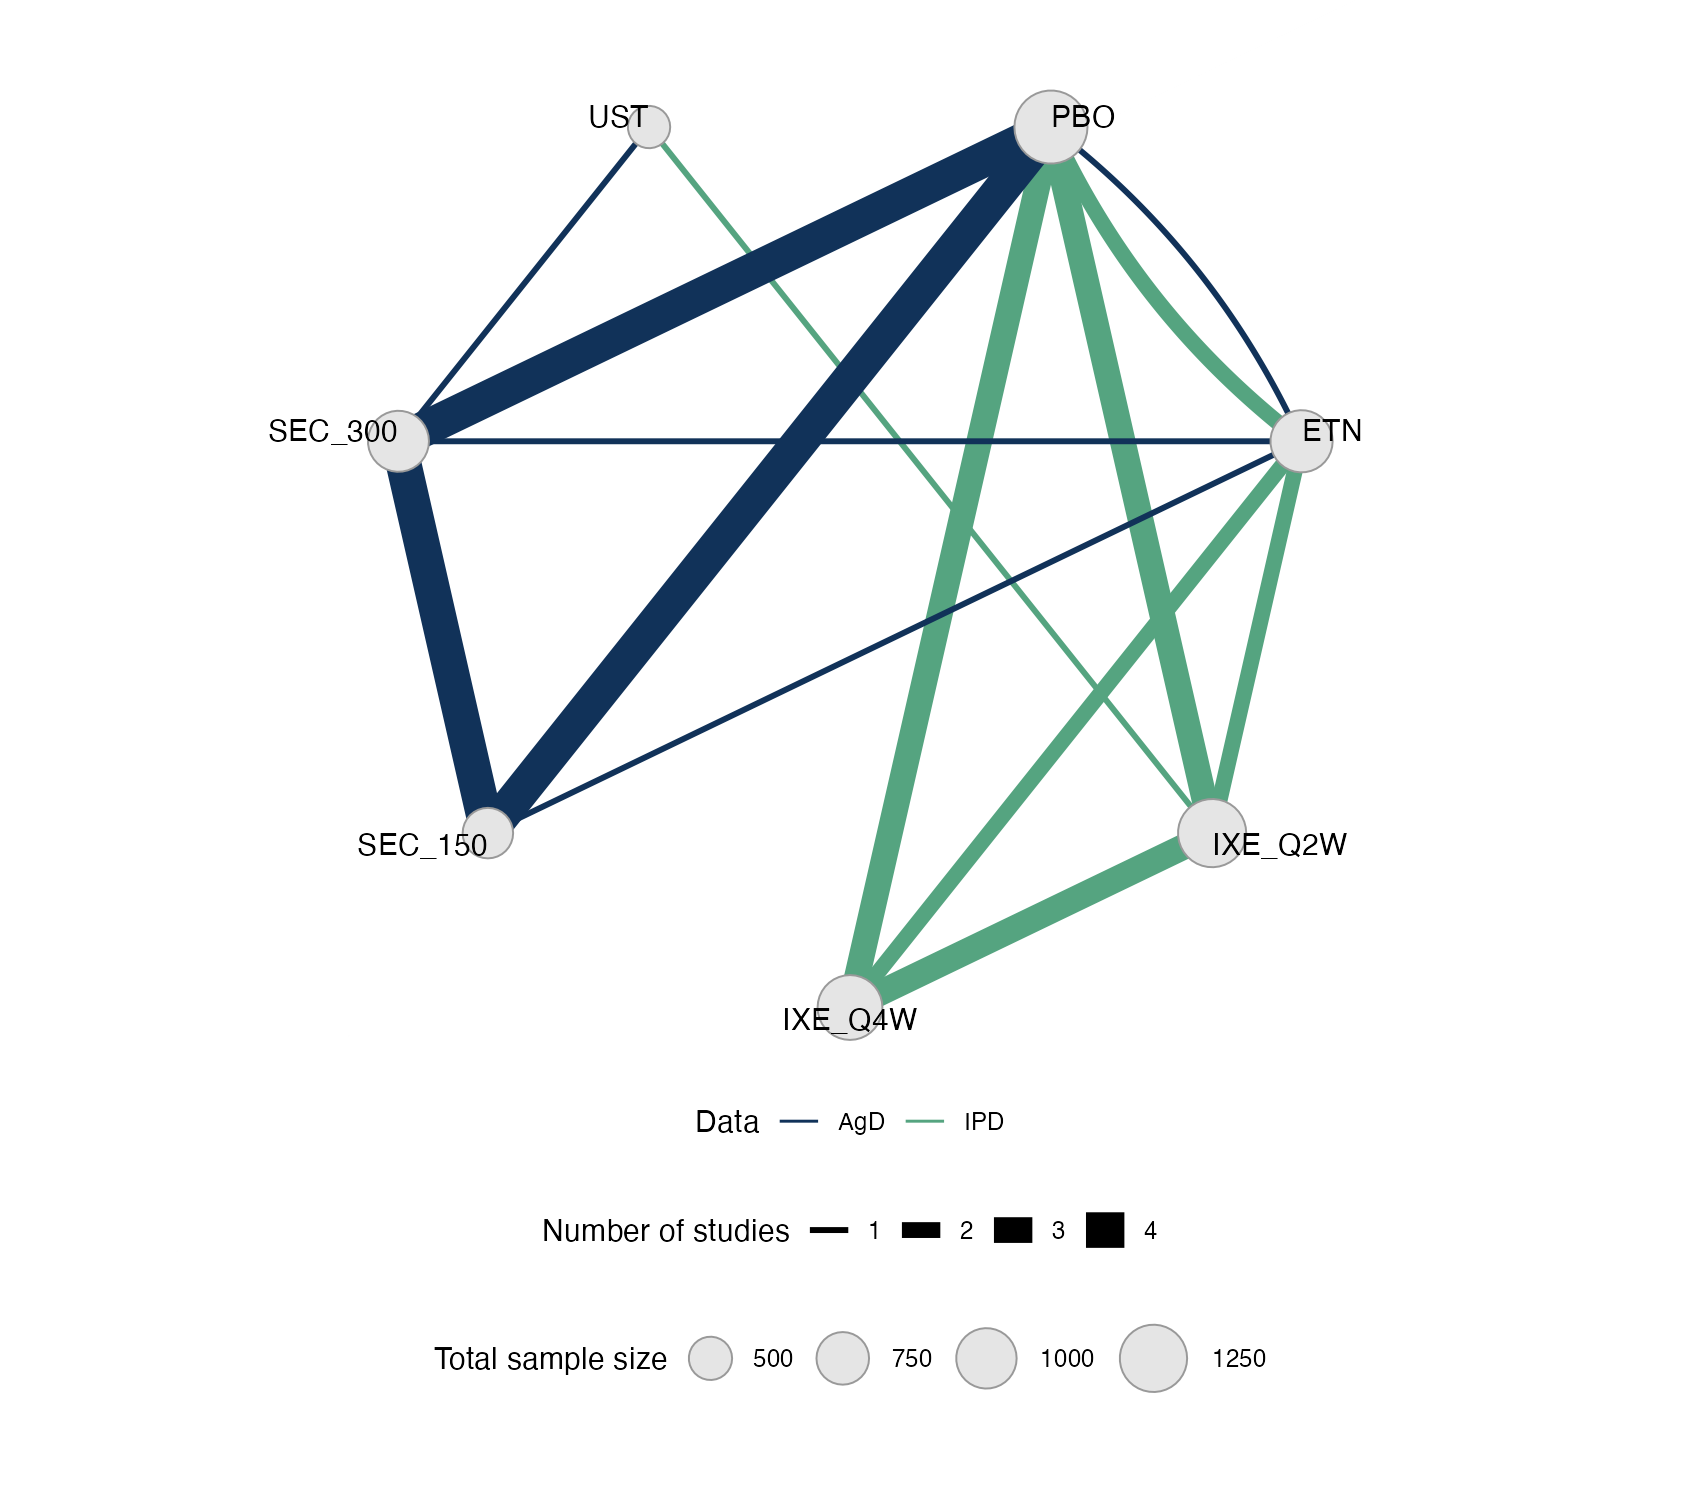
ML-NMR combines individual patient data (IPD) and aggregate data (AgD) in one network. Where the IPD lie matters: IPD identify individual-level covariate effects and interactions, which the model then applies, by integration, to the aggregate studies. The network plot marks each comparison by data type, so readers see which treatments are connected through IPD and which rest on aggregate evidence alone.
How to read it
- Nodes: treatments, sized by total sample size.
- Edges: direct comparisons, width by number of studies, color by data type (IPD or AgD).
- Shared treatments: the bridges through which IPD-based covariate effects inform aggregate comparisons.
Interpretation
The ixekizumab doses are compared with placebo, etanercept, and ustekinumab only in IPD trials, while both secukinumab doses are informed only by aggregate data. The two halves of the network meet through placebo, etanercept, and ustekinumab. Effect modification in the secukinumab trials is therefore learned from the ixekizumab IPD, under the assumption that interactions are shared within the IL-17 treatment class.
Pitfalls
- Placing all IPD on one side of the network makes the shared effect modifier assumption hard to check.
- Edge widths by number of studies hide very different trial sizes.
- The plot says nothing about covariate overlap; pair it with a transitivity plot.
Code
Shared model (R/models/plaque-psoriasis-mlnmr.R)
# ML-NMR of PASI 75 response in plaque psoriasis (Phillippo et al. 2020):
# IPD from 4 ixekizumab trials, aggregate data from 5 secukinumab trials.
library(multinma)
library(dplyr)

trt_class <- function(trtc) case_when(
  trtc == "PBO" ~ "Placebo",
  trtc %in% c("IXE_Q2W", "IXE_Q4W", "SEC_150", "SEC_300") ~ "IL-17 blocker",
  trtc == "ETN" ~ "TNFa blocker",
  trtc == "UST" ~ "IL-12/23 blocker"
)

# Rescale covariates: BSA as a proportion, weight in 10 kg, duration in decades
pso_ipd <- plaque_psoriasis_ipd |>
  mutate(bsa = bsa / 100, weight = weight / 10, durnpso = durnpso / 10,
         prevsys = as.numeric(prevsys), psa = as.numeric(psa),
         trtclass = trt_class(trtc)) |>
  filter(complete.cases(durnpso, prevsys, bsa, weight, psa, pasi75))
pso_agd <- plaque_psoriasis_agd |>
  mutate(bsa_mean = bsa_mean / 100, bsa_sd = bsa_sd / 100,
         weight_mean = weight_mean / 10, weight_sd = weight_sd / 10,
         durnpso_mean = durnpso_mean / 10, durnpso_sd = durnpso_sd / 10,
         prevsys = prevsys / 100, psa = psa / 100,
         trtclass = trt_class(trtc))

pso_net <- combine_network(
  set_ipd(pso_ipd, study = studyc, trt = trtc, r = pasi75, trt_class = trtclass),
  set_agd_arm(pso_agd, study = studyc, trt = trtc, r = pasi75_r, n = pasi75_n,
              trt_class = trtclass),
  trt_ref = "PBO"
)

# Quasi-Monte Carlo integration points over each aggregate study's covariates
pso_net <- add_integration(pso_net,
  durnpso = distr(qgamma, mean = durnpso_mean, sd = durnpso_sd),
  prevsys = distr(qbern, prob = prevsys),
  bsa = distr(qlogitnorm, mean = bsa_mean, sd = bsa_sd),
  weight = distr(qgamma, mean = weight_mean, sd = weight_sd),
  psa = distr(qbern, prob = psa),
  n_int = 64
)

# Fixed-effect ML-NMR, probit link, effect modifiers shared within treatment class
pso_fit <- nma(pso_net, trt_effects = "fixed", link = "probit", likelihood = "bernoulli2",
               regression = ~ (durnpso + prevsys + bsa + weight + psa) * .trt,
               class_interactions = "common",
               prior_intercept = normal(scale = 10), prior_trt = normal(scale = 10),
               prior_reg = normal(scale = 10), init_r = 0.1, QR = TRUE, seed = 2026,
               int_thin = 8, int_check = FALSE)  # save partial integrals for the error plot
Figure
library(multinma)
source("R/models/plaque-psoriasis-mlnmr.R")  # builds pso_net and fits pso_fit

# Network of IPD and aggregate-data studies: node size by total sample size,
# edge width by number of studies, edge color by data type (IPD or AgD)
plot(pso_net, weight_nodes = TRUE, weight_edges = TRUE) +
  ggplot2::theme(legend.position = "bottom", legend.box = "vertical")
References
- Phillippo DM, Dias S, Ades AE, et al. Multilevel network meta-regression for population-adjusted treatment comparisons. J R Stat Soc Ser A. 2020;183:1189-1210. doi:10.1111/rssa.12579
- Phillippo DM. multinma: Bayesian network meta-analysis of individual and aggregate data. R package. dmphillippo.github.io/multinma