Doi plot
Doi plot with LFK index
MA
Effect estimates against the absolute z-score in a folded normal quantile display, summarized by the LFK asymmetry index.
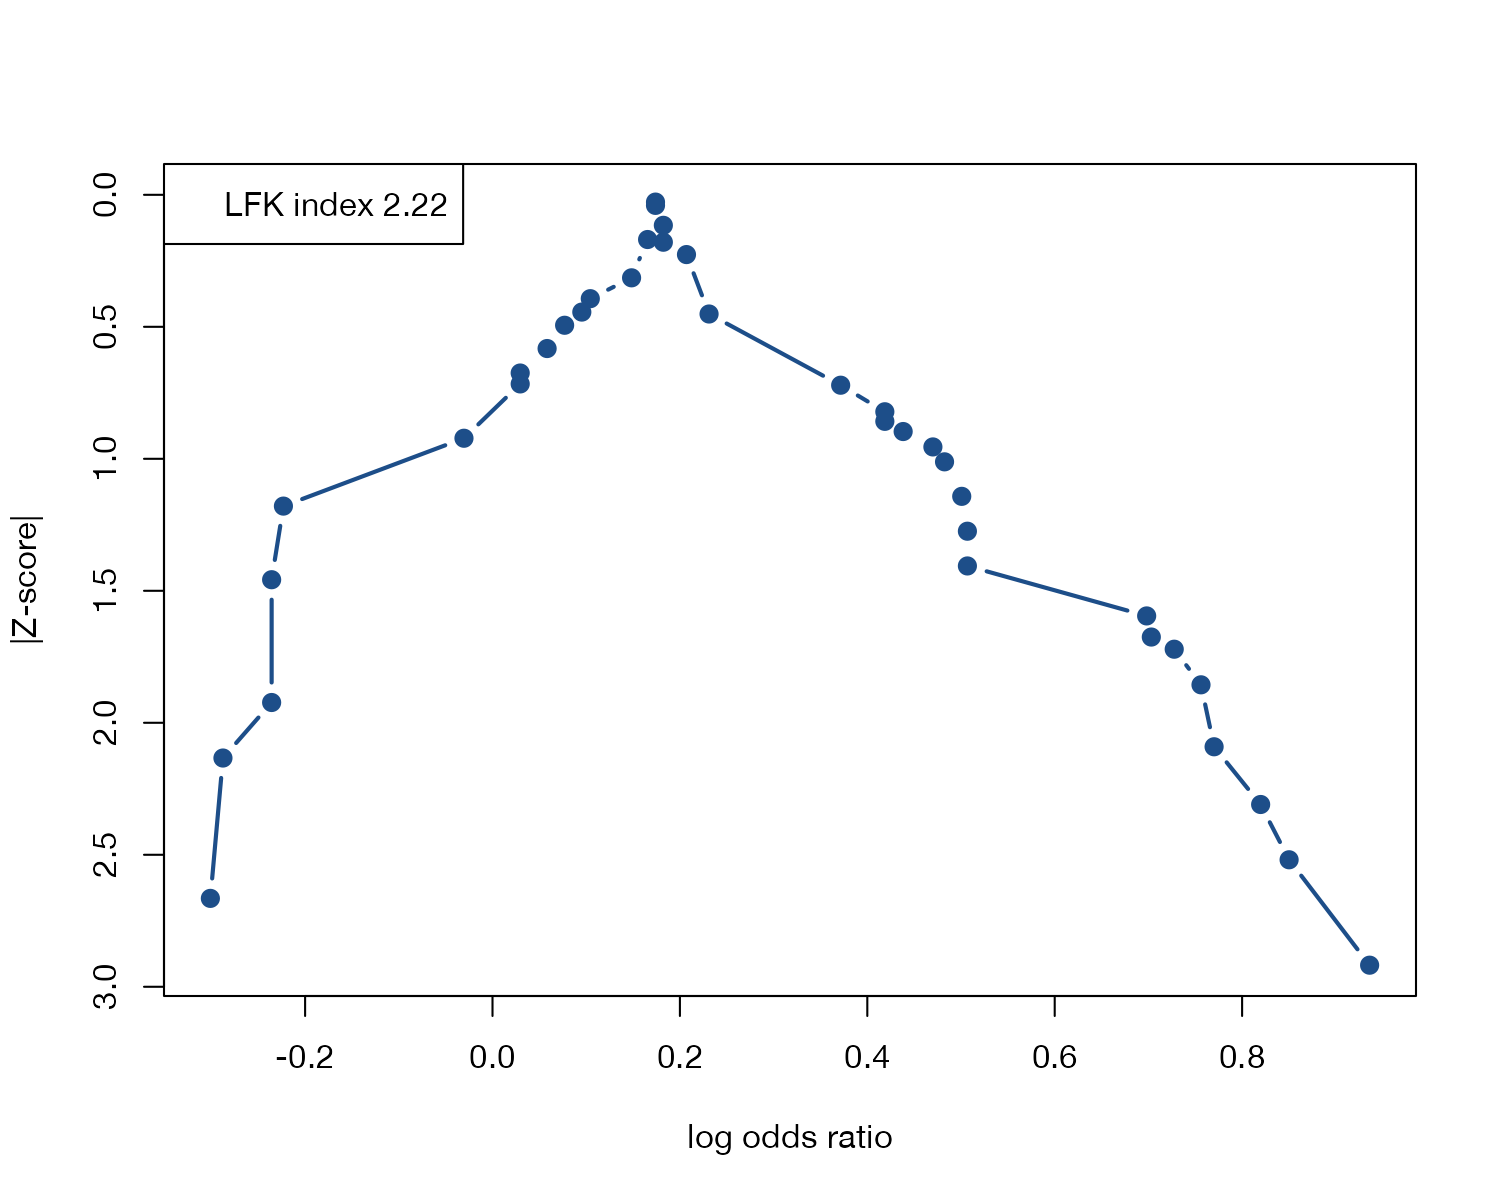
Doi plot of the passive smoking studies: log odds ratio against |z-score| (a folded normal quantile), with the LFK index. Data:
metadat::dat.hackshaw1998.
Family
Small-study effects and reporting bias
Purpose
Describe asymmetry in the distribution of study effects as an alternative to the funnel plot.
Inputs
Study estimates with standard errors.
Software
R
metasens::doiplot(), metasens::lfkindex(); Stata lfk
What it shows
Furuya-Kanamori, Barendregt, and Doi proposed the Doi plot as a replacement for the funnel plot. Studies are ranked by effect size and each is placed at its effect (horizontal) and a folded normal quantile, the absolute \(z\)-score of its percentile (vertical). Without asymmetry the points form a symmetric mountain whose peak is near the pooled estimate. The LFK index summarizes the difference in area between the two limbs; values beyond ±1 are labeled minor and beyond ±2 major asymmetry by the proponents.
How to read it
- Horizontal axis: effect estimate.
- Vertical axis: absolute \(z\)-score of each study’s rank-based percentile (reversed in this display).
- Shape: a symmetric peak suggests no asymmetry; a stretched limb suggests asymmetry.
- LFK index: the numerical summary of asymmetry.
Interpretation
The right limb of the mountain is longer than the left, and the LFK index is 2.22, which its authors would call major asymmetry. This agrees in direction with the funnel plot and Egger’s test for these data.
Pitfalls
- The LFK index is not a valid hypothesis test. A 2024 simulation study found its false-positive rate depends strongly on the number and size of studies and on heterogeneity, and recommended against using it to detect small-study effects.
- The ±1 and ±2 thresholds are conventions, not calibrated error rates.
- The proponents defend it as a descriptive measure; if shown, describe it as such.
Code
library(metasens)

data(dat.hackshaw1998, package = "metadat")

# Doi plot: effect against |z-score|, with the LFK asymmetry index
doiplot(TE = dat.hackshaw1998$yi, seTE = sqrt(dat.hackshaw1998$vi),
        xlab = "log odds ratio", pch = 19, col = "#1d4e89", lwd = 2)
References
- Furuya-Kanamori L, Barendregt JJ, Doi SAR. A new improved graphical and quantitative method for detecting bias in meta-analysis. Int J Evid Based Healthc. 2018;16:195-203. PubMed 29621038
- Schwarzer G, Rücker G, Semaca C. LFK index does not reliably detect small-study effects in meta-analysis: a simulation study. Res Synth Methods. 2024;15:603-615. doi:10.1002/jrsm.1714