Crosshair plot
ROC-space plot with confidence crosshairs
DTA
Each study in ROC space with confidence intervals for both its false positive rate and its sensitivity.
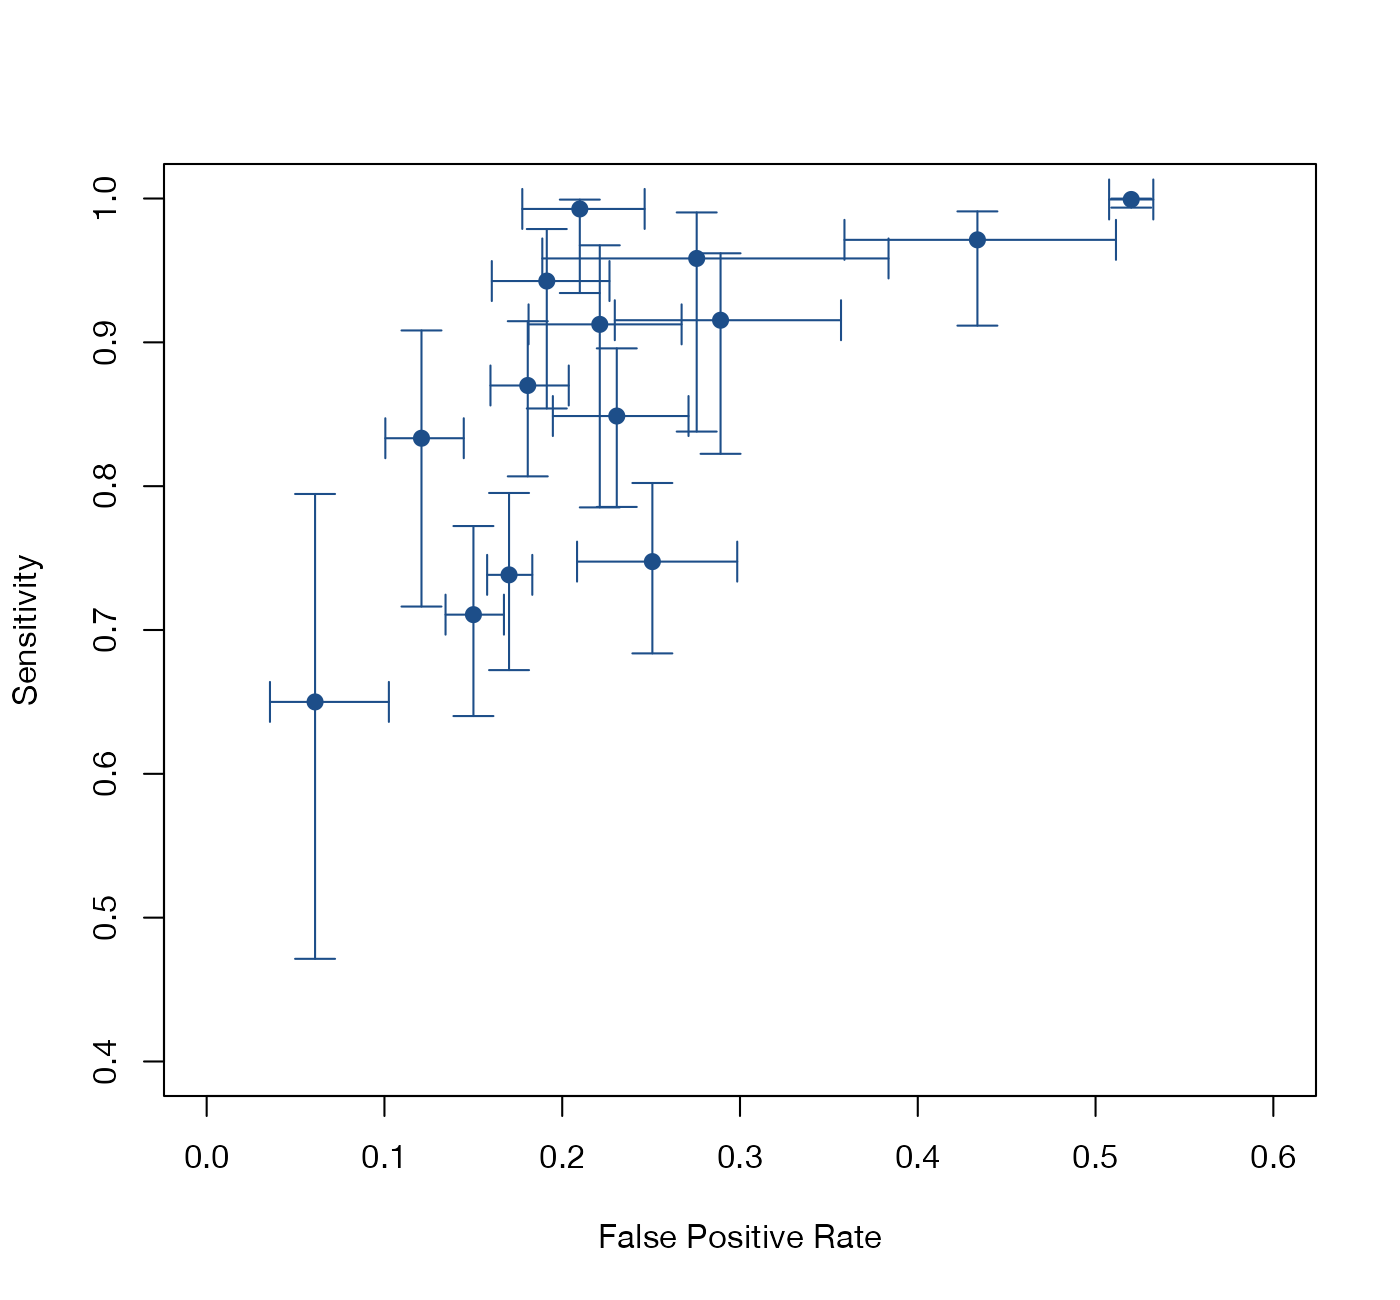
Crosshair plot of the 14 AUDIT-C studies: each study’s false positive rate and sensitivity with 95% confidence intervals in both directions. Data:
mada::AuditC.
Family
Diagnostic test accuracy
Purpose
Show the precision of each study’s accuracy estimates in ROC space.
Inputs
2x2 tables per study.
Software
R
mada::crosshair()
What it shows
The crosshair plot (Phillips and colleagues) draws each study in ROC space with horizontal and vertical confidence intervals, so that the reader sees both where each study lies and how precisely. It sits between the paired forest plot, which shows precision but not the joint position, and the SROC plot, which shows the joint position and summary but hides study precision.
How to read it
- Axes: false positive rate and sensitivity.
- Crosses: each study’s estimate with 95% confidence intervals in both directions.
- Pattern: a positive association of the points across ROC space suggests threshold variation.
Interpretation
The studies run from lower left to upper right, the pattern of a threshold effect. Most crosses are short, but study 3 has a very wide sensitivity interval (0.47 to 0.79) because it included few participants with the target condition.
Pitfalls
- Crosses do not show the within-study correlation between the two estimates.
- With many studies the crosses overlap and become hard to read.
Code
library(mada)

data(AuditC)

# Each study as a cross: its false positive rate and sensitivity with
# 95% confidence intervals in both directions
crosshair(AuditC, xlim = c(0, 0.6), ylim = c(0.4, 1), col = "#1d4e89",
          pch = 19, main = "")
References
- Phillips B, Stewart LA, Sutton AJ. ‘Cross hairs’ plots for diagnostic meta-analysis. Res Synth Methods. 2010;1:308-315. doi:10.1002/jrsm.26
- Doebler P, Holling H. Meta-analysis of diagnostic accuracy with mada. R package vignette. cran.r-project.org/package=mada