Dev-dev plot
Deviance-deviance plot, consistency versus inconsistency model fit
multinma::smoking.
multinma::plot(dic(), dic()); BUGS or JAGS with custom plots (NICE DSU TSD 4)
What it shows
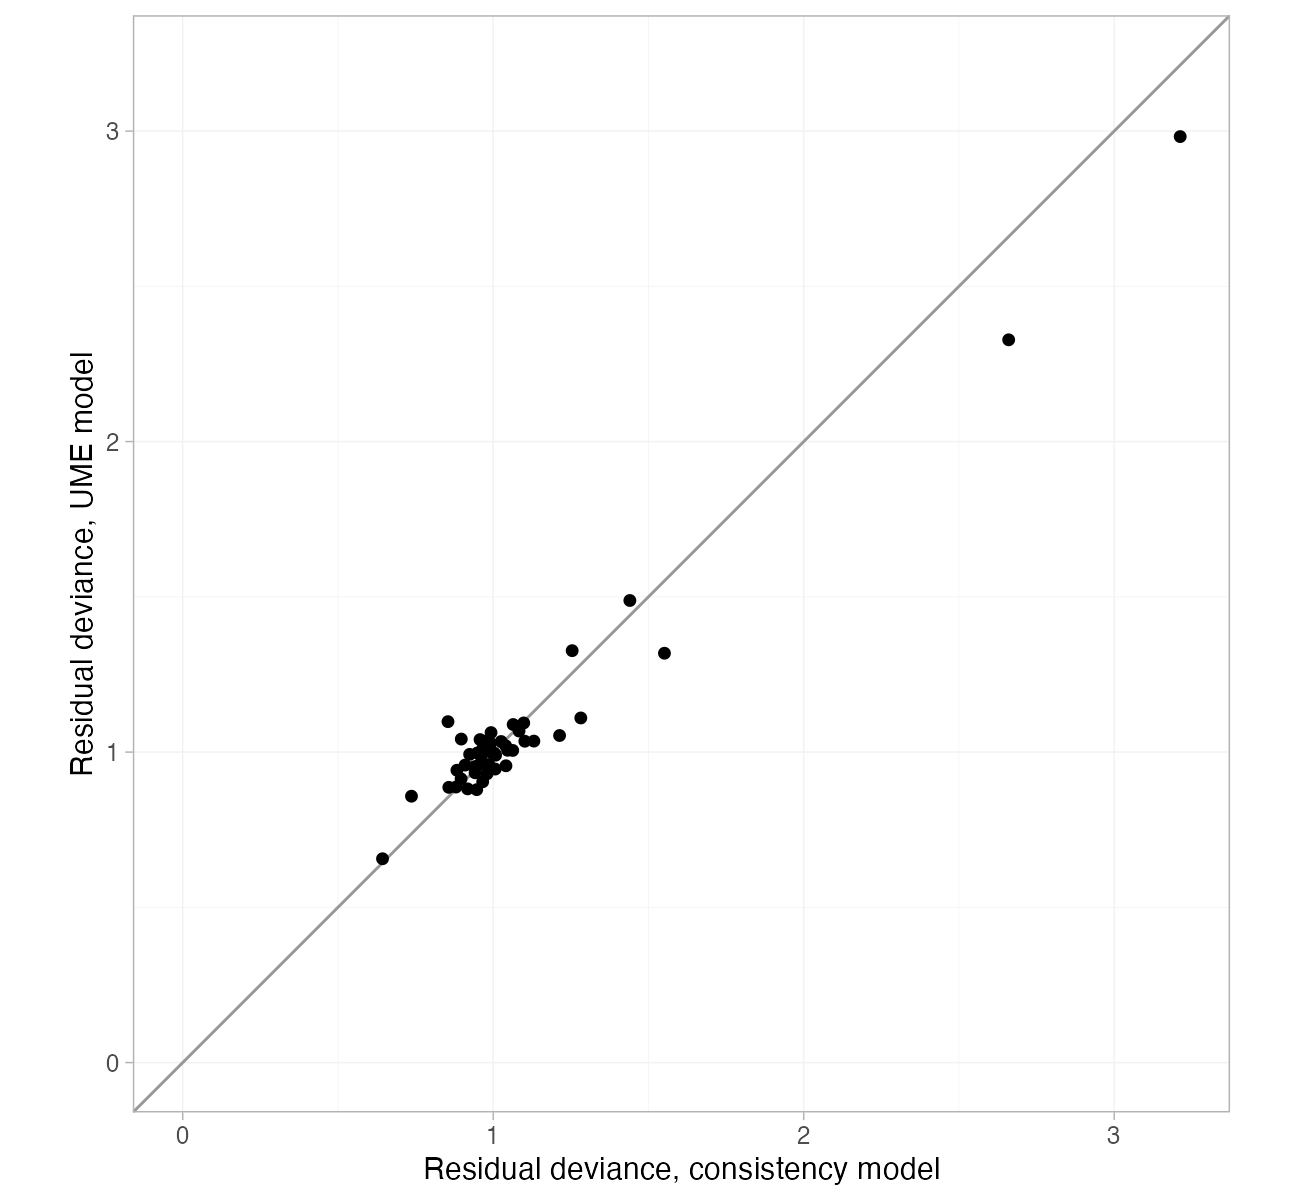
The unrelated mean effects (UME) model estimates each comparison independently, with no consistency constraint. If the network is consistent, the two models fit the data equally well and each data point contributes similar residual deviance to both. The NICE DSU’s Technical Support Document 4 recommends plotting the two sets of contributions against each other. Points well below the diagonal fit better without consistency and flag where inconsistency may lie.
How to read it
- Horizontal axis: residual deviance of each data point under the consistency model.
- Vertical axis: the same under the UME model.
- Diagonal: equal fit.
- Points far below the diagonal: data better explained when consistency is relaxed.
Interpretation
Points cluster tightly around the diagonal near 1. The two outlying arms (the zero-event no-intervention arms) fit slightly better under UME, but the change is small. The overall comparison agrees: residual deviance 54.2 versus 53.7 and DIC 98.1 versus 99.0. There is no evidence that the consistency assumption is violated, and the consistency model is preferred.
Pitfalls
- The UME model has more parameters; compare DIC, not only residual deviance.
- Heterogeneity can absorb inconsistency: compare the posterior of \(\tau\) between models (0.84 against 0.95 here).
- With multi-arm trials, the UME model’s parameterization depends on the choice of baseline.
Code
library(multinma)

net <- set_agd_arm(smoking, study = studyn, trt = trtc, r = r, n = n,
                   trt_ref = "No intervention")

# Consistency model and unrelated mean effects (inconsistency) model
fit_con <- nma(net, trt_effects = "random", consistency = "consistency",
               prior_intercept = normal(scale = 100), prior_trt = normal(scale = 100),
               prior_het = half_normal(scale = 5), seed = 2026)
fit_ume <- nma(net, trt_effects = "random", consistency = "ume",
               prior_intercept = normal(scale = 100), prior_trt = normal(scale = 100),
               prior_het = half_normal(scale = 5), seed = 2026)

# Each point is a data point's residual deviance under both models;
# points far below the diagonal fit better without the consistency assumption
plot(dic(fit_con), dic(fit_ume), show_uncertainty = FALSE) +
  ggplot2::labs(x = "Residual deviance, consistency model",
                y = "Residual deviance, UME model")
References
- Dias S, Welton NJ, Sutton AJ, Caldwell DM, Lu G, Ades AE. Evidence synthesis for decision making 4: inconsistency in networks of evidence based on randomized controlled trials. Med Decis Making. 2013;33:641-656. doi:10.1177/0272989X12455847
- Phillippo DM. multinma: Bayesian network meta-analysis of individual and aggregate data. R package. dmphillippo.github.io/multinma