Marginal effects by study population
Population-average treatment effects from ML-NMR
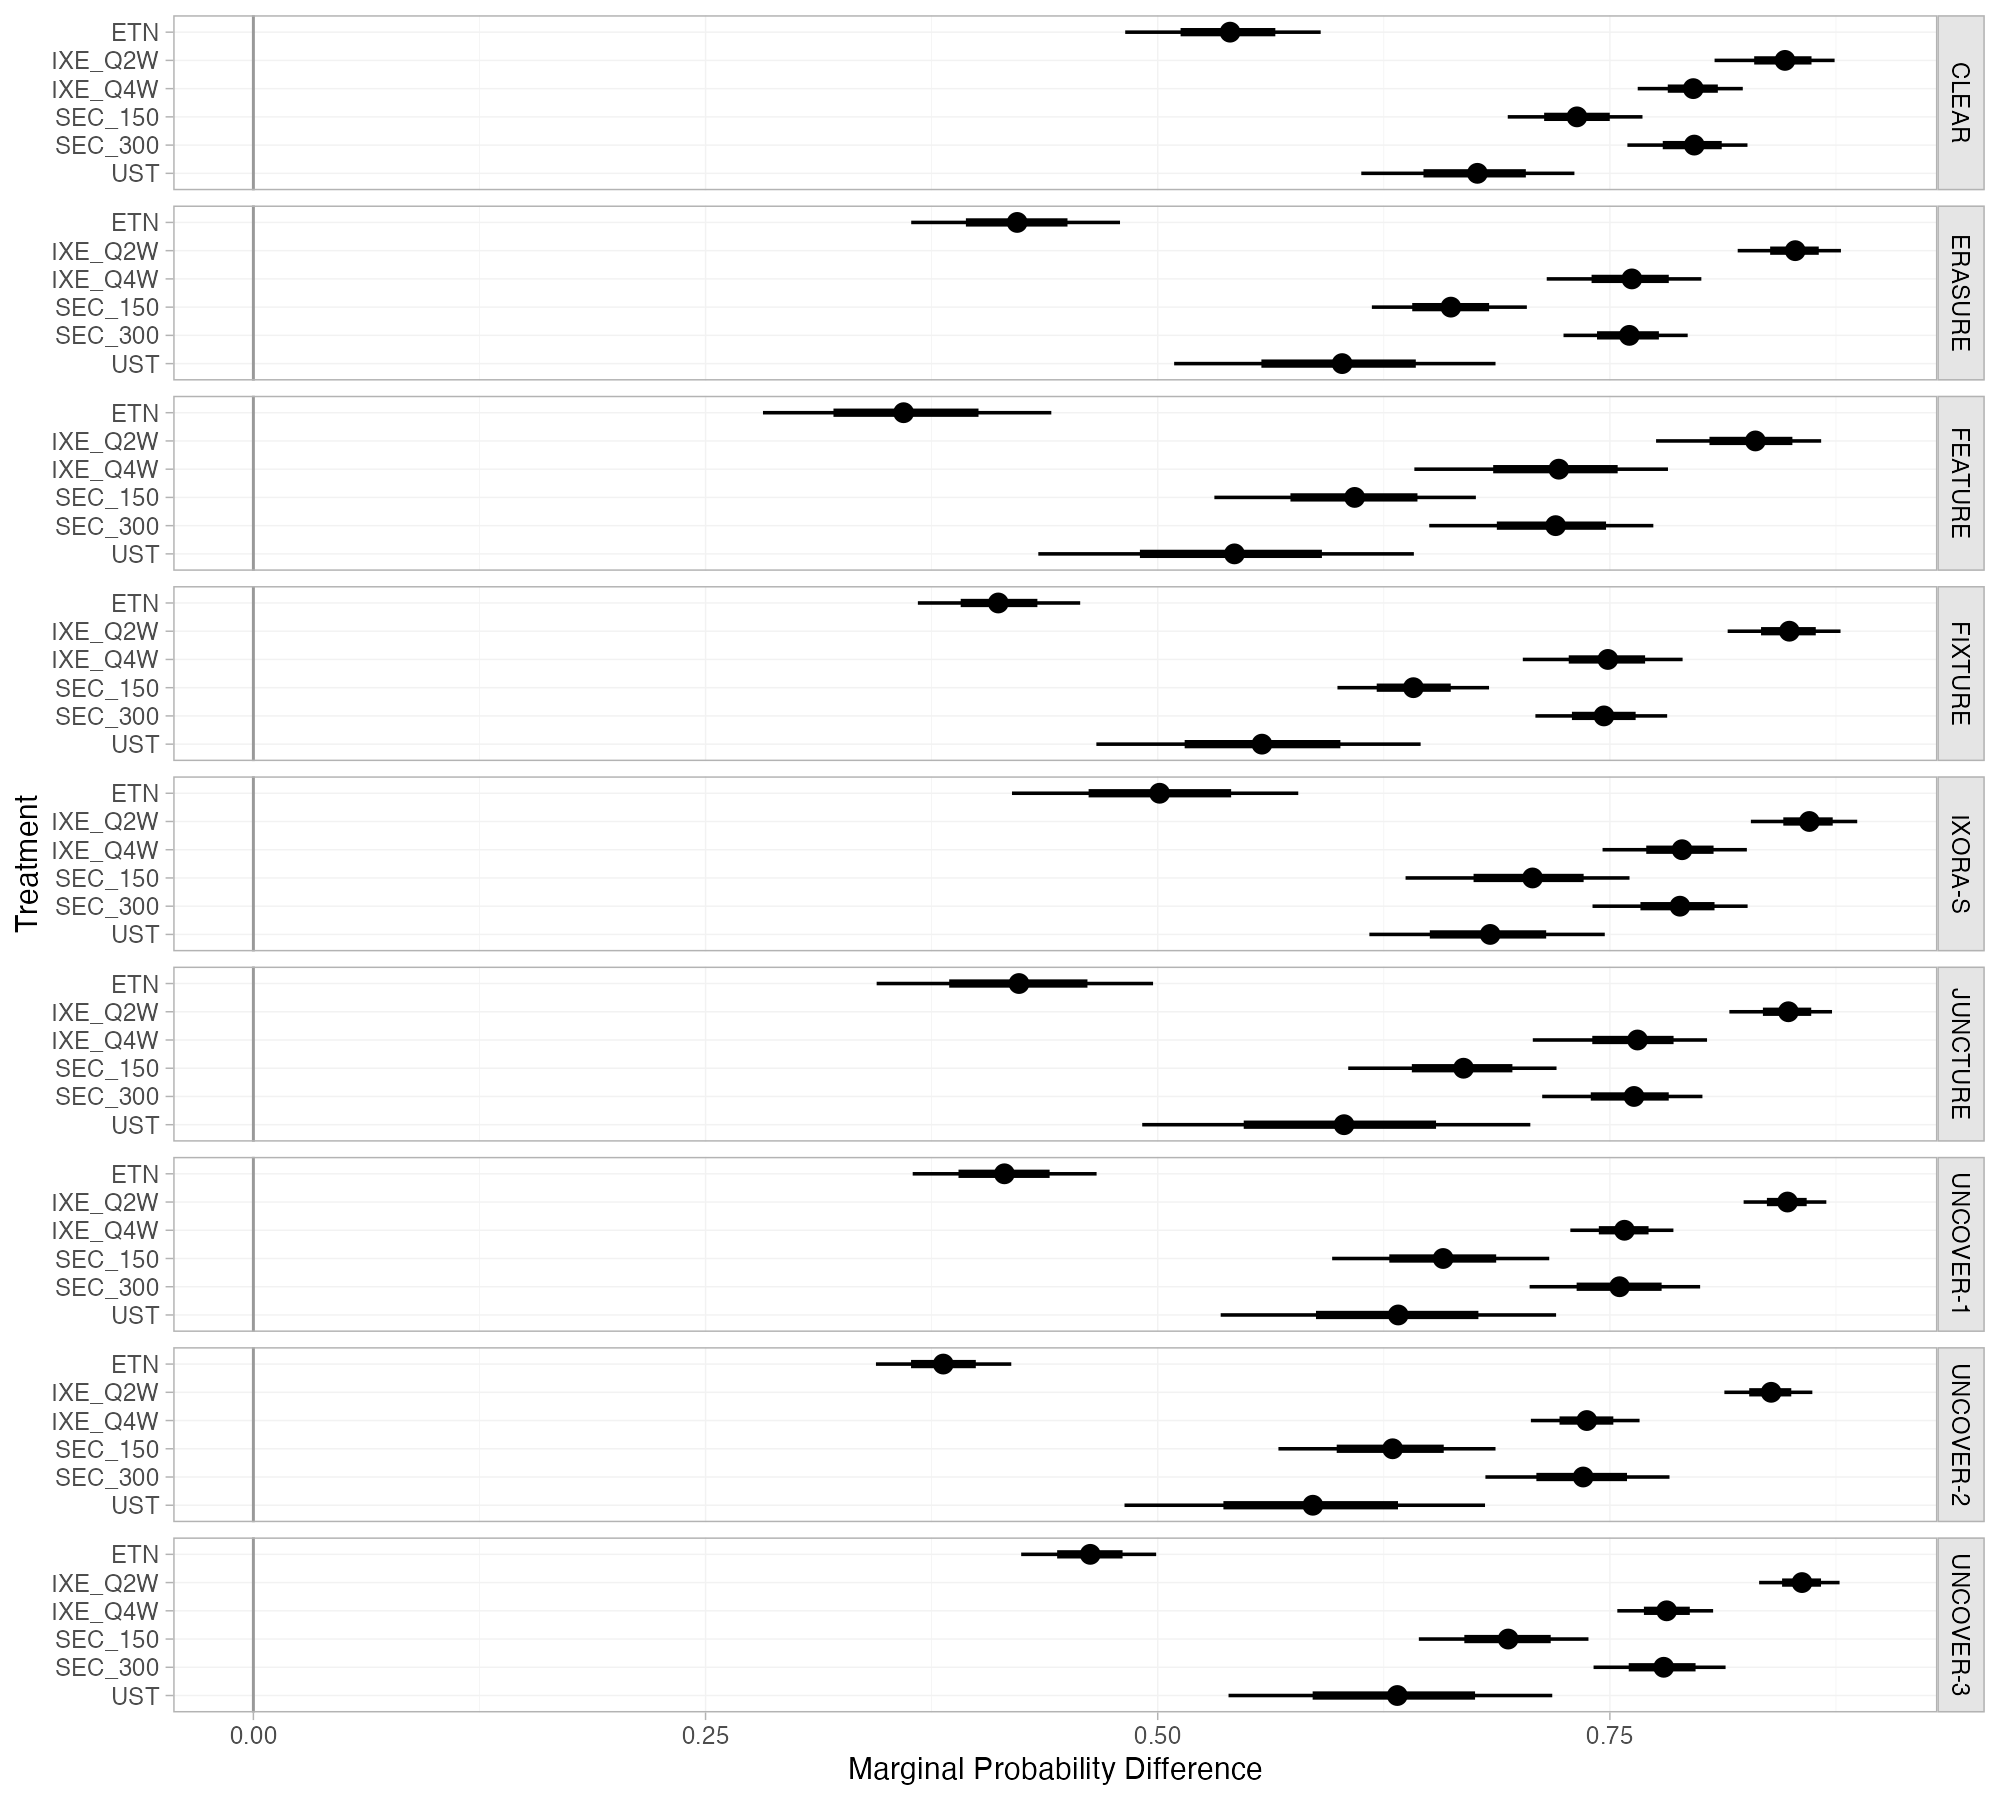
multinma plaque psoriasis example.
multinma::marginal_effects() + plot()
What it shows
ML-NMR models conditional effects on the link scale, but decisions need effects in real populations on interpretable scales. Marginal effects average the model’s predictions over the covariate distribution of a population, giving, for example, the difference in response probability between each treatment and placebo in each study population, or in any external target population supplied to the function. The plot shows these population-specific effects side by side.
How to read it
- Panels: study populations (or chosen target populations).
- Rows: treatments compared with the reference.
- Points and bars: posterior median with 66% and 95% credible intervals.
- Scale: here the marginal risk difference; ratios and link-scale differences are also available.
Interpretation
Ixekizumab Q2W gives the largest increase in PASI 75 response, about 0.83 to 0.85 over placebo in every population. Etanercept varies most between populations, from about 0.36 in FEATURE to 0.54 in CLEAR, because its baseline-dependent effect on the probability scale is sensitive to the population’s covariate mix. Rankings are stable across populations; absolute benefits are not.
Pitfalls
- A marginal effect belongs to a population; always name the population.
- Marginalizing over study populations requires their full covariate distributions; reported means and SDs, plus an assumed correlation structure, stand in for them.
- On the risk difference scale, differences between populations partly reflect different baseline risks, not only effect modification.
Code
Shared model (R/models/plaque-psoriasis-mlnmr.R)
# ML-NMR of PASI 75 response in plaque psoriasis (Phillippo et al. 2020):
# IPD from 4 ixekizumab trials, aggregate data from 5 secukinumab trials.
library(multinma)
library(dplyr)

trt_class <- function(trtc) case_when(
  trtc == "PBO" ~ "Placebo",
  trtc %in% c("IXE_Q2W", "IXE_Q4W", "SEC_150", "SEC_300") ~ "IL-17 blocker",
  trtc == "ETN" ~ "TNFa blocker",
  trtc == "UST" ~ "IL-12/23 blocker"
)

# Rescale covariates: BSA as a proportion, weight in 10 kg, duration in decades
pso_ipd <- plaque_psoriasis_ipd |>
  mutate(bsa = bsa / 100, weight = weight / 10, durnpso = durnpso / 10,
         prevsys = as.numeric(prevsys), psa = as.numeric(psa),
         trtclass = trt_class(trtc)) |>
  filter(complete.cases(durnpso, prevsys, bsa, weight, psa, pasi75))
pso_agd <- plaque_psoriasis_agd |>
  mutate(bsa_mean = bsa_mean / 100, bsa_sd = bsa_sd / 100,
         weight_mean = weight_mean / 10, weight_sd = weight_sd / 10,
         durnpso_mean = durnpso_mean / 10, durnpso_sd = durnpso_sd / 10,
         prevsys = prevsys / 100, psa = psa / 100,
         trtclass = trt_class(trtc))

pso_net <- combine_network(
  set_ipd(pso_ipd, study = studyc, trt = trtc, r = pasi75, trt_class = trtclass),
  set_agd_arm(pso_agd, study = studyc, trt = trtc, r = pasi75_r, n = pasi75_n,
              trt_class = trtclass),
  trt_ref = "PBO"
)

# Quasi-Monte Carlo integration points over each aggregate study's covariates
pso_net <- add_integration(pso_net,
  durnpso = distr(qgamma, mean = durnpso_mean, sd = durnpso_sd),
  prevsys = distr(qbern, prob = prevsys),
  bsa = distr(qlogitnorm, mean = bsa_mean, sd = bsa_sd),
  weight = distr(qgamma, mean = weight_mean, sd = weight_sd),
  psa = distr(qbern, prob = psa),
  n_int = 64
)

# Fixed-effect ML-NMR, probit link, effect modifiers shared within treatment class
pso_fit <- nma(pso_net, trt_effects = "fixed", link = "probit", likelihood = "bernoulli2",
               regression = ~ (durnpso + prevsys + bsa + weight + psa) * .trt,
               class_interactions = "common",
               prior_intercept = normal(scale = 10), prior_trt = normal(scale = 10),
               prior_reg = normal(scale = 10), init_r = 0.1, QR = TRUE, seed = 2026,
               int_thin = 8, int_check = FALSE)  # save partial integrals for the error plot
Figure
library(multinma)
source("R/models/plaque-psoriasis-mlnmr.R")  # builds pso_net and fits pso_fit

# Marginal differences in the probability of PASI 75 response against placebo,
# averaged over the covariate distribution of each study population
plot(marginal_effects(pso_fit, mtype = "difference"), ref_line = 0)
References
- Phillippo DM, Dias S, Ades AE, et al. Multilevel network meta-regression for population-adjusted treatment comparisons. J R Stat Soc Ser A. 2020;183:1189-1210. doi:10.1111/rssa.12579
marginal_effects()reference. multinma documentation. dmphillippo.github.io/multinma