Hasse diagram
Partial order plot, poset diagram
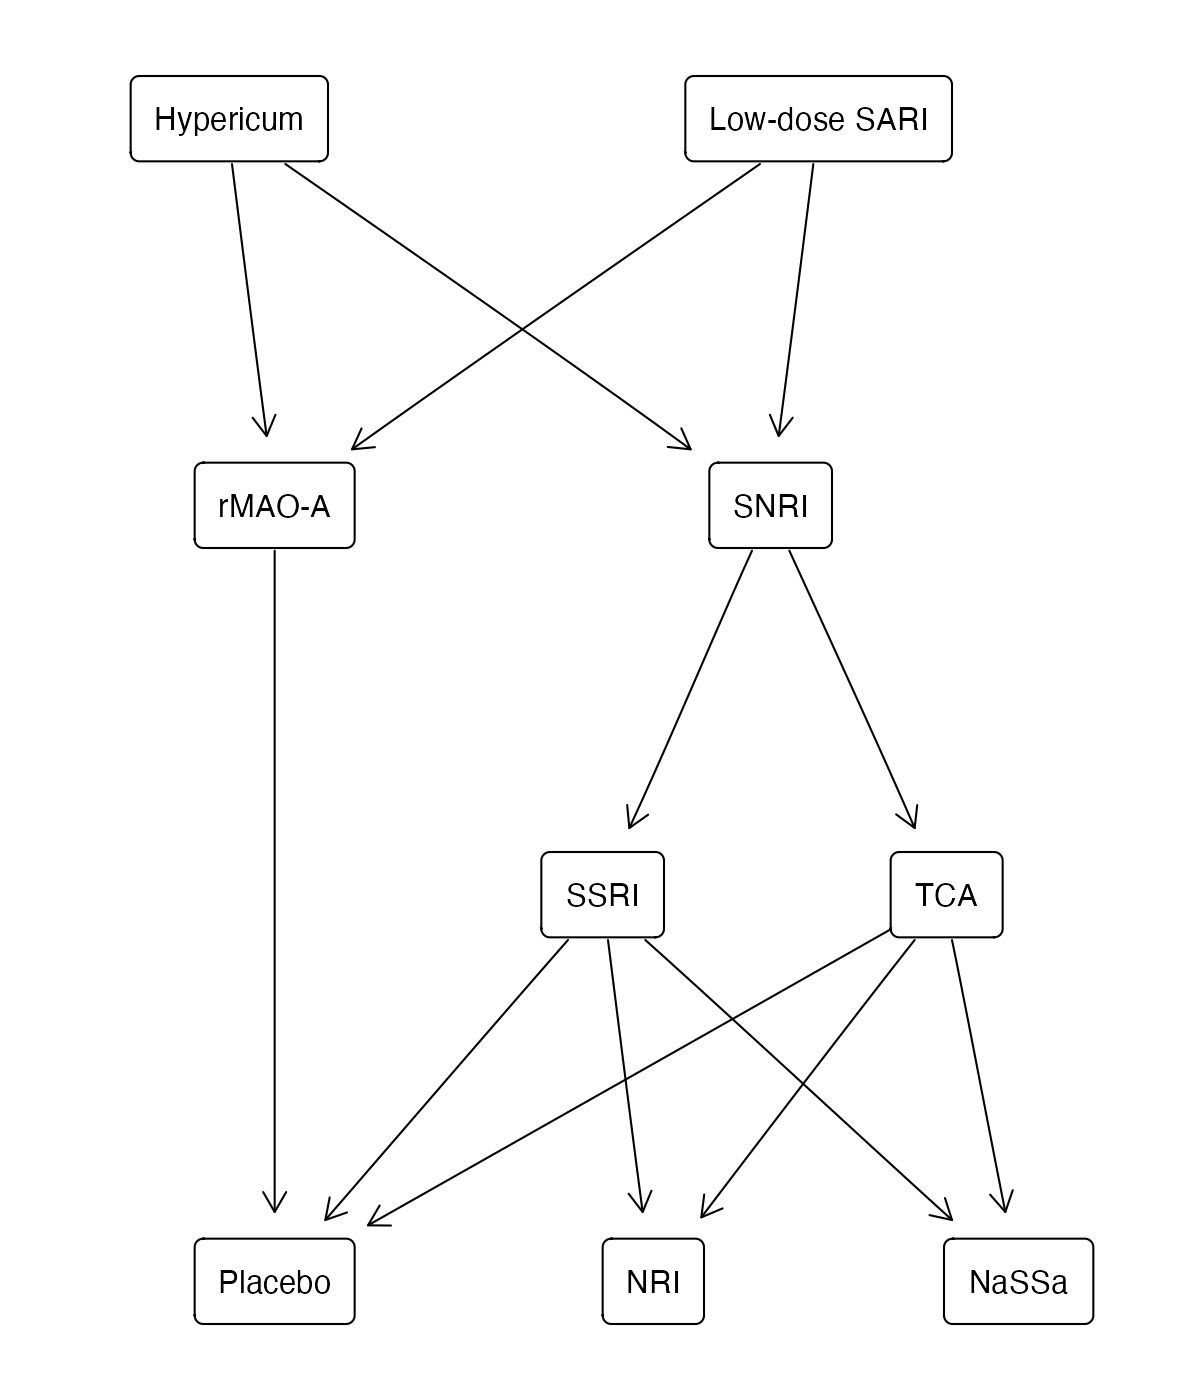
netmeta::Linde2015.
netmeta::netposet() and netmeta::hasse() (requires Rgraphviz)
What it shows
When treatments rank differently on different outcomes, any single ranking hides a value judgment about how to weigh the outcomes. Rücker and Schwarzer proposed a partial order instead: treatment A is placed above B only if A is better on every outcome. The Hasse diagram draws this partial order with arrows between treatments, omitting arrows implied by transitivity.
How to read it
- Arrows: “better on all outcomes than”.
- Levels: treatments near the top are not dominated by others.
- No path between two treatments: they are incomparable; each wins on some outcome.
Interpretation
Hypericum and low-dose SARI are at the top: nothing dominates them, and they dominate most other treatments. rMAO-A and SNRI form the second level but are incomparable with each other (rMAO-A has better acceptability, SNRI better efficacy). Placebo, NRI, and NaSSa are at the bottom; NRI is dominated because of its poor acceptability, despite mid-table efficacy.
Pitfalls
- The partial order depends on the ranking metric used; with uncertain rankings, dominance can be fragile.
- With many outcomes almost everything becomes incomparable.
- The diagram does not show the size of differences.
Code
library(netmeta)

# Antidepressants in primary care (Linde et al. 2015): arm-level binary outcomes
data(Linde2015)
d <- Linde2015
nma_for <- function(v, small) {
  p <- pairwise(treat = list(d$treatment1, d$treatment2, d$treatment3),
                event = list(d[[paste0(v, 1)]], d[[paste0(v, 2)]], d[[paste0(v, 3)]]),
                n = list(d$n1, d$n2, d$n3), studlab = d$id, sm = "OR", allstudies = TRUE)
  netmeta(p, common = FALSE, reference.group = "Placebo", small.values = small)
}

resp <- nma_for("resp", small = "undesirable")
loss <- nma_for("loss", small = "desirable")

# Partial order from P-scores for efficacy and acceptability: an arrow from
# A to B means A is better than B on both outcomes
po <- netposet(netrank(resp), netrank(loss), outcomes = c("Response", "Dropout"))
hasse(po)
References
- Rücker G, Schwarzer G. Resolve conflicting rankings of outcomes in network meta-analysis: partial ordering of treatments. Res Synth Methods. 2017;8:526-536. doi:10.1002/jrsm.1270
- Linde K, Kriston L, Rücker G, et al. Efficacy and acceptability of pharmacological treatments for depressive disorders in primary care: systematic review and network meta-analysis. Ann Fam Med. 2015;13:69-79. doi:10.1370/afm.1687