Loop inconsistency plot
IF plot, inconsistency factor plot
NMA
The inconsistency factor of every closed loop in the network, with confidence intervals truncated at zero.
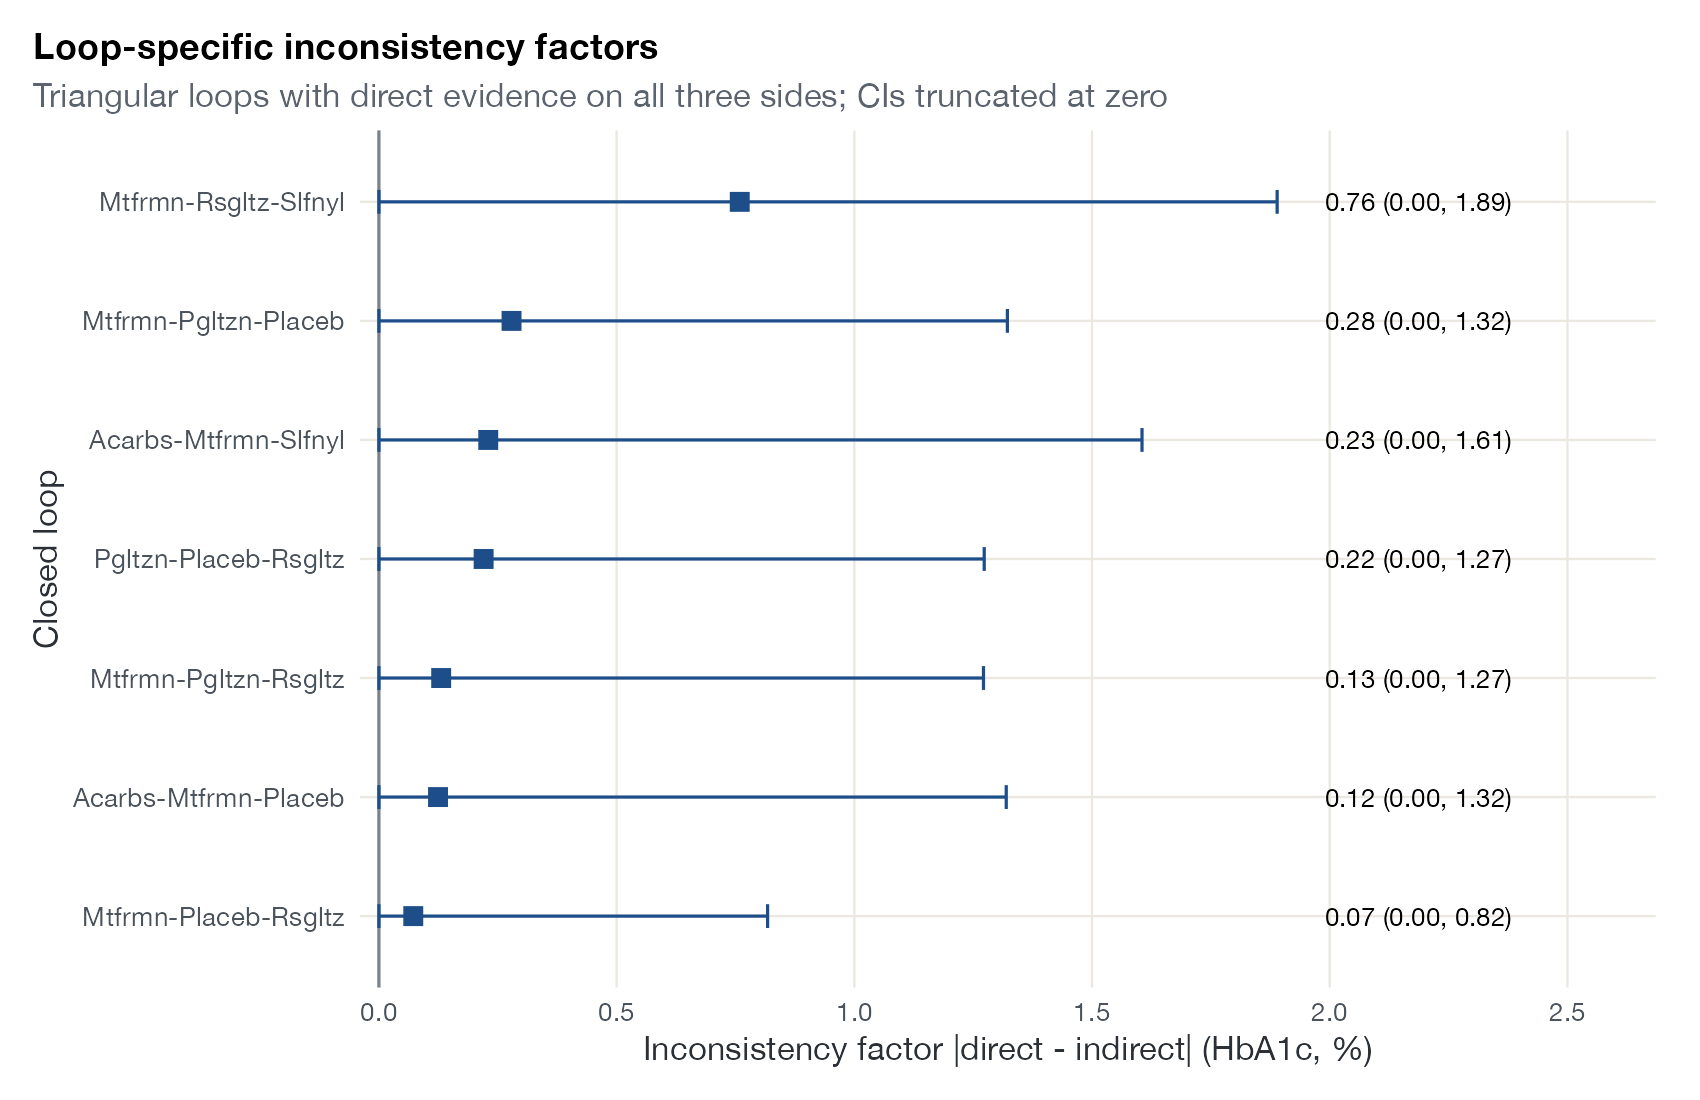
Absolute inconsistency factors (direct minus indirect) with 95% CIs for the seven triangular loops of the diabetes network that have direct evidence on all three sides, from random-effects pairwise estimates. Data:
netmeta::Senn2013.
Family
Inconsistency
Purpose
Check consistency loop by loop using the Bucher approach.
Inputs
Direct pairwise estimates for all comparisons in each closed loop.
Software
Stata
ifplot (network graphs package); R custom from netmeta::netsplit() direct estimates (shown)
What it shows
In every closed loop of three treatments A, B, and C, the direct estimate of one side can be compared with the indirect estimate formed from the other two sides (as in a Bucher comparison). Their absolute difference is the loop’s inconsistency factor (IF). The IF plot, popularized by Stata’s ifplot, lists every loop with its IF and confidence interval, truncating the lower limit at zero because the IF is an absolute value.
How to read it
- Rows: closed loops, labeled by their treatments.
- Points: absolute inconsistency factor.
- Lines: 95% confidence intervals, with the lower limit truncated at zero.
- Look for: loops whose interval excludes zero, or with large IFs relative to the effects being compared.
Interpretation
The metformin, rosiglitazone, and sulfonylurea loop has the largest inconsistency factor (0.76 percentage points of HbA1c) but its interval runs to zero. The other loops have small IFs. The same loop drives the hot spot in the net heat plot.
Pitfalls
- Loops are not independent; they share comparisons.
- Multi-arm trials create loops that are consistent by construction and should be handled separately.
- With many loops, some intervals will exclude zero by chance.
- For complex networks, loop-by-loop checking is awkward; prefer node splitting or global tests.
Code
library(netmeta)
library(ggplot2)

data(Senn2013)

net <- netmeta(
  TE, seTE, treat1.long, treat2.long, studlab,
  data = Senn2013, sm = "MD",
  common = FALSE, reference.group = "Placebo"
)

# Direct (pairwise) estimates for every comparison with head-to-head trials
dir <- netsplit(net)$direct.random
dir <- dir[!is.na(dir$TE), ]
pairs <- do.call(rbind, strsplit(dir$comparison, ":"))
d <- function(a, b) {
  i <- which(pairs[, 1] == a & pairs[, 2] == b)
  if (length(i)) return(c(dir$TE[i], dir$seTE[i]))
  i <- which(pairs[, 1] == b & pairs[, 2] == a)
  if (length(i)) return(c(-dir$TE[i], dir$seTE[i]))
  NULL
}

# Inconsistency factor of each closed triangular loop: the direct estimate
# of one side minus the indirect estimate formed by the other two sides
trts <- net$trts
loops <- list()
for (tr in combn(trts, 3, simplify = FALSE)) {
  ab <- d(tr[1], tr[2]); ac <- d(tr[1], tr[3]); bc <- d(tr[2], tr[3])
  if (is.null(ab) || is.null(ac) || is.null(bc)) next
  if_est <- ab[1] - (ac[1] - bc[1])
  if_se <- sqrt(ab[2]^2 + ac[2]^2 + bc[2]^2)
  loops[[length(loops) + 1]] <- data.frame(
    loop = paste(abbreviate(tr, 6), collapse = "-"),
    IF = abs(if_est), lo = pmax(0, abs(if_est) - 1.96 * if_se),
    hi = abs(if_est) + 1.96 * if_se
  )
}
loops <- do.call(rbind, loops)
loops$loop <- factor(loops$loop, levels = loops$loop[order(loops$IF)])

ggplot(loops, aes(IF, loop)) +
  geom_vline(xintercept = 0, colour = "#7a828c") +
  geom_errorbar(aes(xmin = lo, xmax = hi), width = 0.2, orientation = "y",
                colour = "#1d4e89") +
  geom_point(shape = 15, size = 3, colour = "#1d4e89") +
  geom_text(aes(x = max(hi) + 0.1, label = sprintf("%.2f (%.2f, %.2f)", IF, lo, hi)),
            hjust = 0, size = 3.3) +
  scale_x_continuous(expand = expansion(mult = c(0.02, 0.35))) +
  labs(x = "Inconsistency factor |direct - indirect| (HbA1c, %)", y = "Closed loop",
       title = "Loop-specific inconsistency factors",
       subtitle = "Triangular loops with direct evidence on all three sides; CIs truncated at zero")
network convert pairs
ifplot _y _stderr t1 t2 studyid, tau2(loop) plotopt(...)References
- Veroniki AA, Vasiliadis HS, Higgins JPT, Salanti G. Evaluation of inconsistency in networks of interventions. Int J Epidemiol. 2013;42:332-345. doi:10.1093/ije/dys222
- Chaimani A, Higgins JPT, Mavridis D, Spyridonos P, Salanti G. Graphical tools for network meta-analysis in STATA. PLoS One. 2013;8:e76654. doi:10.1371/journal.pone.0076654