Effect-modification comparison plot
Effect modifier relationships implied by NMA, NMR, ML-NMR, and NMI
NMI
ML-NMR
NMA
The treatment effect across values of an effect modifier as implied by each synthesis method, compared with the truth in a simulation.
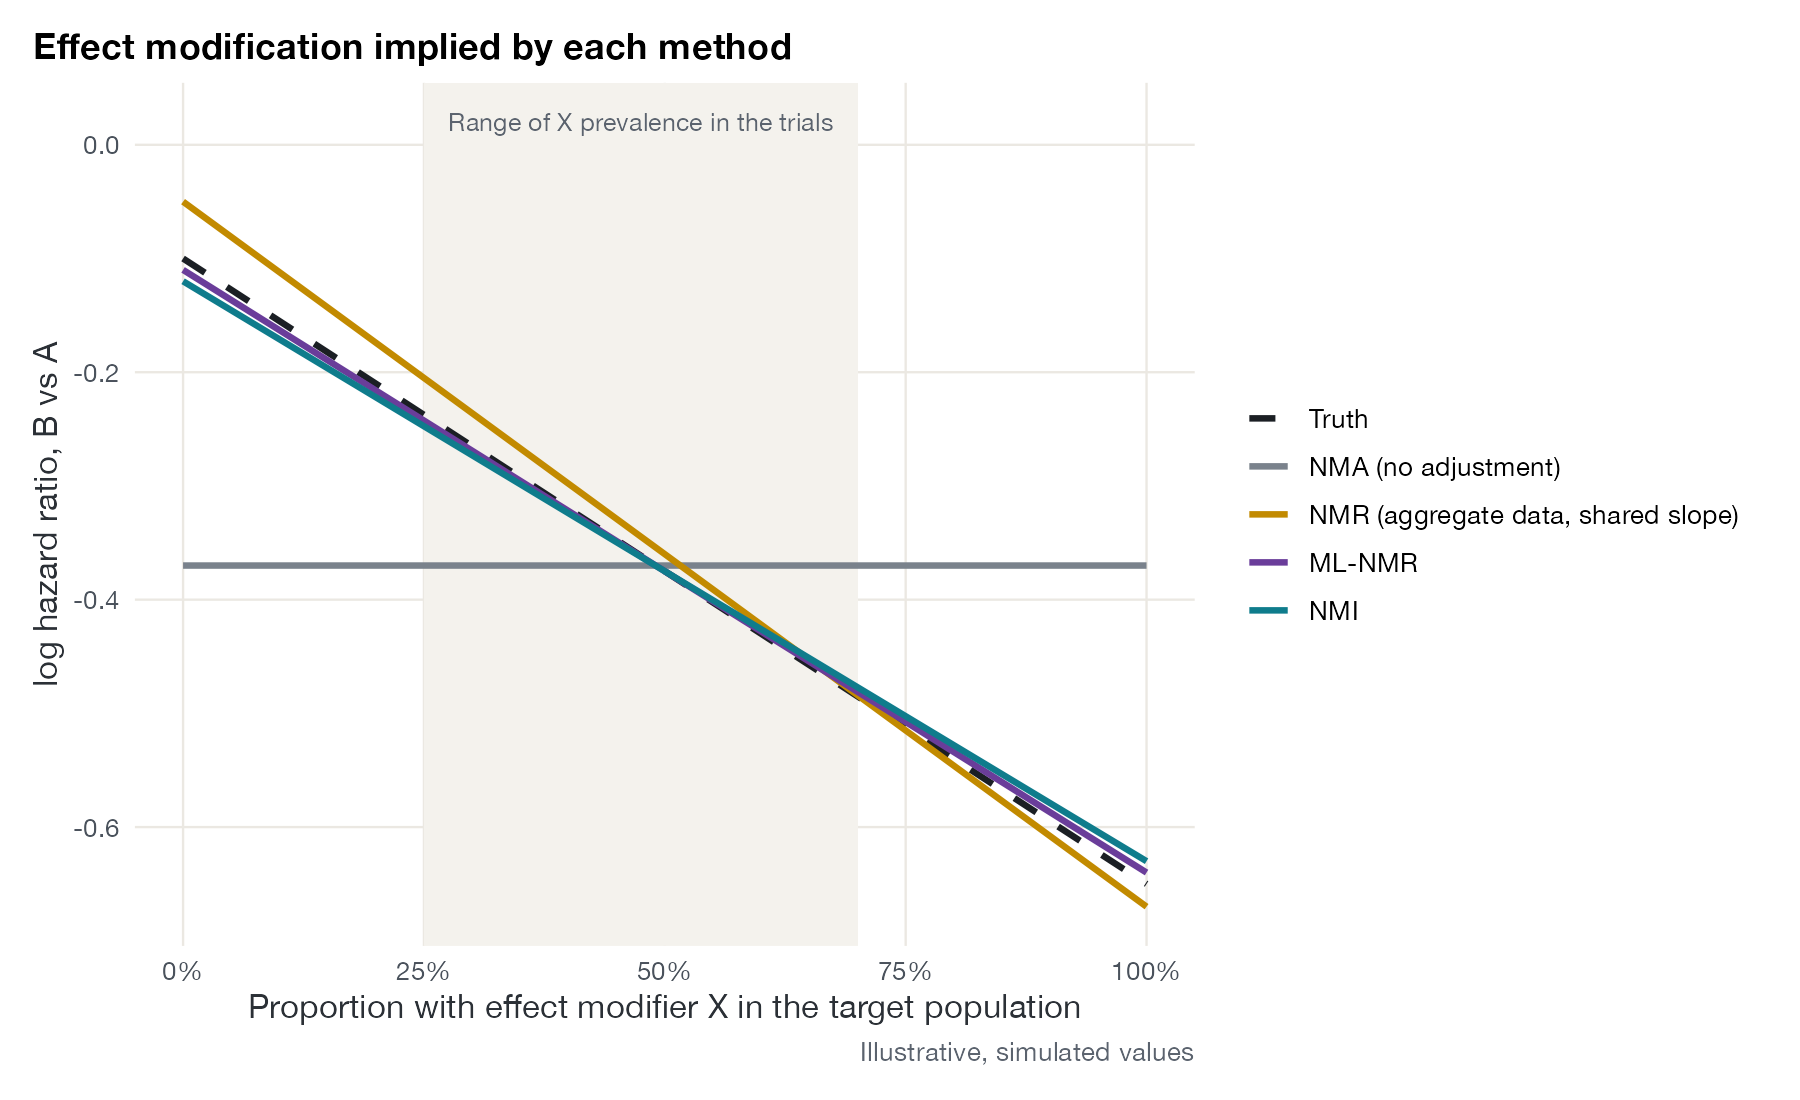
Log hazard ratio of B vs A as a function of the prevalence of effect modifier X, as implied by unadjusted NMA, aggregate-data network meta-regression, ML-NMR, and NMI, against the data-generating truth. The shaded band marks the range of prevalence observed in the trials. Illustrative, simulated values.
Family
Network meta-interpolation
Purpose
Compare how different synthesis methods represent effect modification.
Inputs
Fitted models or their implied effect-modifier relationships.
Software
Custom
ggplot2 (shown)
What it shows
This proof-of-concept display, of the kind used in the NMI conference and simulation material, plots the treatment effect against an effect modifier as each method sees it. Standard NMA ignores the modifier (a flat line). Aggregate-data network meta-regression estimates a slope from between-trial variation and is prone to aggregation bias. ML-NMR and NMI use within-trial information and should track the truth.
How to read it
- Horizontal axis: prevalence of the effect modifier in the target population.
- Vertical axis: relative treatment effect.
- Lines: implied relationship for each method; dashed black is the truth.
- Shaded band: range covered by the trials; outside it every method extrapolates.
Interpretation
The NMA line is flat at the average effect and is wrong for any population whose prevalence differs from the trials’ average. Aggregate-data NMR has the right direction but too steep a slope. ML-NMR and NMI lie close to the truth across the observed range.
Pitfalls
- The figure illustrates one simulated scenario; performance depends on the data-generating mechanism.
- Agreement within the observed range says little about extrapolation.
Code
library(ggplot2)

# Relationship between a binary effect modifier's prevalence and the B vs A
# log HR implied by each method, against the data-generating truth.
# Illustrative values of the kind shown in the NMI proof-of-concept work.
x <- seq(0, 1, length.out = 101)
lines <- rbind(
  data.frame(x, d = -0.10 - 0.55 * x, method = "Truth"),
  data.frame(x, d = -0.37, method = "NMA (no adjustment)"),
  data.frame(x, d = -0.05 - 0.62 * x, method = "NMR (aggregate data, shared slope)"),
  data.frame(x, d = -0.11 - 0.53 * x, method = "ML-NMR"),
  data.frame(x, d = -0.12 - 0.51 * x, method = "NMI")
)
lines$method <- factor(lines$method, levels = unique(lines$method))

ggplot(lines, aes(x, d, colour = method, linetype = method)) +
  annotate("rect", xmin = 0.25, xmax = 0.70, ymin = -Inf, ymax = Inf, fill = "#f4f2ed") +
  annotate("text", x = 0.475, y = 0.02, label = "Range of X prevalence in the trials",
           size = 3.2, colour = "#5b636e") +
  geom_line(linewidth = 1.1) +
  scale_colour_manual(values = c("#1b1f24", "#7a828c", "#c28a00", "#6a3d9a", "#0f7c8c"), name = NULL) +
  scale_linetype_manual(values = c("dashed", "solid", "solid", "solid", "solid"), name = NULL) +
  scale_x_continuous(labels = scales::percent) +
  labs(x = "Proportion with effect modifier X in the target population",
       y = "log hazard ratio, B vs A",
       title = "Effect modification implied by each method",
       caption = "Illustrative, simulated values") +
  theme(legend.position = "right")
References
- Harari O, Soltanifar M, Cappelleri JC, et al. Network meta-interpolation: effect modification adjustment in network meta-analysis using subgroup analyses. Res Synth Methods. 2023;14:211-233. doi:10.1002/jrsm.1608
- Harari O, et al. Network meta-interpolation (NMI): effect modification adjustment in NMA using subgroup analyses. ISPOR Europe 2022 presentation. PDF
- Phillippo DM, Dias S, Ades AE, et al. Multilevel network meta-regression for population-adjusted treatment comparisons. J R Stat Soc Ser A. 2020;183:1189-1210. doi:10.1111/rssa.12579