Prediction interval plot
Predictive distribution, new-study interval
metadat::dat.bcg.
metafor::predict(), meta::forest(prediction = TRUE); Stata meta summarize, predinterval
What it shows
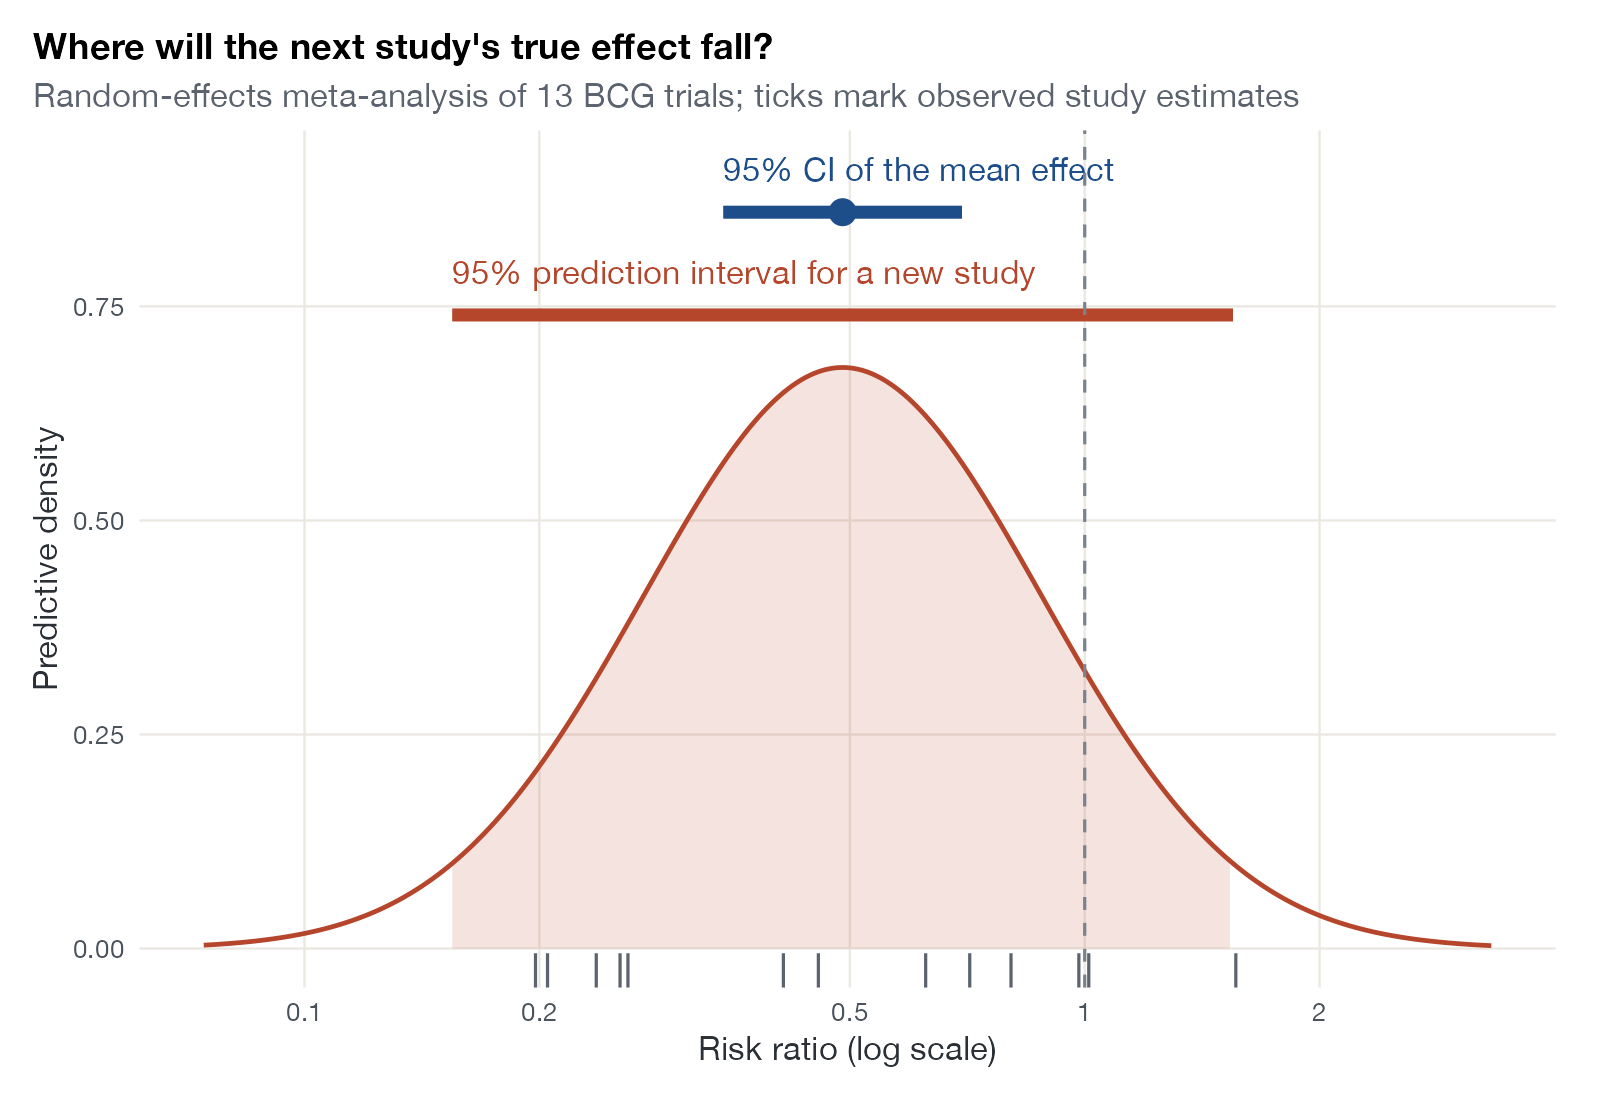
A random-effects meta-analysis estimates two different things: the average of the true effects, and how much those true effects vary between settings. The confidence interval describes only the first. The prediction interval combines the uncertainty of the mean with the between-study variance \(\tau^2\) to give the range in which the true effect of a new, comparable study is expected to fall. Plotting both on one axis makes the difference impossible to miss.
How to read it
- Horizontal axis: the effect measure, on the log scale for ratios.
- Curve: the approximate predictive distribution, normal with mean \(\hat\mu\) and variance \(\hat\tau^2 + \text{SE}(\hat\mu)^2\).
- Shaded area and lower bar: the 95% prediction interval.
- Upper bar and point: the pooled mean and its 95% confidence interval.
- Rug ticks: observed study estimates, for reference.
- Dashed line: no effect.
Interpretation
For BCG the mean risk ratio is 0.49 (95% CI 0.34 to 0.70), so the average effect is clearly protective. The prediction interval runs from about 0.14 to 1.76 and crosses 1, which says that in a new population the vaccine could plausibly offer no protection at all. The two statements are compatible: one describes the average, the other the spread.
Pitfalls
- The prediction interval describes the true effect in a new study setting, not the response of an individual patient.
- With few studies \(\tau\) is imprecisely estimated, and the interval itself is unstable. A \(t\) distribution with \(k-2\) degrees of freedom is often used to widen it.
- The normal shape is an assumption. A skewed or multimodal set of true effects is not captured.
- A prediction interval that excludes the null does not mean every setting benefits; it means that most comparable settings are expected to.
Code
library(metafor)
library(ggplot2)

# BCG vaccine trials, log risk ratios
data(dat.bcg, package = "metadat")
dat <- escalc(measure = "RR", ai = tpos, bi = tneg, ci = cpos, di = cneg,
              data = dat.bcg)
fit <- rma(yi, vi, data = dat, method = "REML")
pred <- predict(fit)

# Approximate predictive distribution of the true effect in a new study
tau2 <- fit$tau2
grid <- data.frame(x = seq(-2.6, 1.2, length.out = 400))
grid$density <- dnorm(grid$x, fit$b[1], sqrt(tau2 + fit$se^2))

ggplot(grid, aes(x, density)) +
  geom_area(data = subset(grid, x >= pred$pi.lb & x <= pred$pi.ub),
            fill = "#b5452b", alpha = 0.15) +
  geom_line(colour = "#b5452b", linewidth = 0.8) +
  geom_rug(data = dat, aes(x = yi, y = NULL), colour = "#5b636e",
           length = unit(0.04, "npc")) +
  annotate("segment", x = pred$ci.lb, xend = pred$ci.ub, y = 0.86, yend = 0.86,
           colour = "#1d4e89", linewidth = 2.2) +
  annotate("point", x = fit$b[1], y = 0.86, colour = "#1d4e89", size = 4) +
  annotate("text", x = pred$ci.lb, y = 0.91, hjust = 0, colour = "#1d4e89",
           label = "95% CI of the mean effect") +
  annotate("segment", x = pred$pi.lb, xend = pred$pi.ub, y = 0.74, yend = 0.74,
           colour = "#b5452b", linewidth = 2.2) +
  annotate("text", x = pred$pi.lb, y = 0.79, hjust = 0, colour = "#b5452b",
           label = "95% prediction interval for a new study") +
  geom_vline(xintercept = 0, linetype = "dashed", colour = "#7a828c") +
  scale_x_continuous(
    breaks = log(c(0.1, 0.2, 0.5, 1, 2)), labels = c(0.1, 0.2, 0.5, 1, 2)
  ) +
  labs(x = "Risk ratio (log scale)", y = "Predictive density",
       title = "Where will the next study's true effect fall?",
       subtitle = "Random-effects meta-analysis of 13 BCG trials; ticks mark observed study estimates")
meta esize tpos tneg cpos cneg, esize(lnrratio) random(reml)
meta summarize, eform predinterval(95)
meta forestplot, eform predintervalReferences
- Higgins JPT, Thompson SG, Spiegelhalter DJ. A re-evaluation of random-effects meta-analysis. J R Stat Soc Ser A. 2009;172:137-159. doi:10.1111/j.1467-985X.2008.00552.x
- Riley RD, Higgins JPT, Deeks JJ. Interpretation of random effects meta-analyses. BMJ. 2011;342:d549. doi:10.1136/bmj.d549
- IntHout J, Ioannidis JPA, Rovers MM, Goeman JJ. Plea for routinely presenting prediction intervals in meta-analysis. BMJ Open. 2016;6:e010247. doi:10.1136/bmjopen-2015-010247