Evidence flow diagram
Flow network of a network estimate, hat matrix flow
netmeta::Senn2013.
netmeta::hatmatrix() and igraph (shown), netmeta::netcontrib(); CINeMA
What it shows
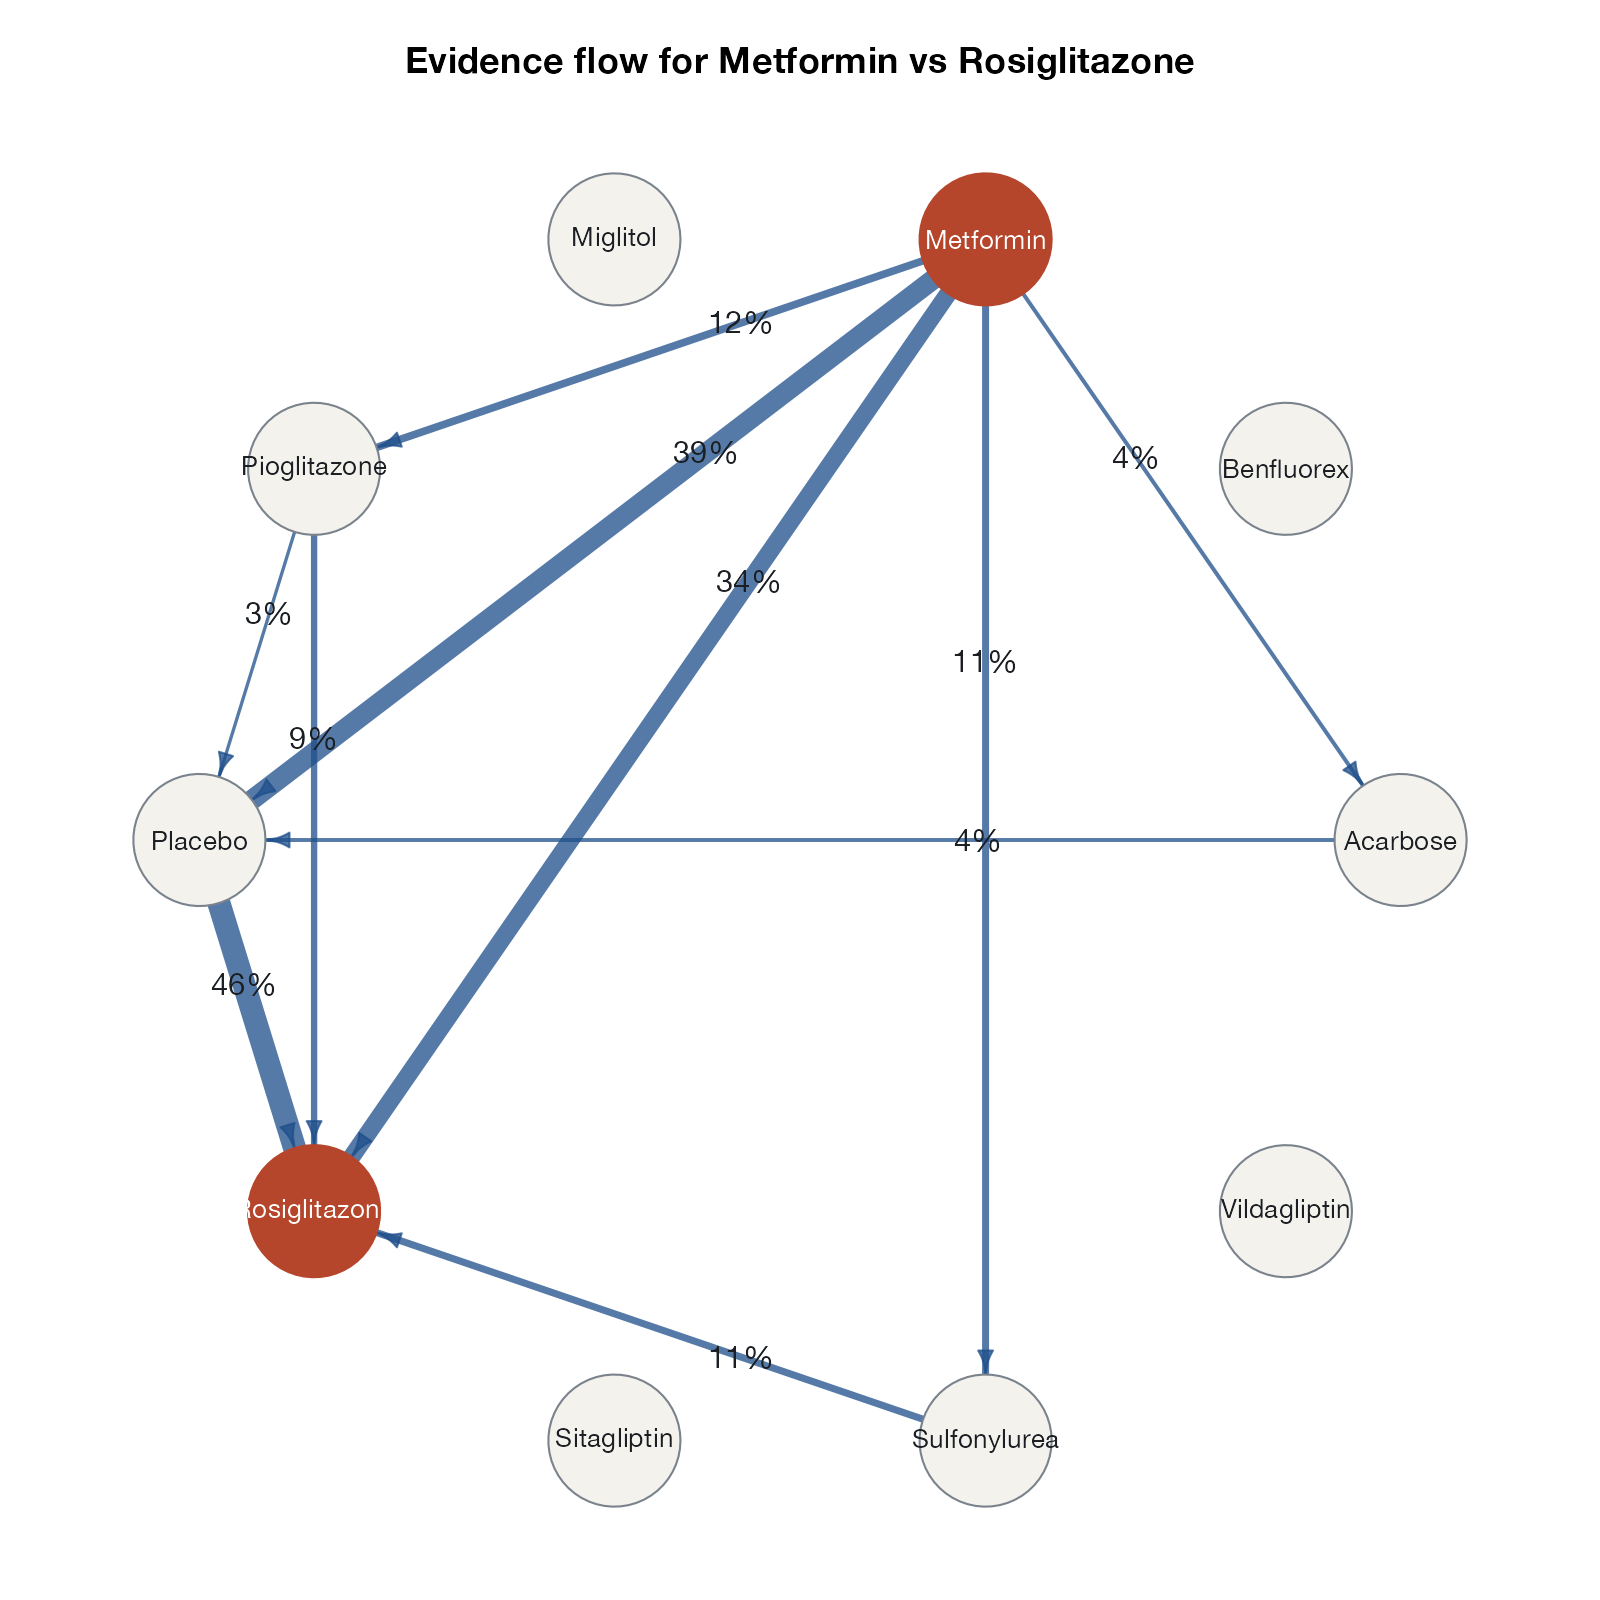
König, Krahn, and Binder showed that a row of the aggregate hat matrix of a network meta-analysis defines a flow through the network: evidence leaves one treatment, travels along direct comparisons, and arrives at the other, conserving the total like current in an electrical circuit. Drawing that flow as a directed graph makes visible which indirect paths contribute to one estimate, and how much, which is invisible in a standard network graph.
How to read it
- Nodes: treatments; the two being compared are highlighted.
- Arrows: direction of evidence flow along each direct comparison.
- Width and labels: size of the flow (hat matrix entry).
- Missing arrows: comparisons that contribute nothing to this estimate.
Interpretation
About a third of the flow from metformin to rosiglitazone travels along their direct comparison. The largest route runs through placebo (metformin to placebo, then placebo to rosiglitazone), and smaller streams pass through pioglitazone, sulfonylurea, and acarbose. The estimate therefore depends heavily on the placebo-controlled trials, and any bias in them propagates to this head-to-head comparison.
Pitfalls
- Flows are a decomposition of statistical information, not probabilities that a path is correct.
- Different decompositions (shortest path, random walk, Davies’ aggregate hat matrix) give somewhat different numbers.
- With multi-arm trials the aggregate hat matrix is an approximation.
Code
library(netmeta)
library(igraph)

data(Senn2013)

net <- netmeta(
  TE, seTE, treat1.long, treat2.long, studlab,
  data = Senn2013, sm = "MD",
  common = FALSE, reference.group = "Placebo"
)

# Row of the aggregate hat matrix for one network estimate: the flow of
# evidence along each direct comparison into the estimate of Metformin vs
# Rosiglitazone (flows leave Metformin and arrive at Rosiglitazone)
H <- hatmatrix(net, method = "Davies", type = "long")$random
target <- "Metformin:Rosiglitazone"
flow <- H[target, ]
edges <- do.call(rbind, strsplit(names(flow), ":"))

# Orient every edge in the direction evidence flows (positive weight)
from <- ifelse(flow >= 0, edges[, 1], edges[, 2])
to <- ifelse(flow >= 0, edges[, 2], edges[, 1])
g <- graph_from_data_frame(data.frame(from, to, w = abs(flow)),
                           vertices = net$trts)
g <- delete_edges(g, E(g)[w < 0.005])

set.seed(3)
layout <- layout_in_circle(g, order = V(g)[order(V(g)$name)])
highlight <- V(g)$name %in% c("Metformin", "Rosiglitazone")
par(mar = c(1, 1, 3, 1))
plot(g, layout = layout,
     edge.width = 1 + 22 * E(g)$w, edge.arrow.size = 0.6,
     edge.color = adjustcolor("#1d4e89", 0.75),
     edge.label = sprintf("%.0f%%", 100 * E(g)$w), edge.label.cex = 0.95,
     edge.label.color = "#1b1f24", edge.label.family = "Helvetica Neue",
     vertex.color = ifelse(highlight, "#b5452b", "#f4f2ed"),
     vertex.frame.color = ifelse(highlight, "#b5452b", "#7a828c"),
     vertex.size = 22, vertex.label.cex = 0.8, vertex.label.family = "Helvetica Neue",
     vertex.label.color = ifelse(highlight, "white", "#1b1f24"))
title("Evidence flow for Metformin vs Rosiglitazone", cex.main = 1.1)
References
- König J, Krahn U, Binder H. Visualizing the flow of evidence in network meta-analysis and characterizing mixed treatment comparisons. Stat Med. 2013;32:5414-5429. doi:10.1002/sim.6001
- Davies AL, Papakonstantinou T, Nikolakopoulou A, Rücker G, Galla T. Network meta-analysis and random walks. Stat Med. 2022;41:2091-2114. doi:10.1002/sim.9346