A bar chart race shows how a ranking changes over time. It suits panel data where the same entities are measured repeatedly and their order is the point: which countries lead, which have caught up, when a position changed hands. This vignette covers the data it expects, the arguments that shape it, and how to write the animation to a file.
The data
ggrace() takes long data with one row per entity per
time point and three bare column names: the value that sets the bar
length, the label, and the time.
head(clefts_qci)
#>   country iso        region year       qci
#> 1  Brazil  br Latin America 1990  0.000000
#> 2  Brazil  br Latin America 1991  2.922546
#> 3  Brazil  br Latin America 1992  6.361471
#> 4  Brazil  br Latin America 1993 12.062058
#> 5  Brazil  br Latin America 1994 19.362466
#> 6  Brazil  br Latin America 1995 29.275937
clefts_qci holds the Quality of Care Index for orofacial
clefts in fifteen countries from 1990 to 2019, taken from Sofi-Mahmudi
et al. (2025). Higher is better care. Each country appears once per
year, which is what the function requires: a repeated country and year
pair is an error rather than a silent average.
race <- ggrace(
  clefts_qci,
  value = qci,
  name = country,
  time = year,
  top_n = 15,
  duration = 15,
  title = "Quality of care for orofacial clefts",
  caption = "Source: Sofi-Mahmudi et al. 2025, PLOS ONE 20(1): e0317267"
)

race
Printed, the race plays in the page, like the package’s other graphs:
the round button plays and pauses it, clicking or dragging along the
timeline moves to any time, and the arrow keys step from one year to the
next. Hovering over a bar shows its value and rank at that moment, and
clicking one follows it through the race while the others fade.
graph_save(race, "race.html") writes it as a single web
page.
The object holds one row per entity per frame, already interpolated,
and the widget plays exactly these frames, so it matches the GIF or
video that animate_race() writes.
head(race$frames)
#>   frame time    name    value rank
#> 1     1 1990  Brazil  0.00000   15
#> 2     1 1990   Chile 96.70909    2
#> 3     1 1990   China 14.52871   14
#> 4     1 1990   Egypt 90.42298    5
#> 5     1 1990 Germany 98.60005    1
#> 6     1 1990   India 80.40029    9
Looking at one frame
Every frame is an ordinary ggplot object, so it can be
printed, saved with ggplot2::ggsave(), or inspected before
committing to a full render.
race_frame(race, 1)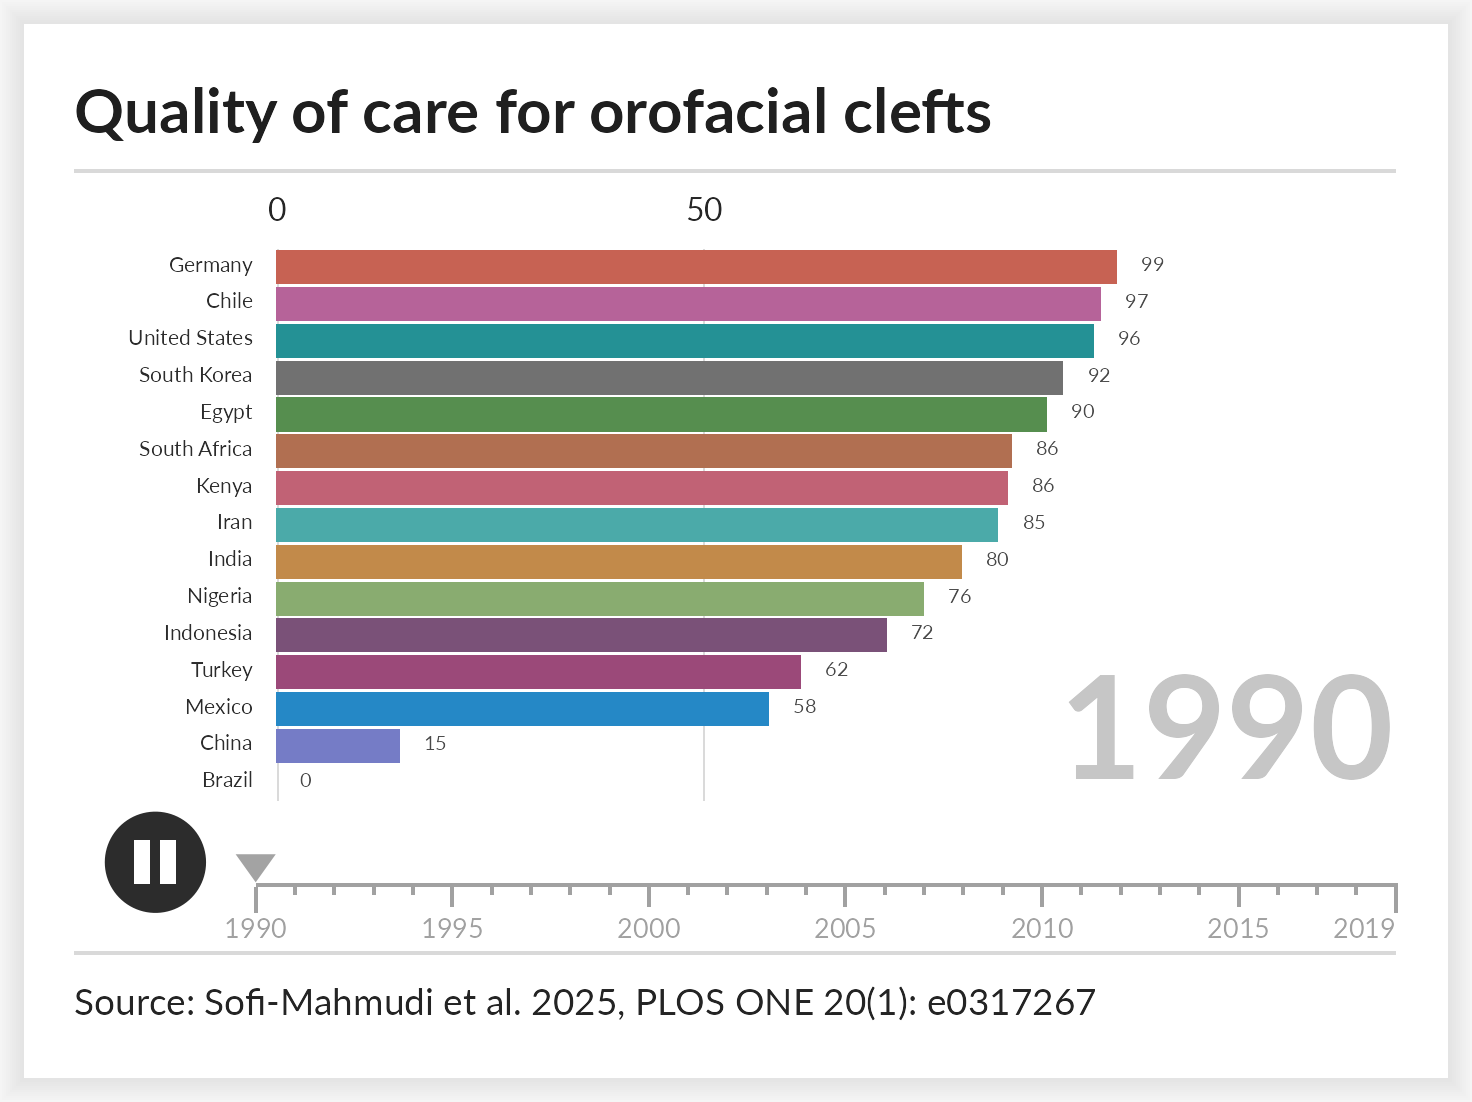
race_frame(race, race$n_frames)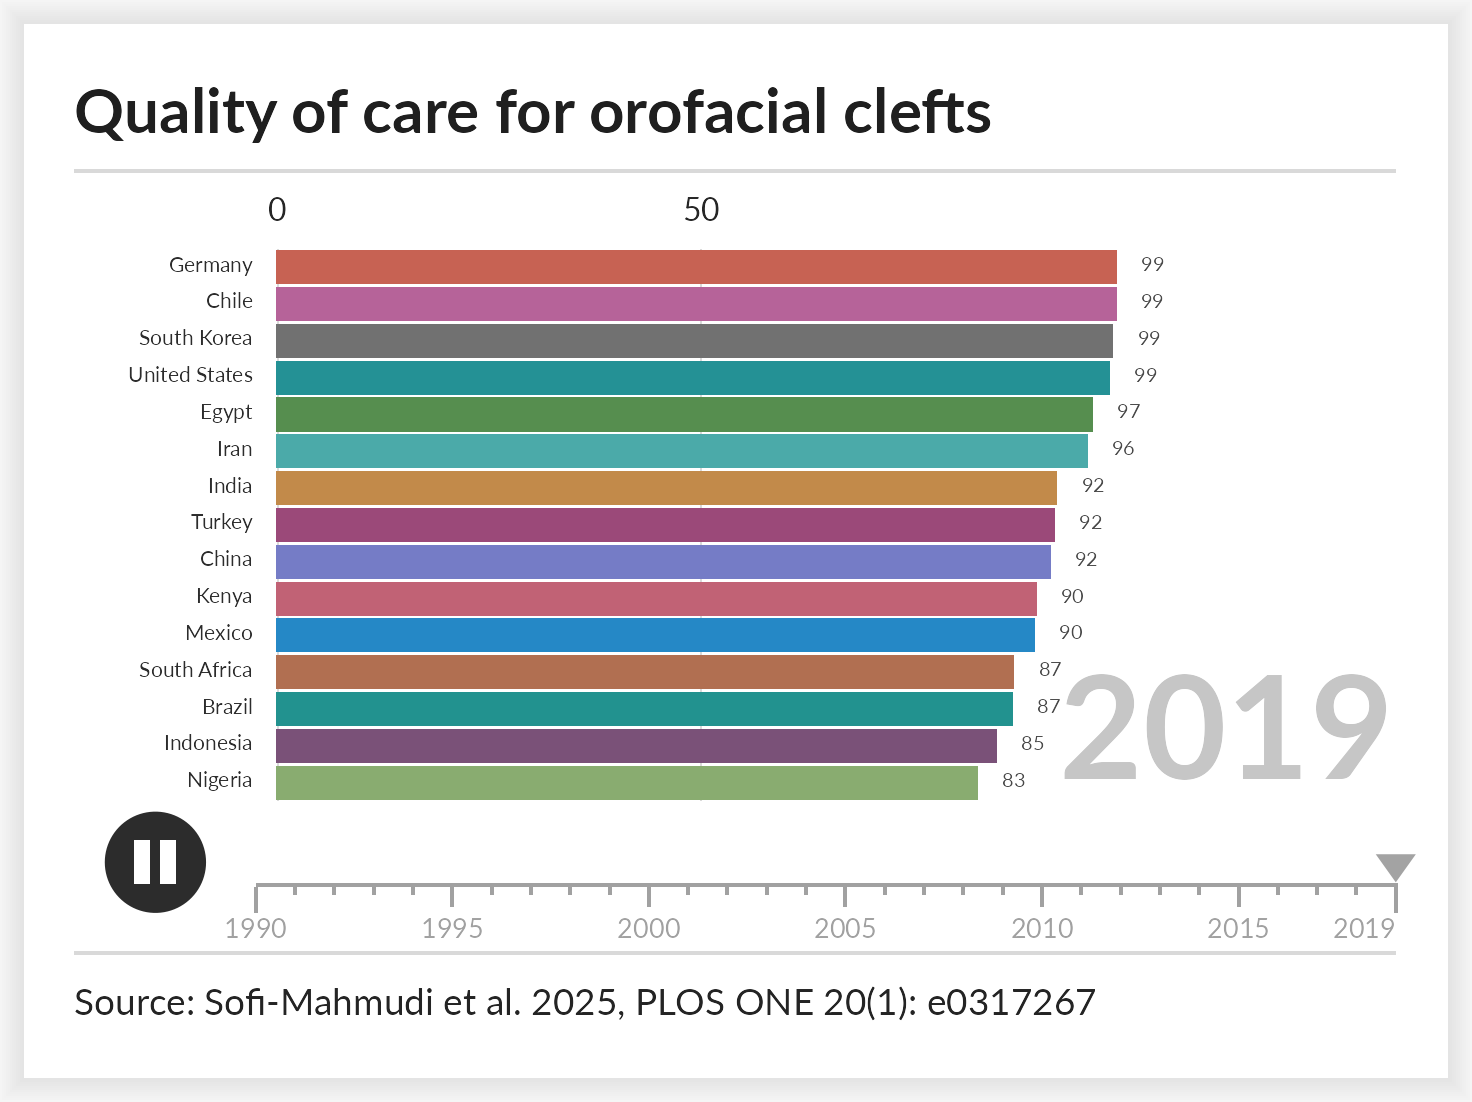
Frames are set in Lato, which the package registers when it loads.
Devices that understand registered fonts, such as
ragg::agg_png(), will use it; the older pdf()
and png() devices will not, so draw with ragg or pass
family = "" to fall back to the device default.
Writing the animation
animate_race() draws every frame and encodes them. The
encoder follows the file extension: .gif uses gifski,
falling back to magick, and anything else is treated as video and uses
av, falling back to an ffmpeg binary on the search
path.
animate_race(race, "clefts.mp4")
animate_race(race, "clefts.gif")
Frames are independent, so they are drawn across cores by default.
Pass cores = 1 to force a single core, which is also what
happens on Windows.
Arguments worth knowing
| argument | effect |
|---|---|
top_n |
how many bars are visible at once |
duration, fps, end_pause
|
length in seconds, frame rate, hold on the last frame |
swap |
seconds a bar takes to move into a new rank |
group |
color bars by category and draw a legend |
palette |
a color vector, or one named by entity or category |
breaks |
gridline positions, a function or a fixed vector |
label_value, label_time
|
formatters for the bar numbers and the large time label |
images |
pictures to sit at the end of the bars |
timeline, play_button,
card
|
turn off the timeline strip, the button, or the card |
width, res
|
output size; the whole layout scales with width
|
top_n smaller than the field is where a race earns its
keep. Entities outside the visible window wait just below it and slide
in when they qualify.
top10 <- ggrace(
  clefts_qci, qci, country, year,
  top_n = 10,
  duration = 15,
  title = "Ten highest scoring countries"
)

race_frame(top10, round(top10$n_frames / 2))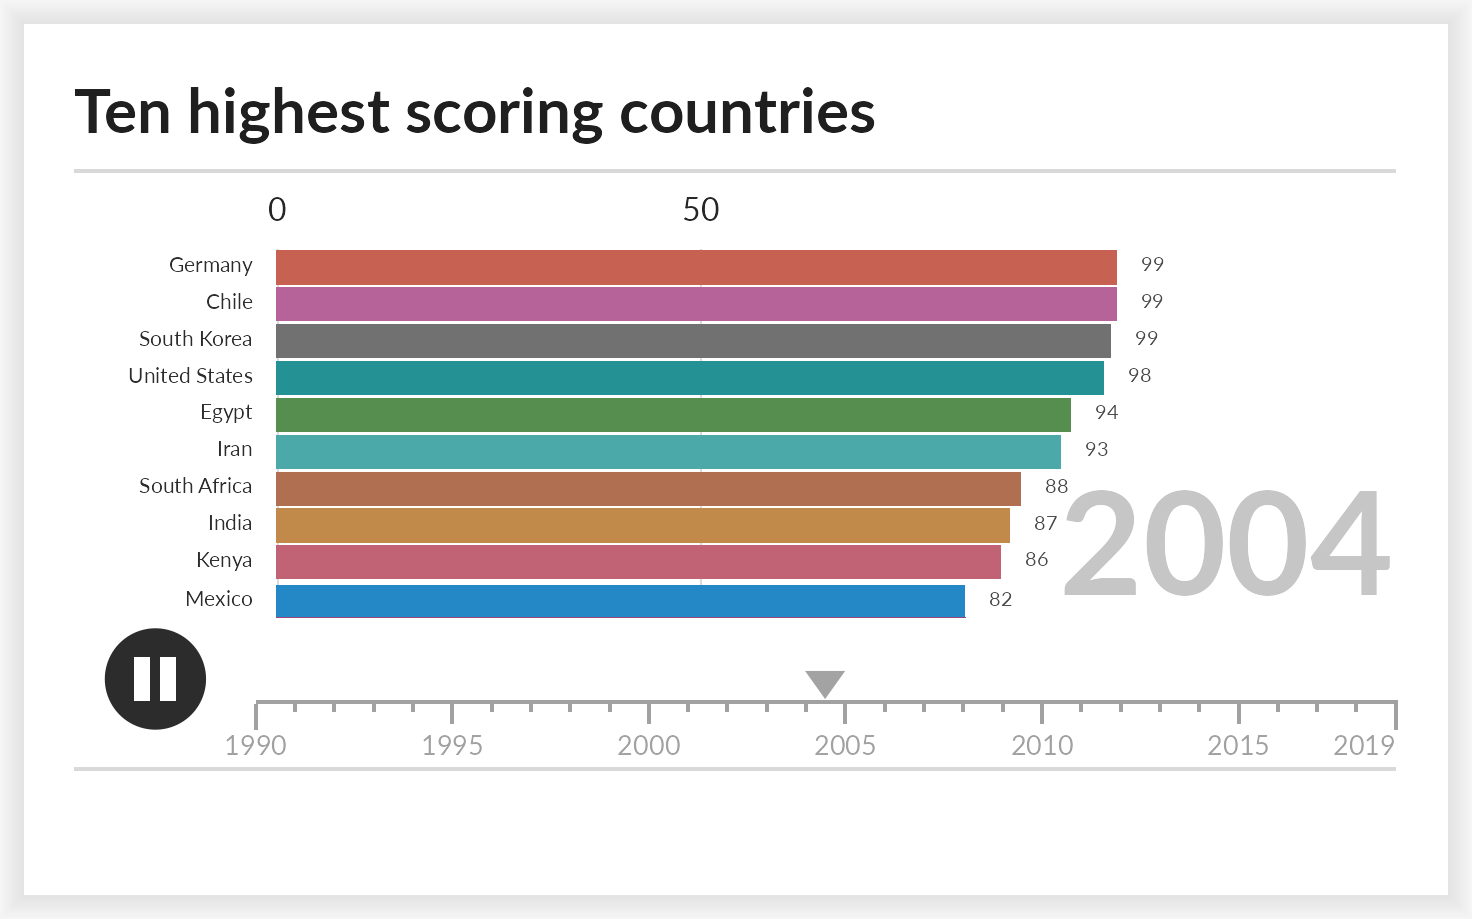
Coloring by group
By default each entity gets its own color. When entities fall into
categories, pass the column that names them as group: bars
are then colored by category and a legend appears above the axis.
regional <- ggrace(
  clefts_qci, qci, country, year,
  group = region,
  legend_title = "Region",
  top_n = 15,
  duration = 15,
  breaks = scales::breaks_extended(6),
  title = "Quality of care for orofacial clefts"
)

race_frame(regional, regional$n_frames)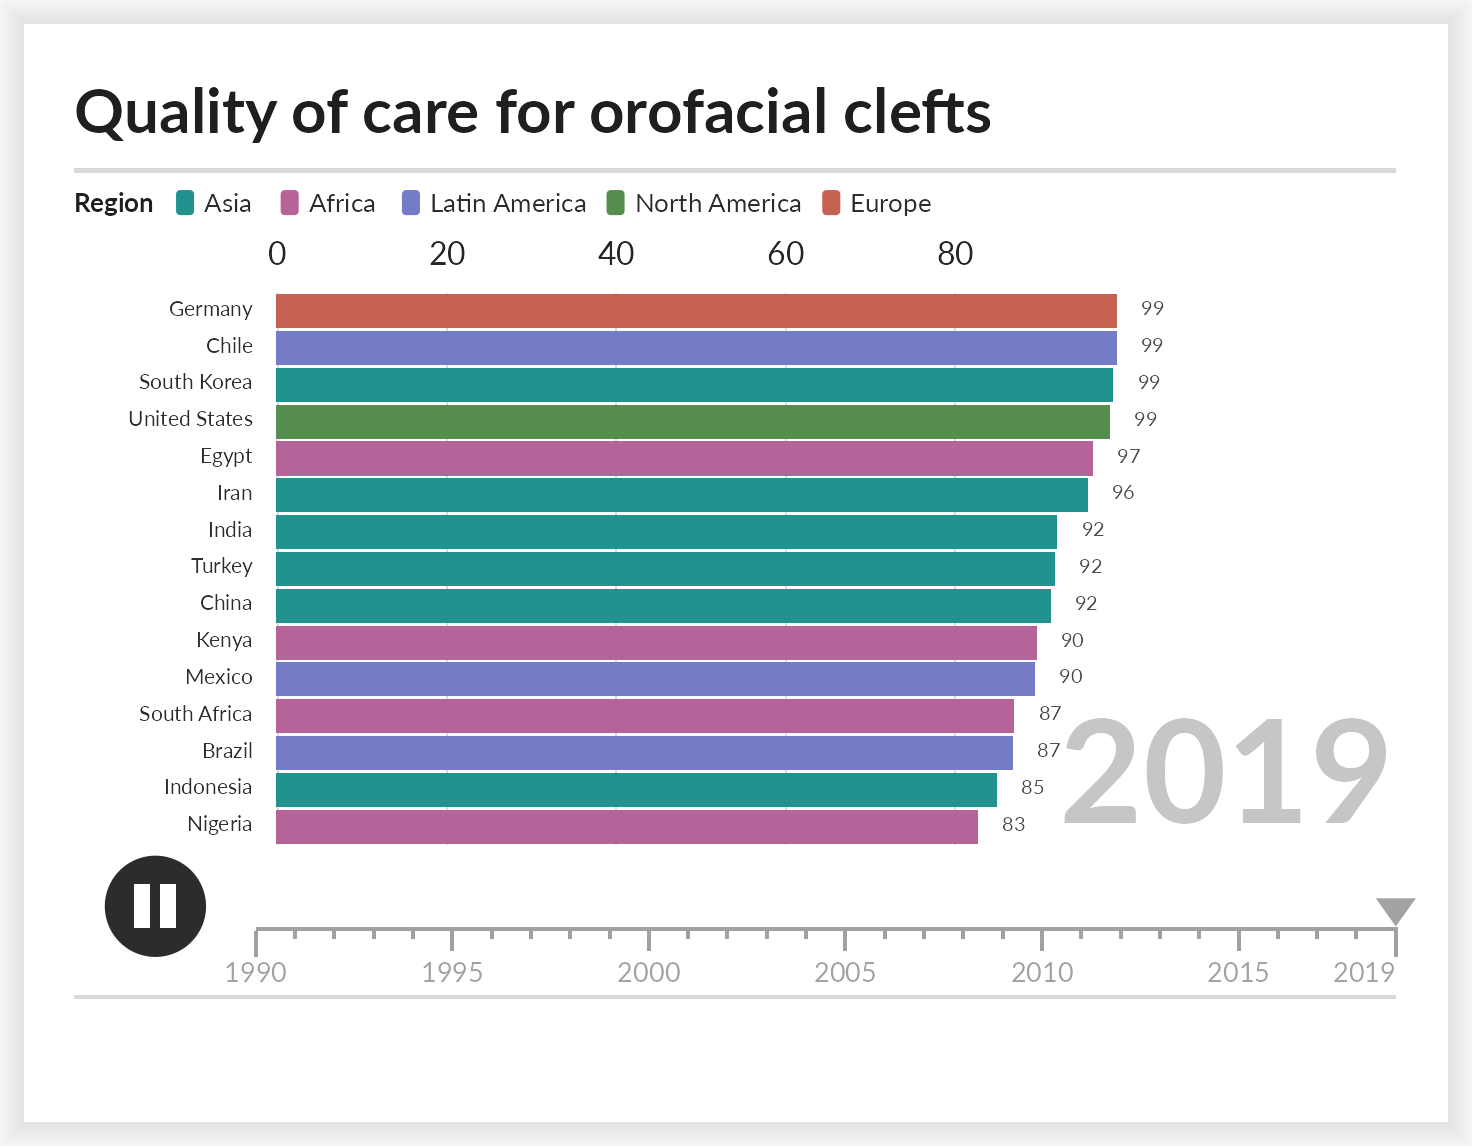
Each entity must belong to exactly one category, or the coloring
would be ambiguous and the function stops. A factor keeps the legend in
the order of its levels; anything else is sorted. The card grows to make
room for the legend and wraps onto further rows when the categories do
not fit across it, so nothing is pushed off the edge. Set
legend = FALSE to keep the coloring and drop the
legend.
Images on the bars
images takes a character vector of image file paths
named by entity. Pictures are cropped to a circle and right aligned just
inside the end of the bar. Entities with no image simply get none.
The package bundles a circular flag for every ISO 3166-1 country,
plus Kurdistan, so country races need no extra files.
race_flags() maps names or codes to those paths.
key <- unique(clefts_qci[c("country", "iso")])
flags <- setNames(race_flags(key$iso), key$country)

flagged <- ggrace(
  clefts_qci, qci, country, year,
  top_n = 15,
  duration = 15,
  images = flags,
  breaks = scales::breaks_extended(6),
  title = "Quality of care for orofacial clefts"
)

flagged
The flags travel with their bars in the widget, as in the GIF and video.
Lookup tries the two letter code, the three letter code, the full country name, then a unique partial match. The names follow the World Bank style, so a few common spellings do not match and the code is the reliable key.
subset(race_flag_codes(), grepl("Korea|Turk", country))
#>     code code3                   country
#> 117   kp   prk Korea, Dem. People's Rep.
#> 118   kr   kor               Korea, Rep.
#> 208   tc   tca  Turks and Caicos Islands
#> 216   tm   tkm              Turkmenistan
#> 219   tr   tur                   Turkiye
Any image works, not only flags: pass paths to logos, portraits or team crests in the same way.