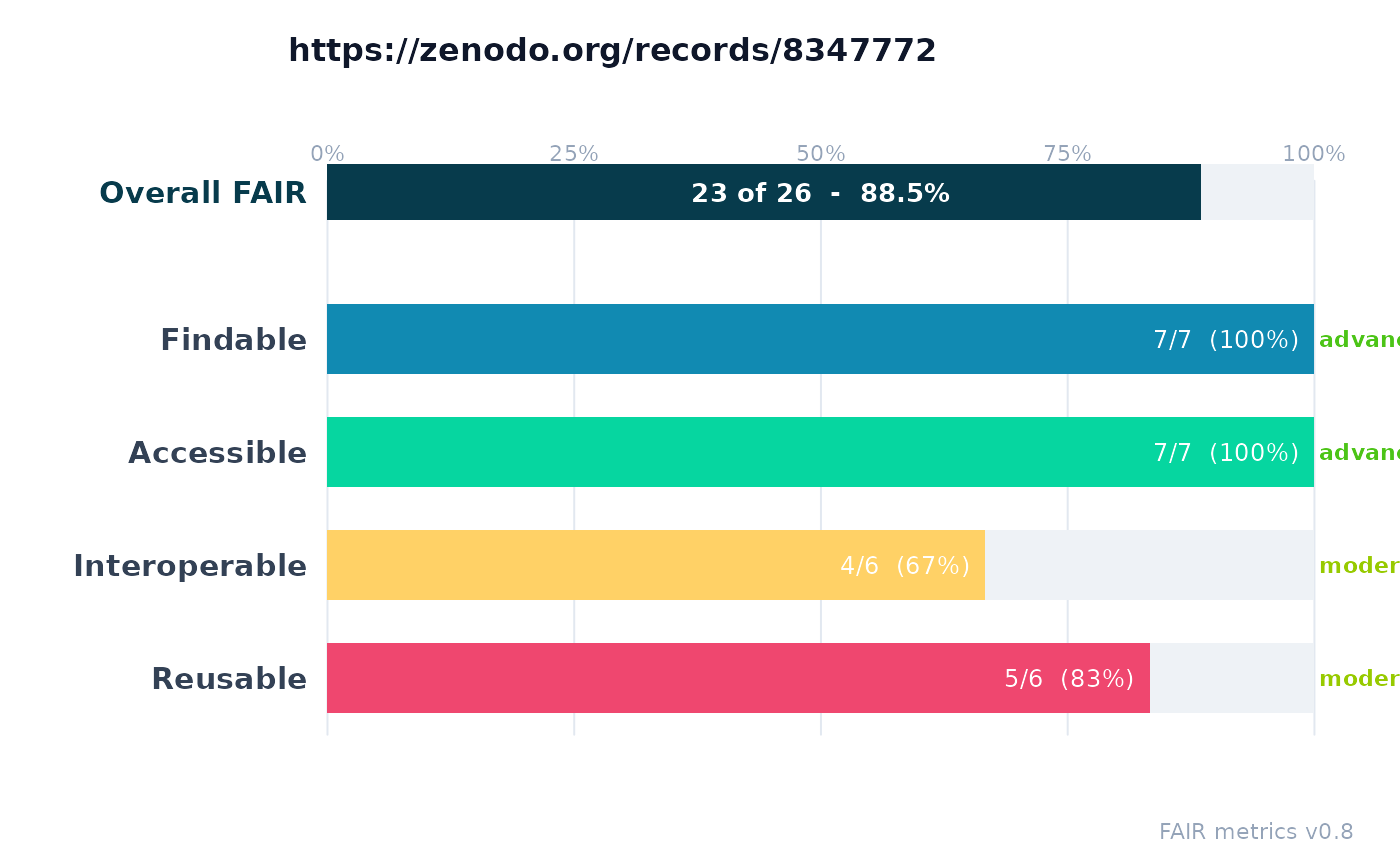
Draws a compact, readable scorecard of a fair_assessment
using base graphics (no extra package dependencies). It is the quickest way to
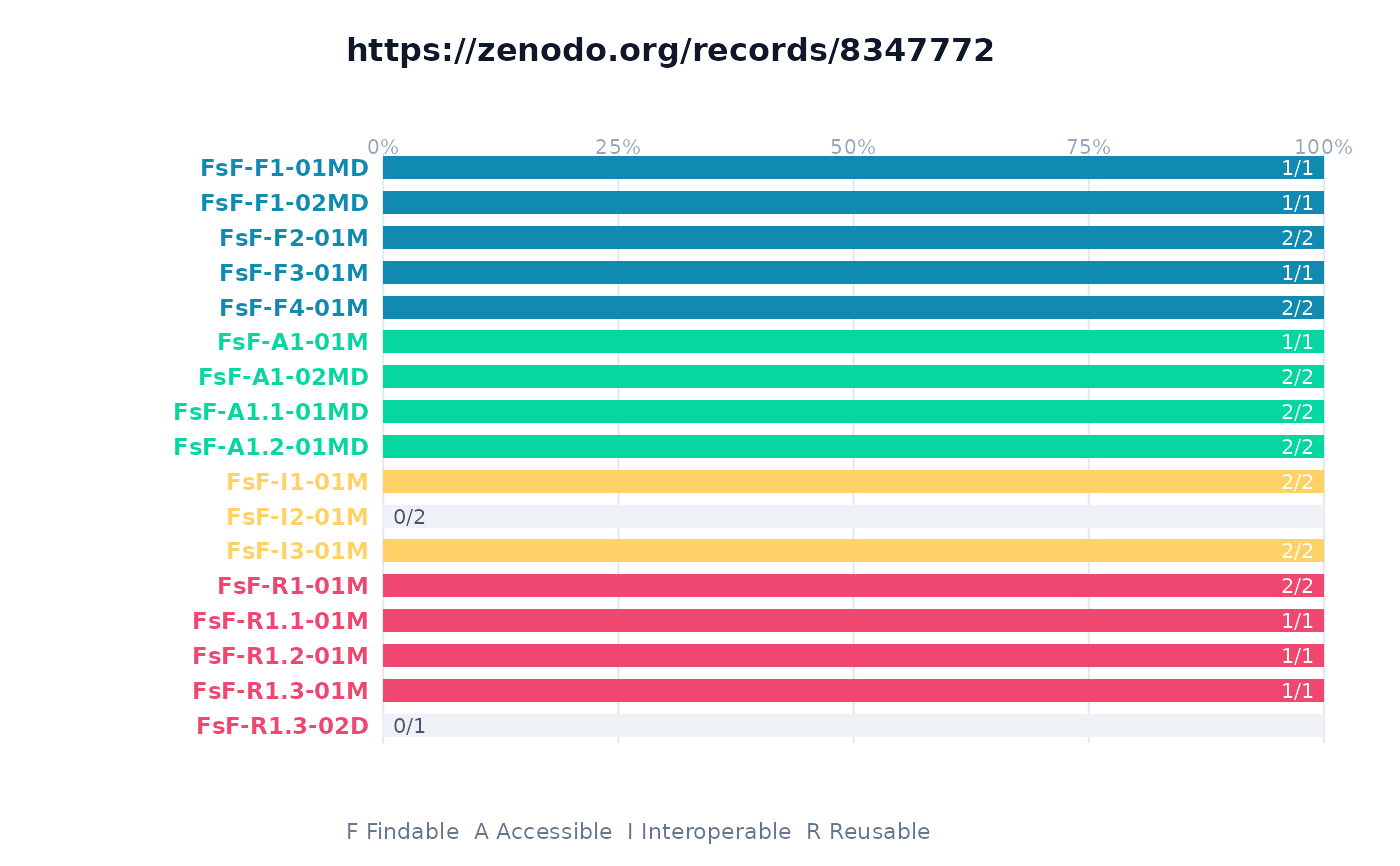
see an assessment: a horizontal progress bar per FAIR category (or per
metric), each annotated with its score and CMMI maturity level. See
vignette("illustrating-fairness") for worked examples.
Arguments
- x
A
fair_assessmentobject returned byassess_fair().- type
What to draw.
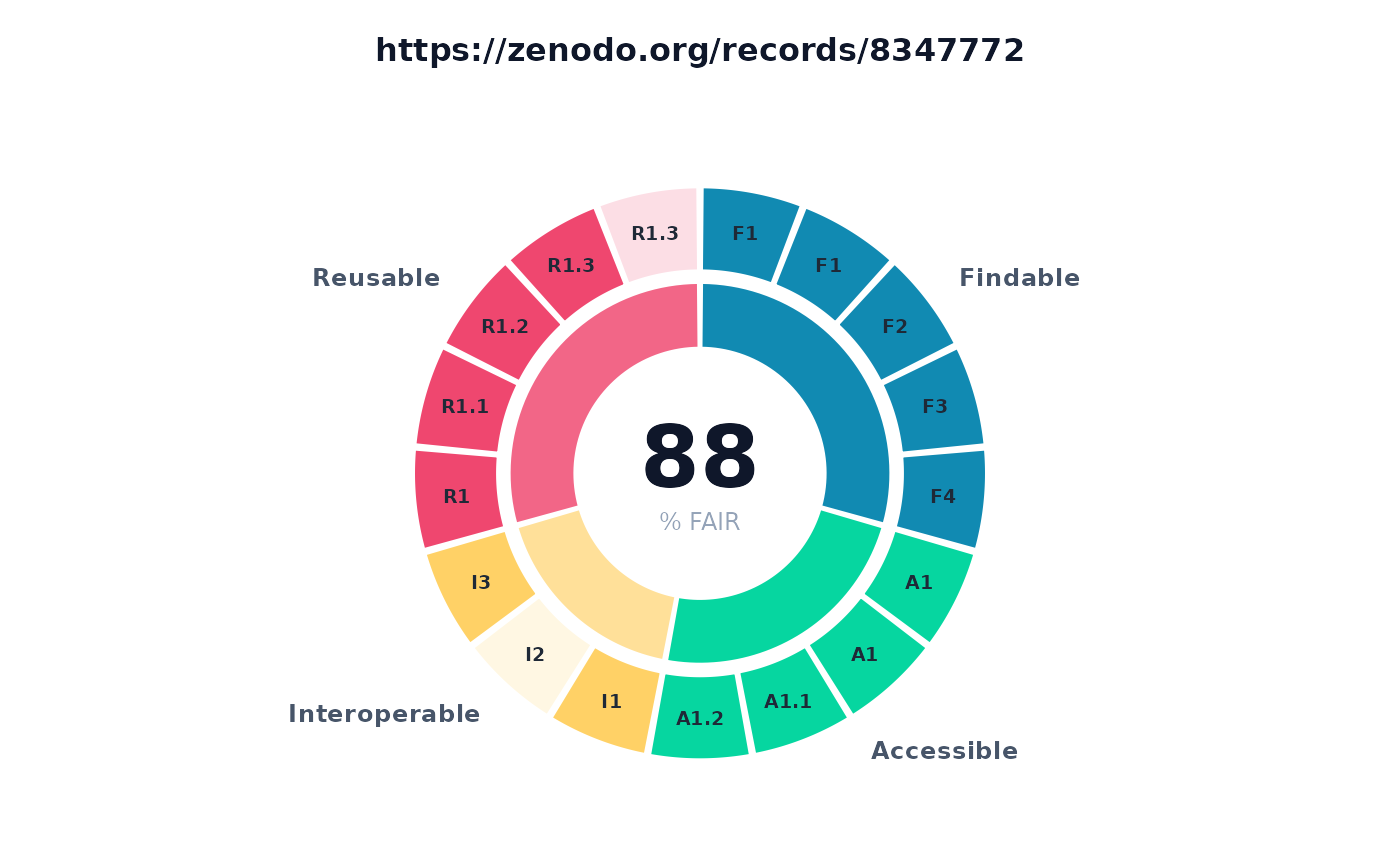
"category"(default) draws one bar per FAIR category (Findable, Accessible, Interoperable, Reusable) plus the overall score;"metric"draws one bar per individual metric, grouped and colored by category;"sunburst"draws a concentric sunburst (an inner ring of the F/A/I/R categories and an outer ring of the individual metrics, each filled in proportion to its score) with the overall FAIR percentage in the center.- colors
Named character vector of category fill colors, with names
"F","A","I","R".- show_maturity
Logical; annotate each bar with its maturity level. Defaults to
TRUEfortype = "category".- main
Title. Defaults to the resolved identifier (or the input id).
- ...
Ignored (for S3 method compatibility).